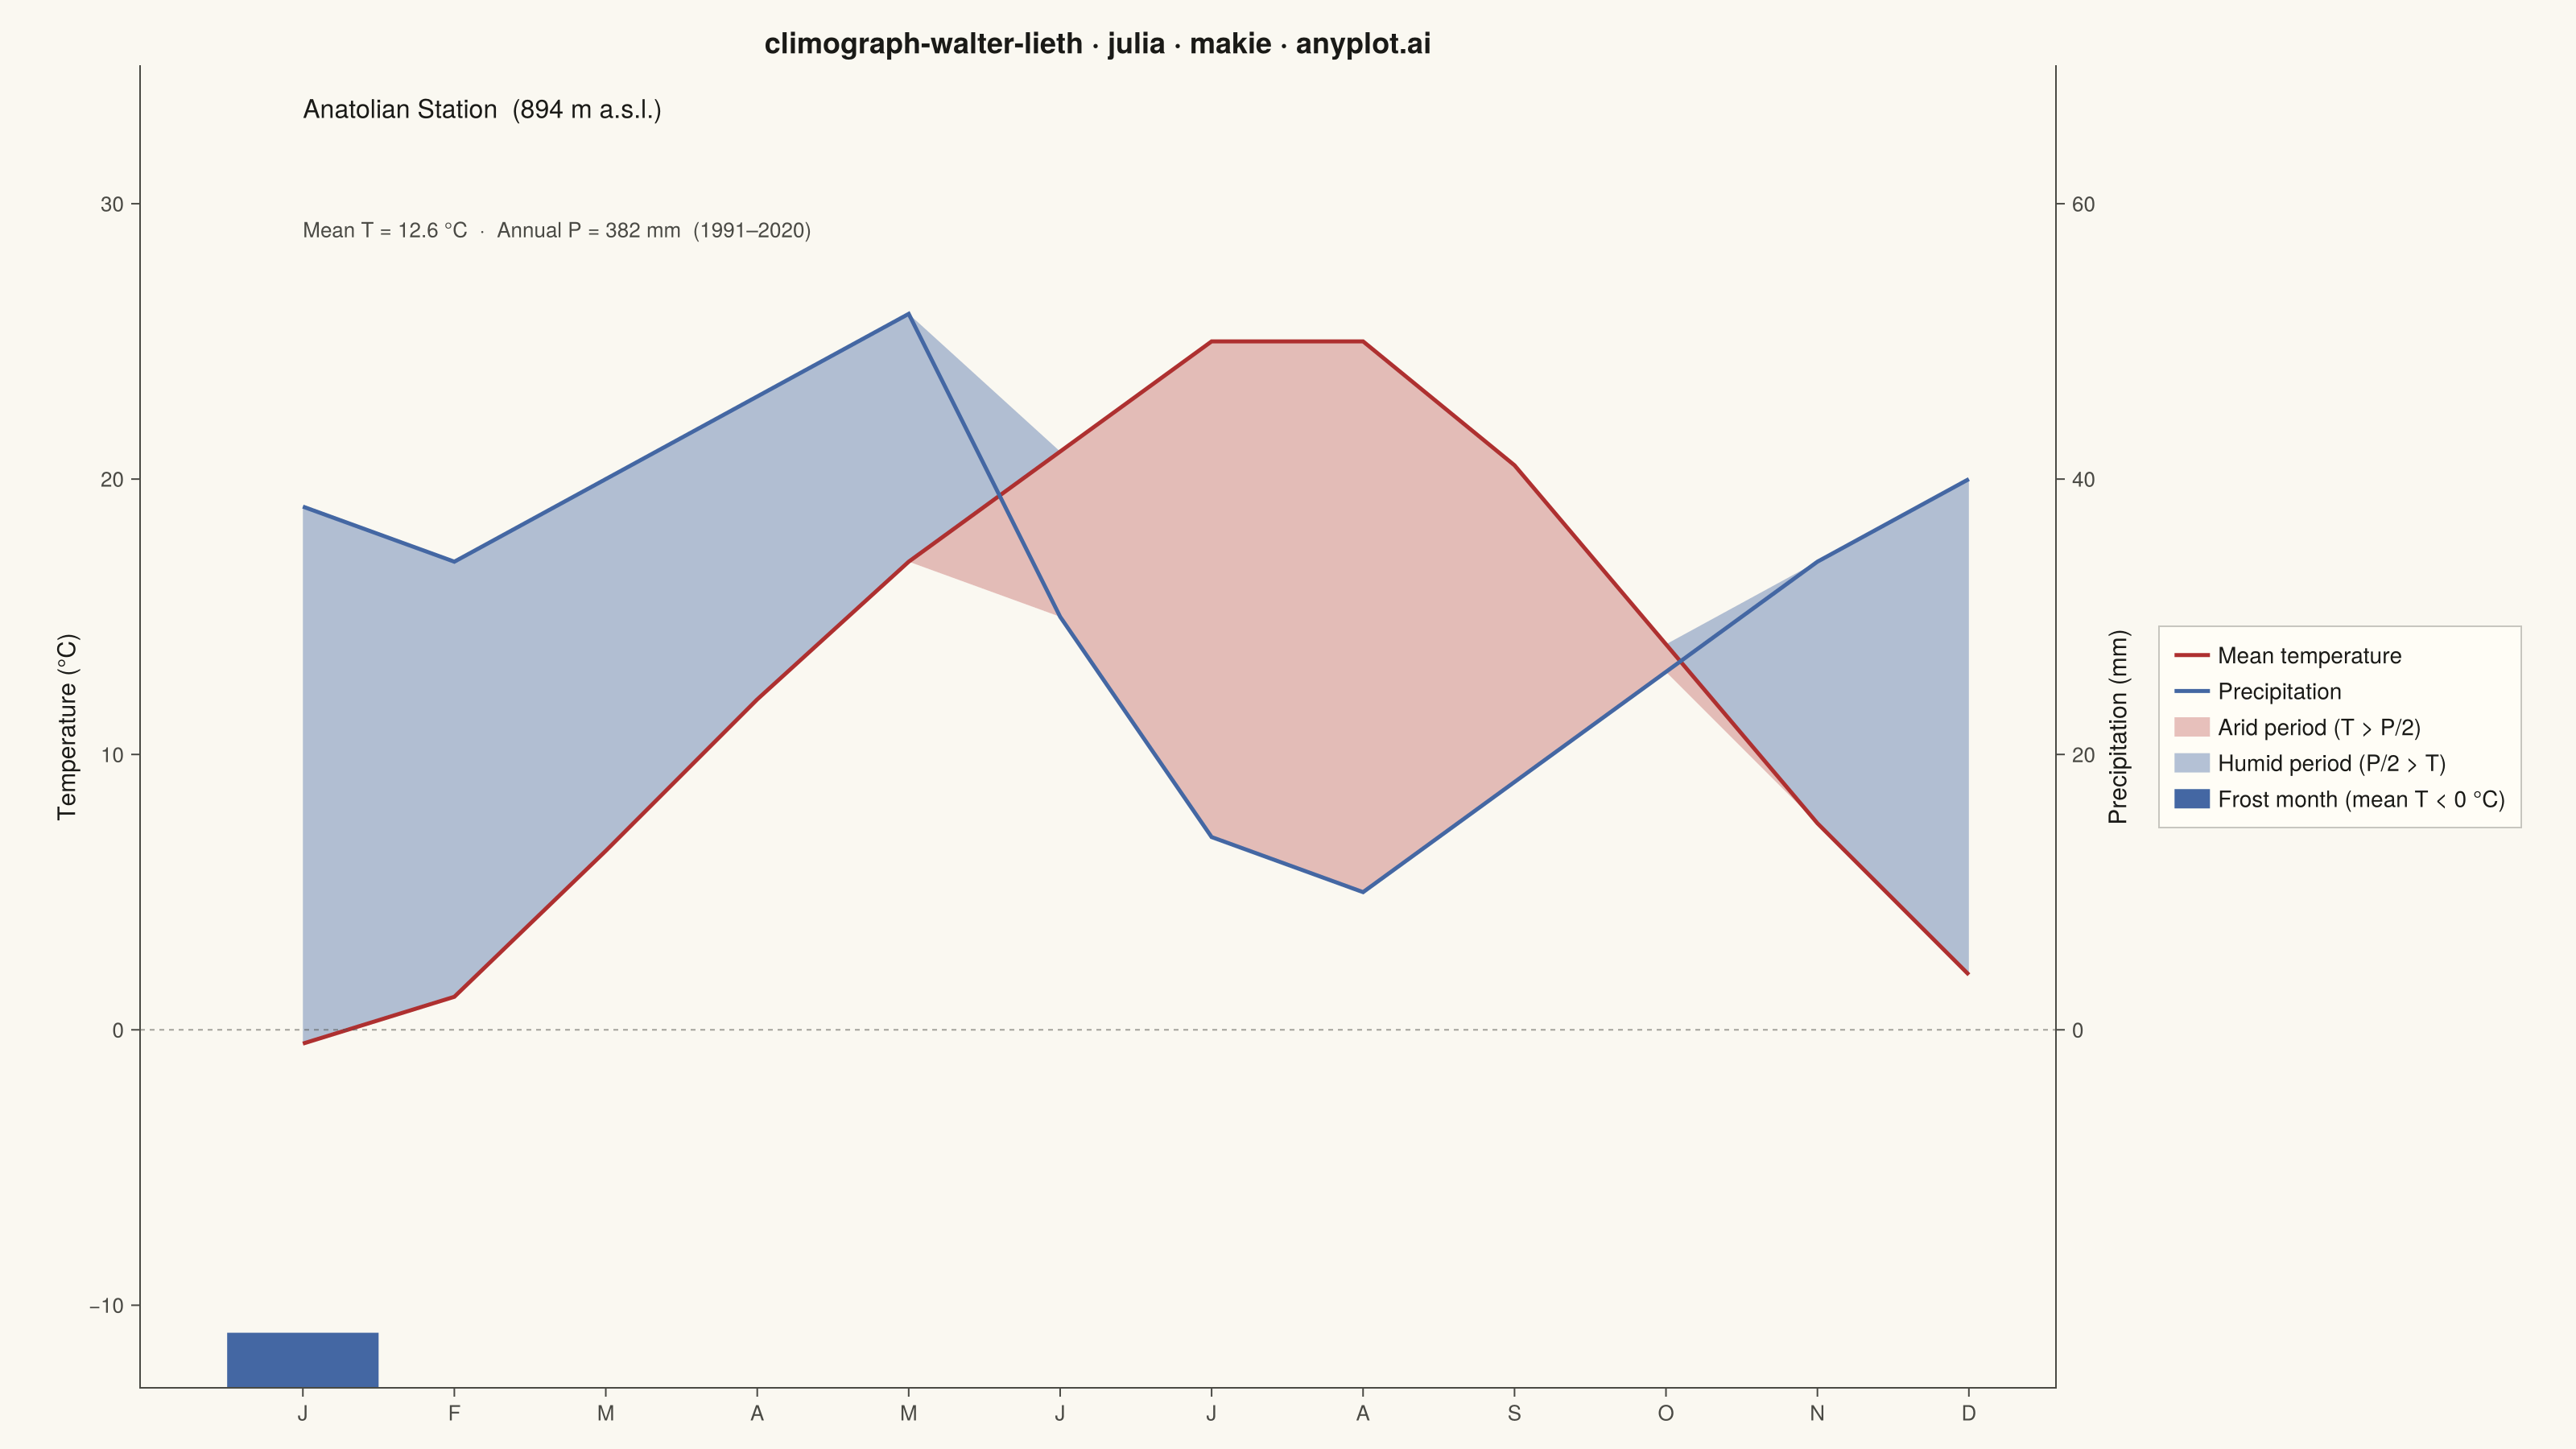
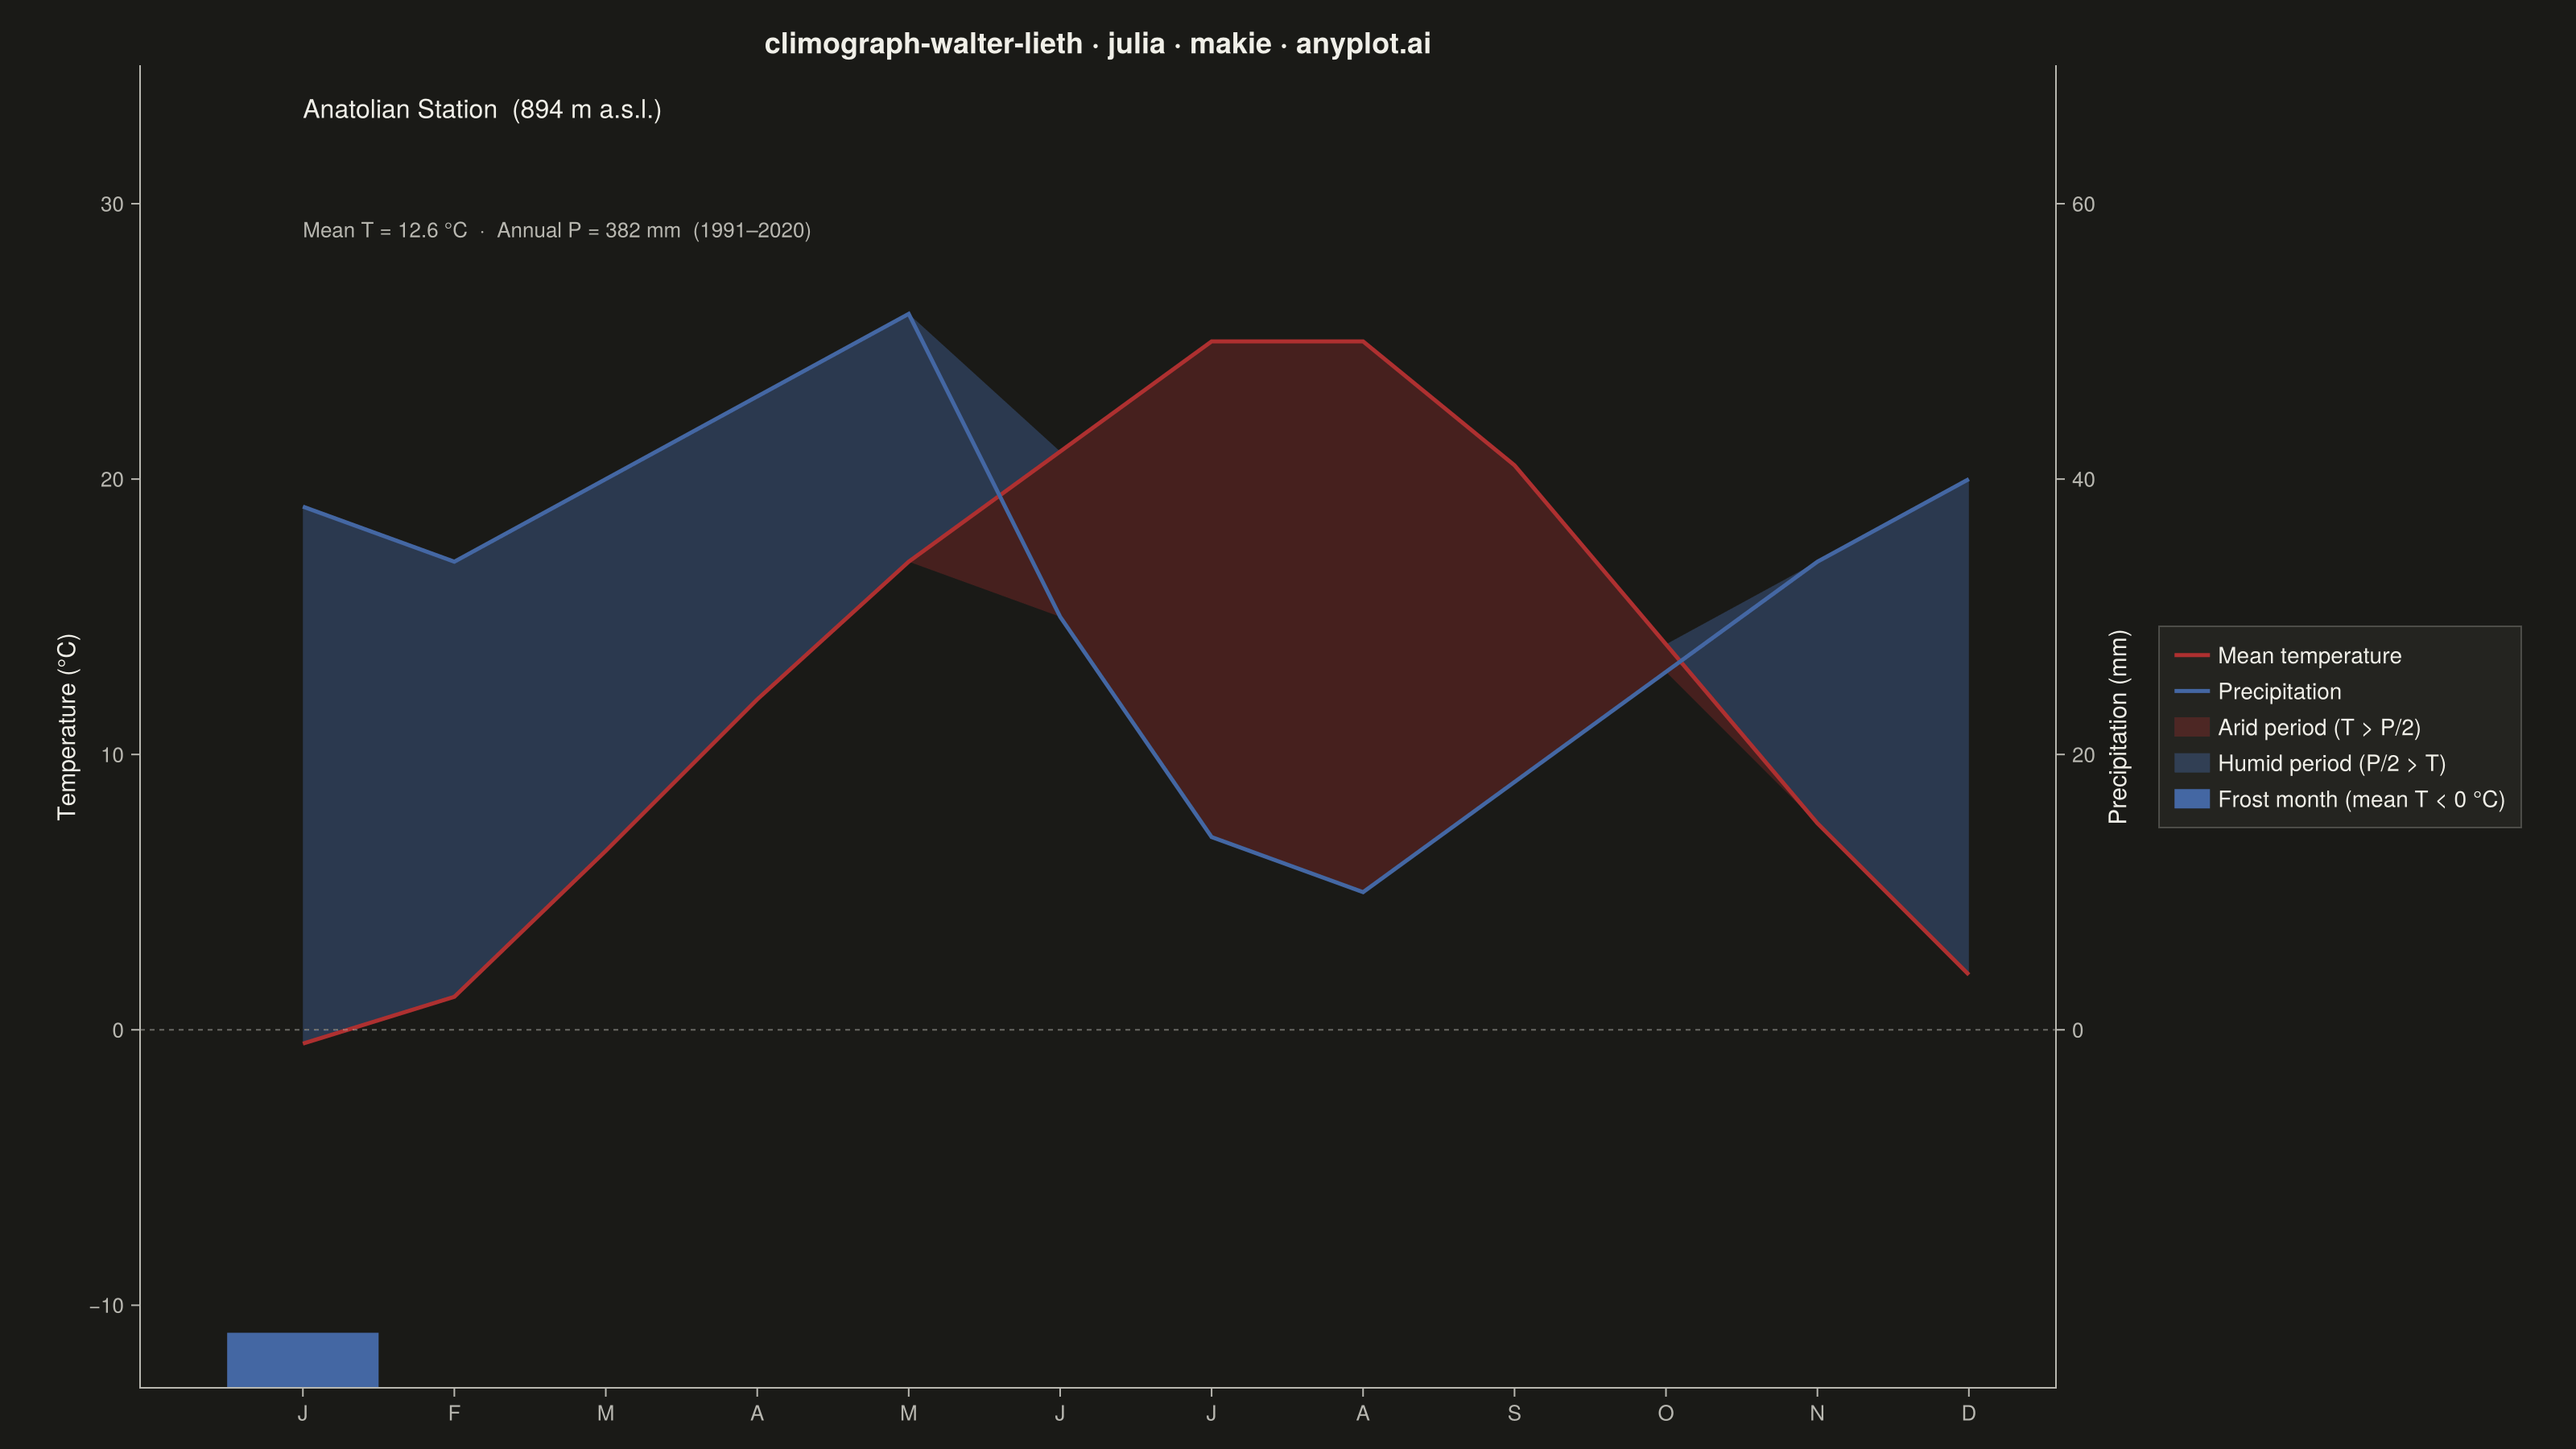
A Walter-Lieth climate diagram (climograph) is the canonical visualization of a location's annual climate, plotting monthly mean temperature and monthly precipitation over the twelve months on a single panel. It uses the classic 1:2 axis-scaling convention where 10 °C on the temperature axis aligns with 20 mm on the precipitation axis, so the relationship between the two curves directly reveals water availability: where precipitation exceeds the temperature curve the period is humid (filled blue/hatched), and where the temperature curve rises above precipitation the period is arid (filled red/dotted). A header carries station metadata and annual means, while frost indicators along the baseline mark cold months.
# anyplot.ai
# climograph-walter-lieth: Walter-Lieth Climate Diagram
# Library: makie 0.22.10 | Julia 1.11.9
# Quality: 90/100 | Created: 2026-06-15

using CairoMakie
using Colors
using Statistics

const THEME       = get(ENV, "ANYPLOT_THEME", "light")
const PAGE_BG     = THEME == "light" ? colorant"#FAF8F1" : colorant"#1A1A17"
const ELEVATED_BG = THEME == "light" ? colorant"#FFFDF6" : colorant"#242420"
const INK         = THEME == "light" ? colorant"#1A1A17" : colorant"#F0EFE8"
const INK_SOFT    = THEME == "light" ? colorant"#4A4A44" : colorant"#B8B7B0"
const INK_MUTED   = THEME == "light" ? colorant"#6B6A63" : colorant"#A8A79F"

# Temperature->red, precipitation->blue: universal climate diagram convention
# (semantic exception to Imprint palette ordinal ordering)
const TEMP_COL   = colorant"#AE3030"  # Imprint matte red
const PRECIP_COL = colorant"#4467A3"  # Imprint blue

# Station: fictional Anatolian-style semi-arid continental climate
# 1991-2020 climate normals; one frost month, clear summer arid period
const STATION  = "Anatolian Station"
const ELEV     = 894
const MLBLS    = ["J","F","M","A","M","J","J","A","S","O","N","D"]
const TEMP_ARR = Float64[-0.5, 1.2, 6.5, 12.0, 17.0, 21.0, 25.0, 25.0, 20.5, 14.0, 7.5, 2.0]
const PREC_ARR = Float64[38.0, 34.0, 40.0, 46.0, 52.0, 30.0, 14.0, 10.0, 18.0, 26.0, 34.0, 40.0]
const ANN_T    = round(mean(TEMP_ARR); digits=1)
const ANN_P    = Int(round(sum(PREC_ARR)))

const xs      = collect(1.0:12.0)
const prec_sc = PREC_ARR ./ 2.0  # Walter-Lieth 1:2 scaling (10 degC = 20 mm)

# Y limits: buffer below -10 for the frost indicator band
const Y_BOT   = -13.0
const Y_TOP   = 35.0
const FRO_BOT = -13.0
const FRO_TOP = -11.0

fig = Figure(
    size            = (1600, 900),
    fontsize        = 14,
    backgroundcolor = PAGE_BG,
)

# Left axis: temperature (degrees C)
ax = Axis(
    fig[1, 1];
    title             = "climograph-walter-lieth · julia · makie · anyplot.ai",
    titlesize         = 18,
    titlecolor        = INK,
    backgroundcolor   = PAGE_BG,
    ylabel            = "Temperature (°C)",
    ylabelsize        = 15,
    ylabelcolor       = INK,
    xlabelcolor       = INK,
    xticklabelsize    = 13,
    yticklabelsize    = 13,
    xticklabelcolor   = INK_SOFT,
    yticklabelcolor   = INK_SOFT,
    xtickcolor        = INK_SOFT,
    ytickcolor        = INK_SOFT,
    leftspinecolor    = INK_SOFT,
    bottomspinecolor  = INK_SOFT,
    topspinevisible   = false,
    rightspinevisible = false,
    xgridvisible      = false,
    ygridvisible      = false,
    xticks            = (collect(1:12), MLBLS),
    yticks            = collect(-10:10:30),
)
ylims!(ax, Y_BOT, Y_TOP)

# Right axis: precipitation (mm), scaled 2:1 against the temperature axis
# ylims are set so that 10 degC on the left = 20 mm on the right
ax_r = Axis(
    fig[1, 1];
    yaxisposition      = :right,
    backgroundcolor    = :transparent,
    rightspinecolor    = INK_SOFT,
    yticklabelcolor    = INK_SOFT,
    ytickcolor         = INK_SOFT,
    topspinevisible    = false,
    leftspinevisible   = false,
    bottomspinevisible = false,
    xticksvisible      = false,
    xticklabelsvisible = false,
    xlabelvisible      = false,
    xgridvisible       = false,
    ygridvisible       = false,
    ylabel             = "Precipitation (mm)",
    ylabelsize         = 15,
    ylabelcolor        = INK,
    yticklabelsize     = 13,
    yticks             = ([0.0, 20.0, 40.0, 60.0], ["0", "20", "40", "60"]),
)
ylims!(ax_r, Y_BOT * 2, Y_TOP * 2)

linkxaxes!(ax, ax_r)
xlims!(ax, 0.5, 12.5)

# Humid fill (blue): months where precipitation curve exceeds temperature curve
band!(ax, xs, TEMP_ARR, max.(TEMP_ARR, prec_sc); color = (PRECIP_COL, 0.40))

# Arid fill (red): months where temperature curve exceeds precipitation curve
band!(ax, xs, min.(TEMP_ARR, prec_sc), TEMP_ARR; color = (TEMP_COL, 0.30))

# Temperature line (on left axis)
lines!(ax, xs, TEMP_ARR; color = TEMP_COL, linewidth = 2.5)

# Precipitation line (on right axis, raw mm values)
lines!(ax_r, xs, PREC_ARR; color = PRECIP_COL, linewidth = 2.5)

# Dashed 0 degC reference line
hlines!(ax, [0.0]; color = (INK_SOFT, 0.5), linewidth = 1.0, linestyle = :dash)

# Frost indicator blocks for months with mean T < 0 degC
for (i, t) in enumerate(TEMP_ARR)
    if t < 0.0
        poly!(ax,
            [Point2f(i - 0.5, FRO_BOT), Point2f(i + 0.5, FRO_BOT),
             Point2f(i + 0.5, FRO_TOP), Point2f(i - 0.5, FRO_TOP)];
            color = PRECIP_COL, strokewidth = 0)
    end
end

# Station metadata header (data coordinates on left axis)
text!(ax, 1.0, 34.0;
    text     = "$(STATION)  ($(ELEV) m a.s.l.)",
    fontsize = 16,
    color    = INK,
    align    = (:left, :top),
)
text!(ax, 1.0, 29.5;
    text     = "Mean T = $(ANN_T) °C  ·  Annual P = $(ANN_P) mm  (1991–2020)",
    fontsize = 13,
    color    = INK_SOFT,
    align    = (:left, :top),
)

# Legend
leg_elems = [
    LineElement(color = TEMP_COL, linewidth = 2.5),
    LineElement(color = PRECIP_COL, linewidth = 2.5),
    PolyElement(color = (TEMP_COL, 0.30), strokecolor = :transparent),
    PolyElement(color = (PRECIP_COL, 0.40), strokecolor = :transparent),
    PolyElement(color = PRECIP_COL, strokecolor = :transparent),
]
leg_labels = [
    "Mean temperature",
    "Precipitation",
    "Arid period (T > P/2)",
    "Humid period (P/2 > T)",
    "Frost month (mean T < 0 °C)",
]
Legend(fig[1, 2], leg_elems, leg_labels;
    framecolor        = (INK_SOFT, 0.3),
    backgroundcolor   = ELEVATED_BG,
    labelcolor   = INK,
    framevisible = true,
    framewidth   = 1,
    patchsize    = (22, 12),
    rowgap       = 6,
    padding      = (10, 10, 10, 10),
)

colsize!(fig.layout, 1, Relative(0.82))

save("plot-$(THEME).png", fig; px_per_unit = 2)
Runnable source as JSON, for any HTTP client: https://api.anyplot.ai/specs/climograph-walter-lieth/makie/code. Any spec id and library id listed in llms-full.txt fit the same URL shape; every URL below is complete and callable.
{
  "spec_id": "climograph-walter-lieth",
  "language": "julia",
  "library": "makie",
  "page": "https://anyplot.ai/climograph-walter-lieth/julia/makie",
  "hub": "https://anyplot.ai/climograph-walter-lieth",
  "code_json": "https://api.anyplot.ai/specs/climograph-walter-lieth/makie/code",
  "spec_json": "https://api.anyplot.ai/specs/climograph-walter-lieth",
  "render_light_png": "https://storage.googleapis.com/anyplot-images/plots/climograph-walter-lieth/julia/makie/plot-light.png",
  "render_dark_png": "https://storage.googleapis.com/anyplot-images/plots/climograph-walter-lieth/julia/makie/plot-dark.png",
  "quality_score": 90.0,
  "license": "MIT",
  "guide": "https://anyplot.ai/llms.txt"
}
Part of Walter-Lieth Climate Diagram on anyplot.ai.