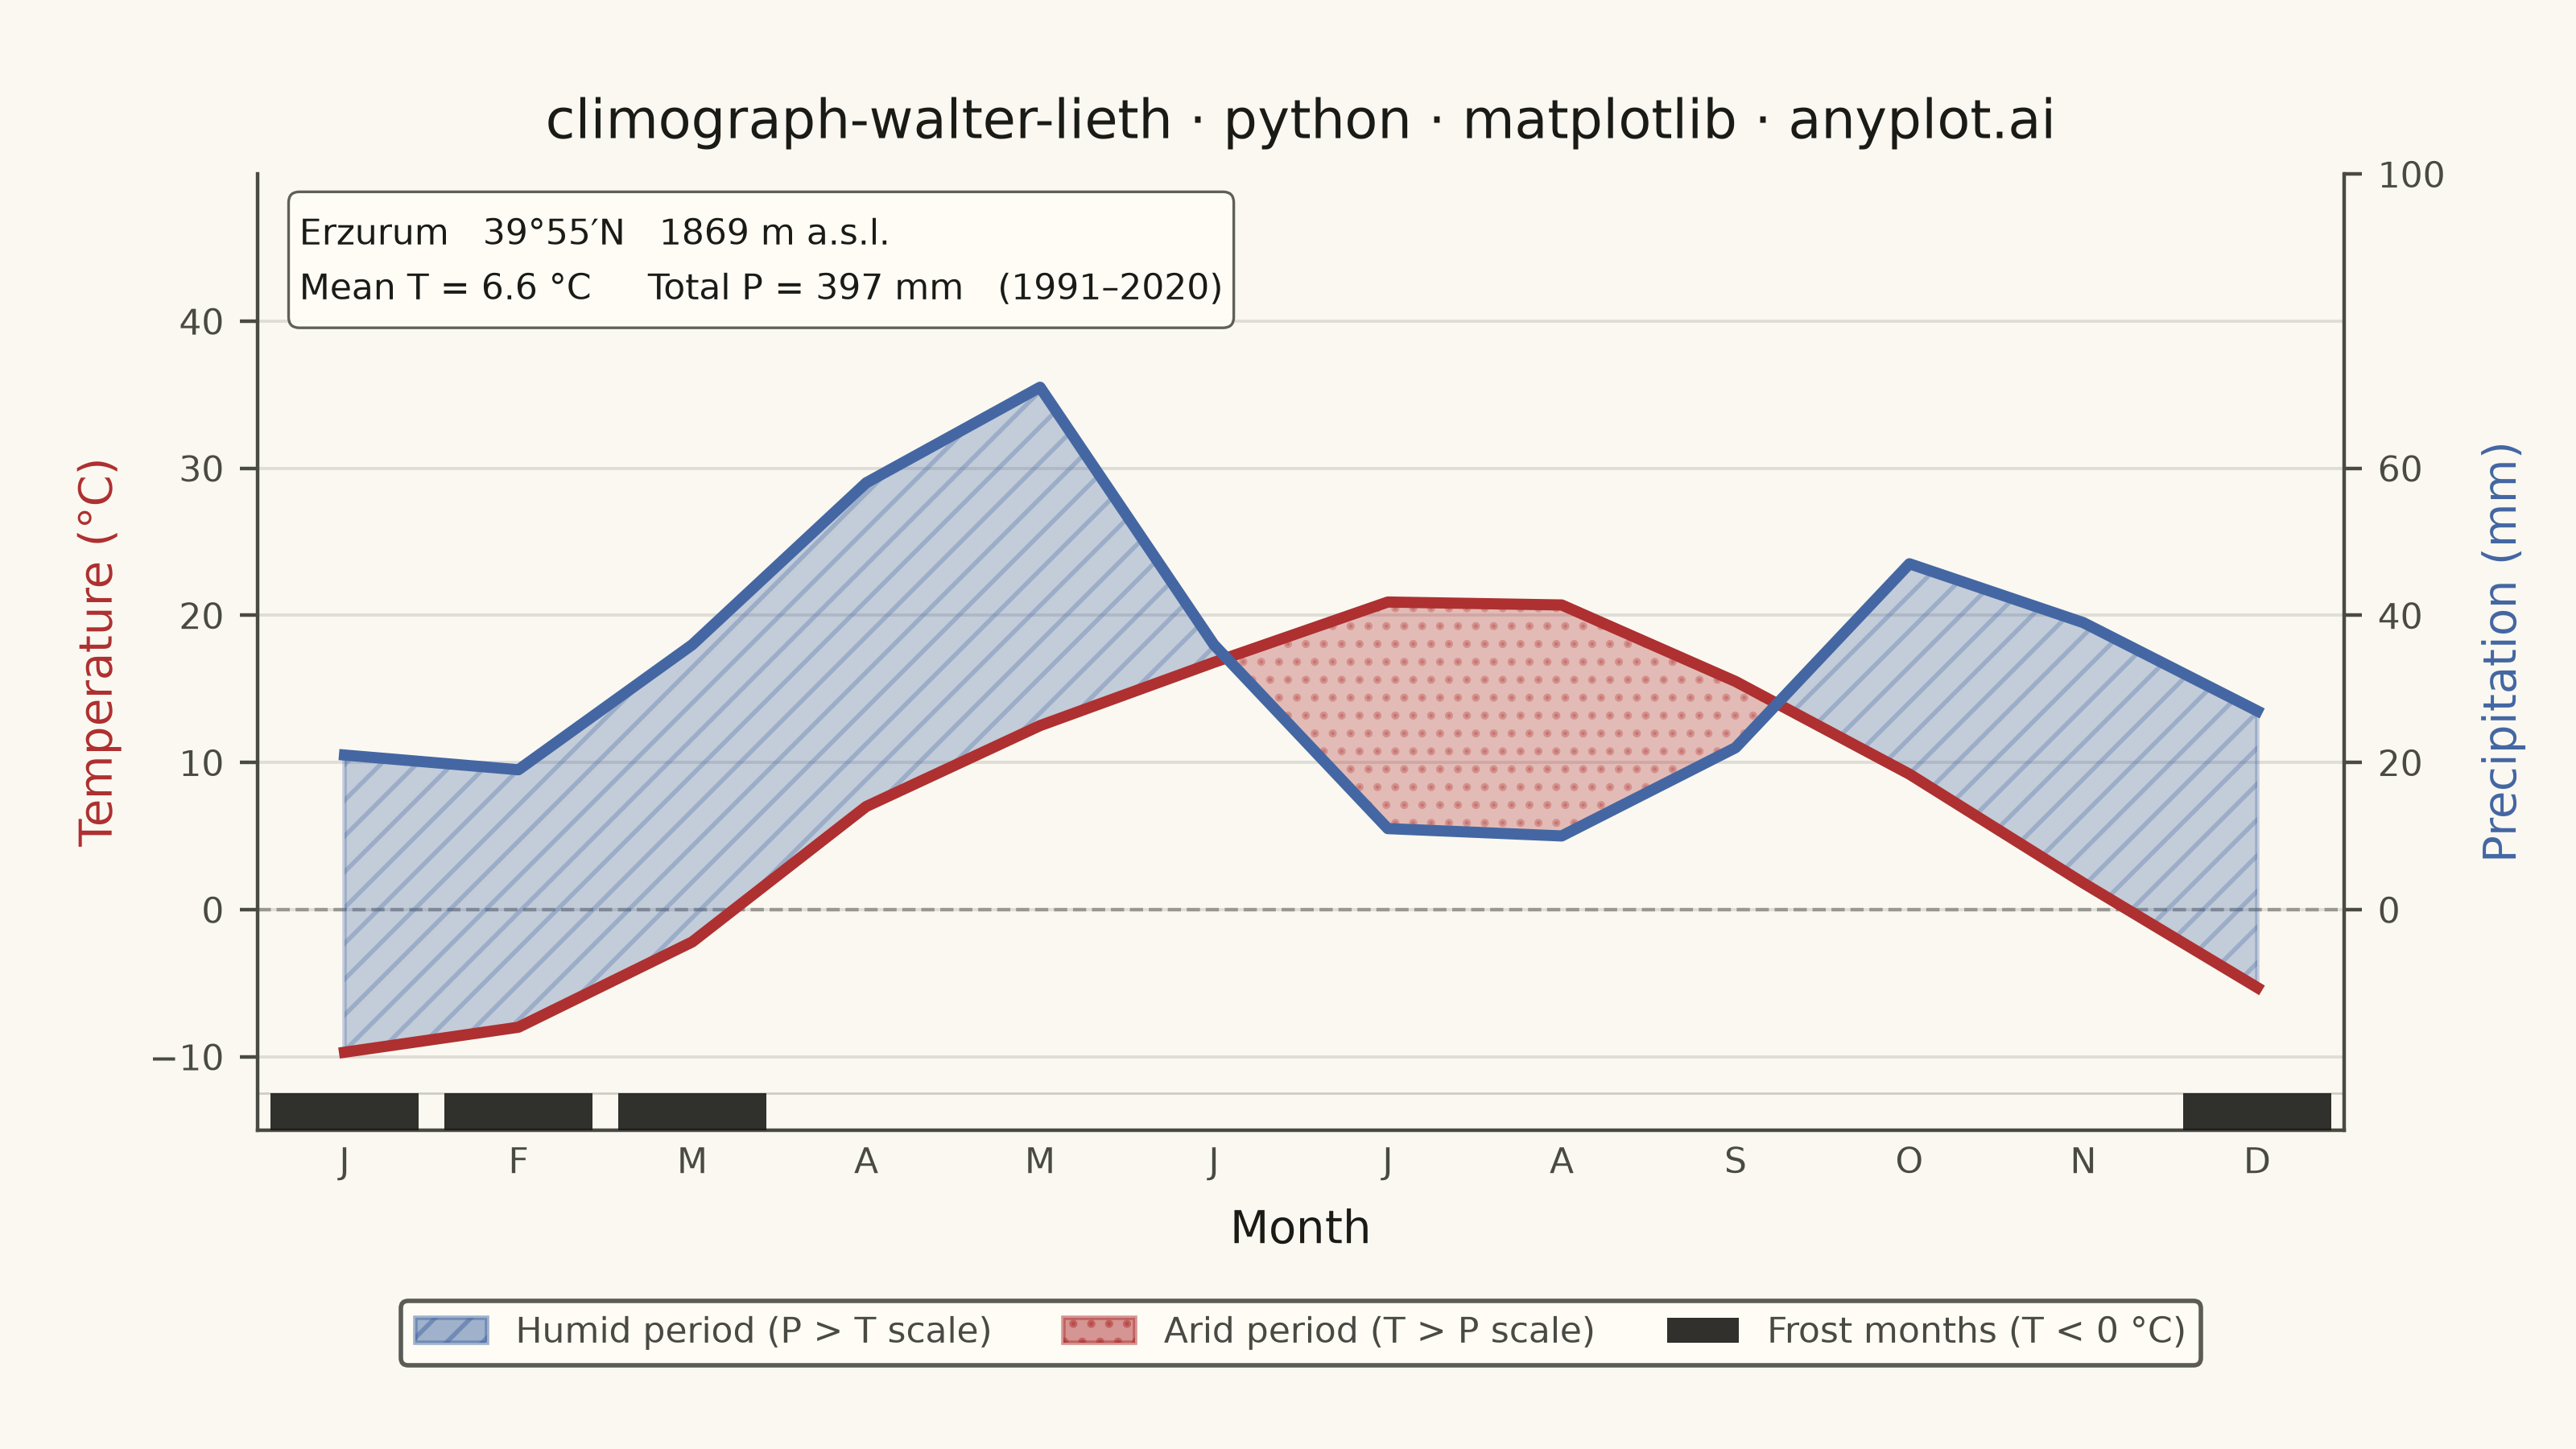
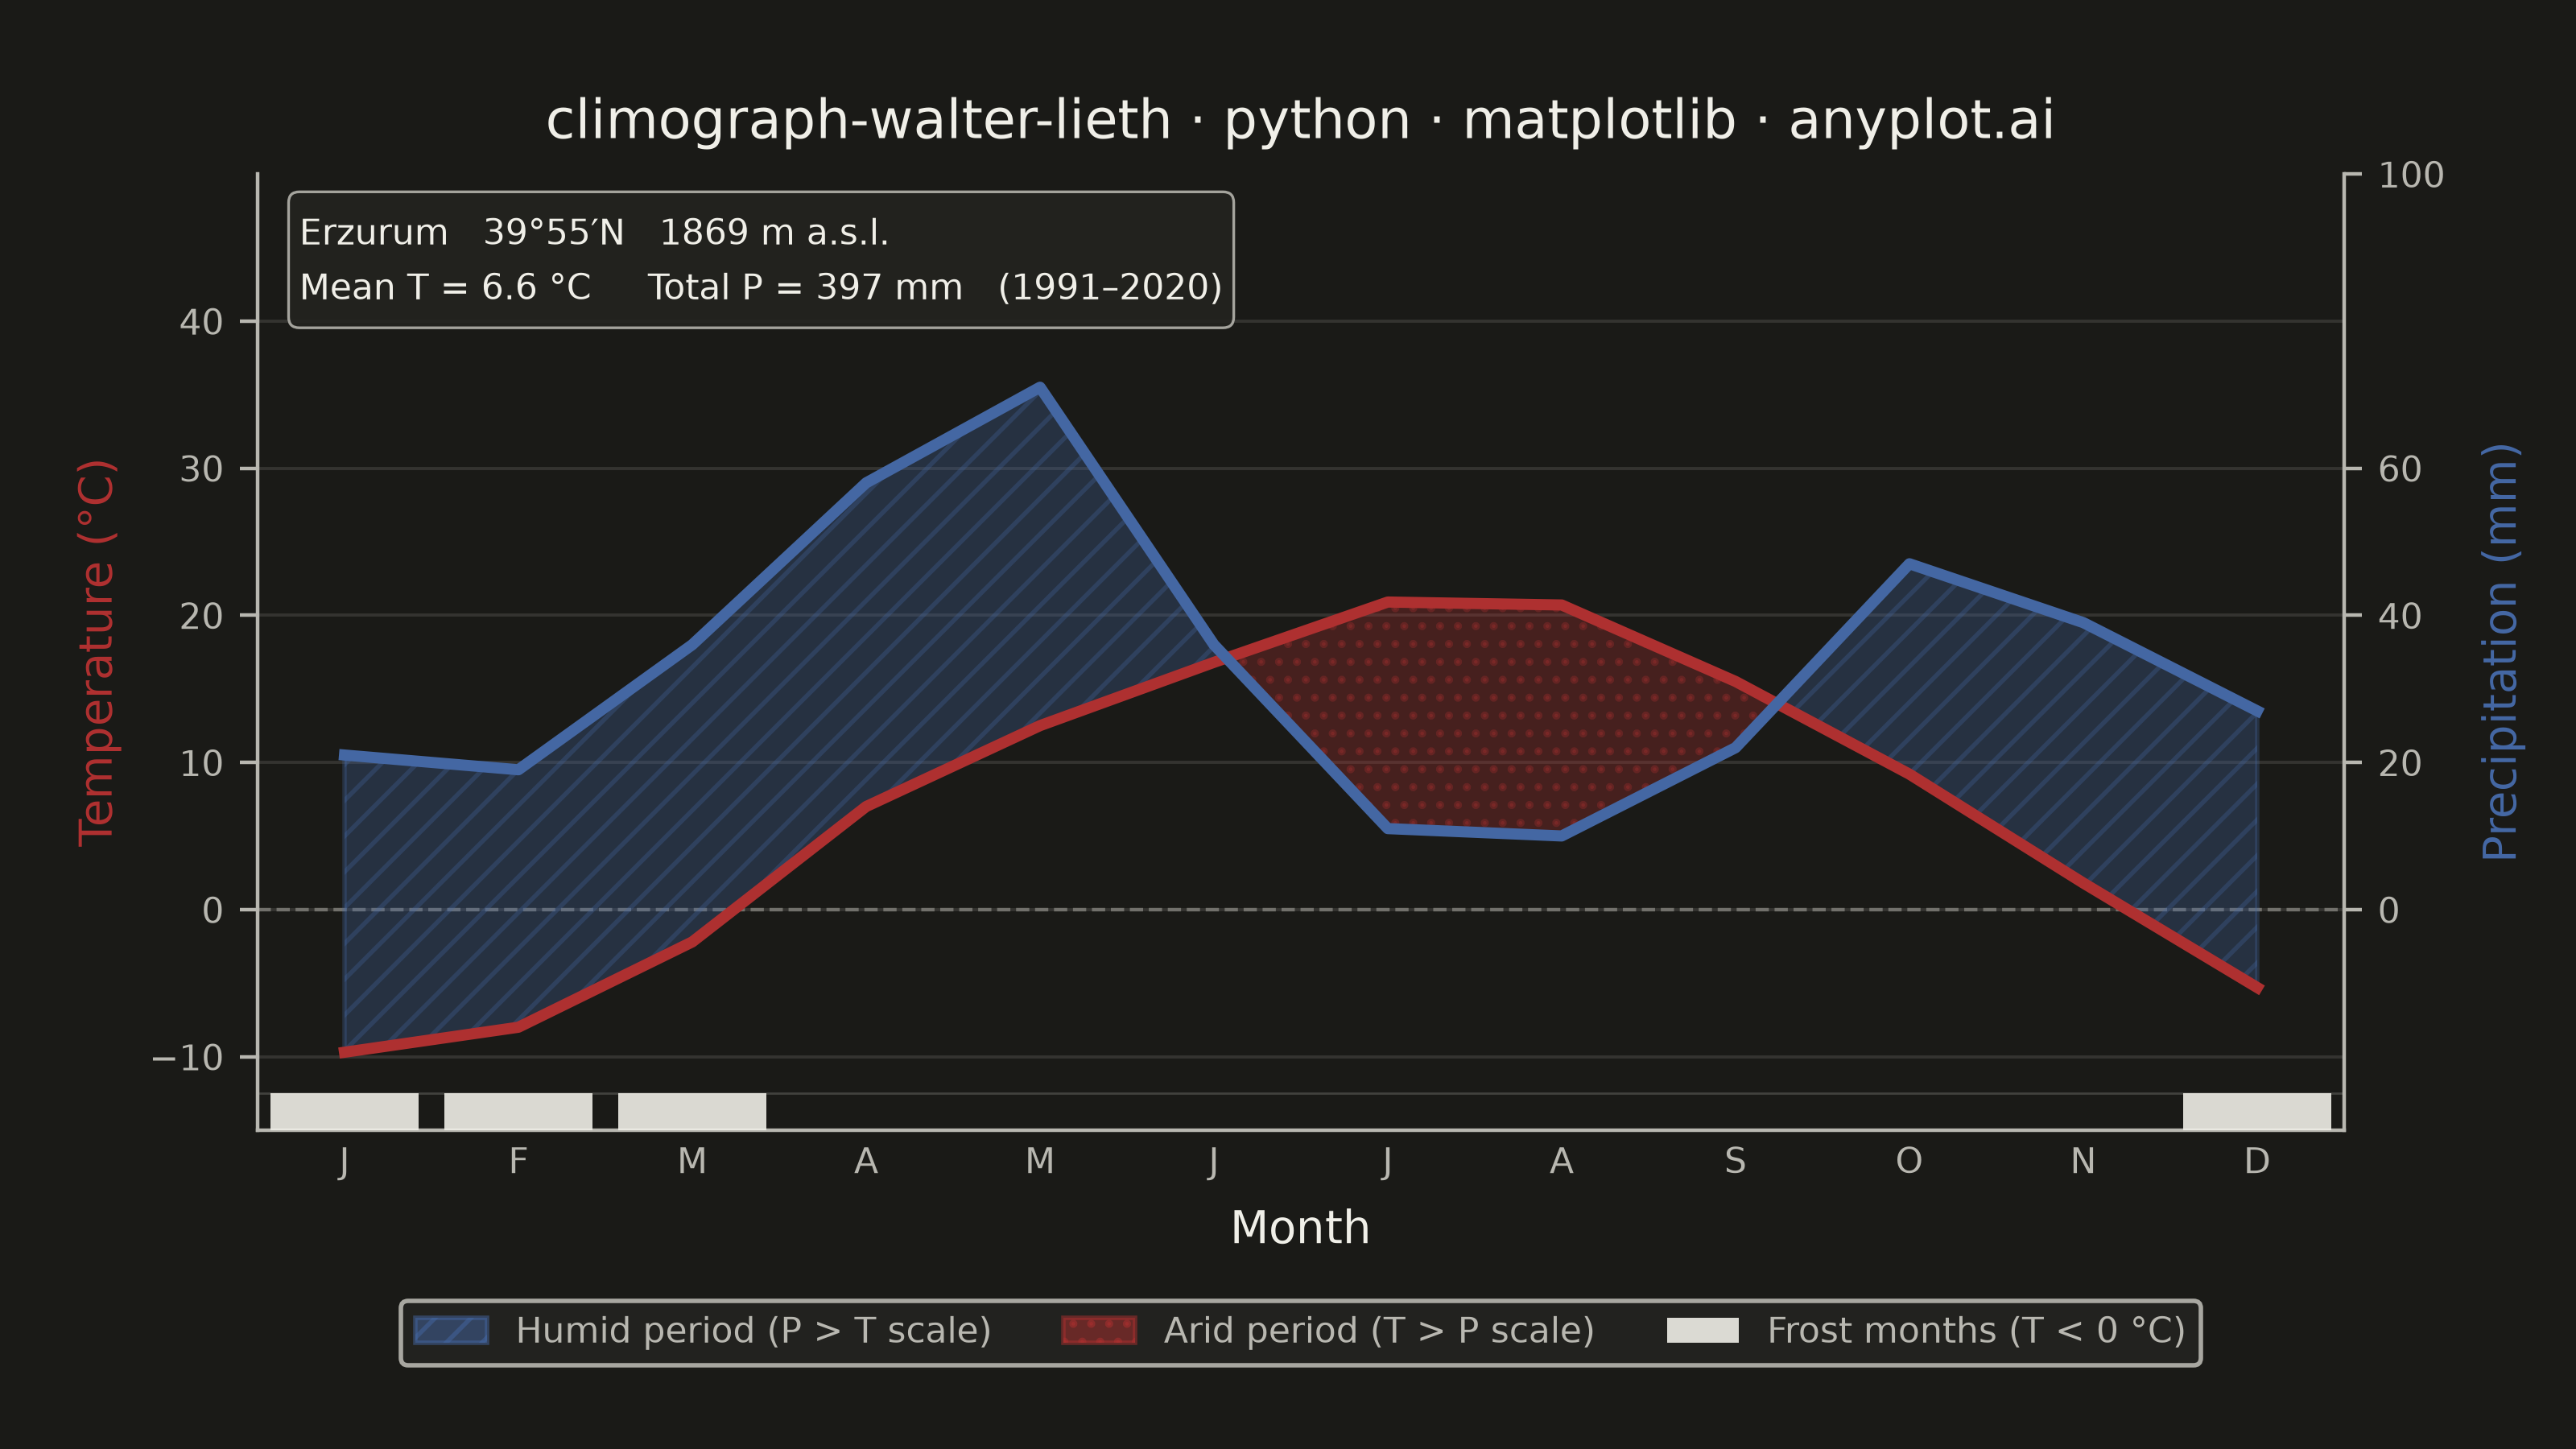
A Walter-Lieth climate diagram (climograph) is the canonical visualization of a location's annual climate, plotting monthly mean temperature and monthly precipitation over the twelve months on a single panel. It uses the classic 1:2 axis-scaling convention where 10 °C on the temperature axis aligns with 20 mm on the precipitation axis, so the relationship between the two curves directly reveals water availability: where precipitation exceeds the temperature curve the period is humid (filled blue/hatched), and where the temperature curve rises above precipitation the period is arid (filled red/dotted). A header carries station metadata and annual means, while frost indicators along the baseline mark cold months.
""" anyplot.ai
climograph-walter-lieth: Walter-Lieth Climate Diagram
Library: matplotlib 3.11.0 | Python 3.13.13
Quality: 89/100 | Created: 2026-06-15
"""

import os
import sys


# This file is named matplotlib.py; remove its directory from sys.path so Python
# finds the installed matplotlib package instead of this file.
_here = os.path.abspath(os.path.dirname(__file__))
sys.path[:] = [p for p in sys.path if (os.path.abspath(p) if p else os.getcwd()) != _here]

import matplotlib.patches as mpatches
import matplotlib.pyplot as plt
import numpy as np


# Theme tokens (Imprint palette + theme-adaptive chrome)
THEME = os.getenv("ANYPLOT_THEME", "light")
PAGE_BG = "#FAF8F1" if THEME == "light" else "#1A1A17"
ELEVATED_BG = "#FFFDF6" if THEME == "light" else "#242420"
INK = "#1A1A17" if THEME == "light" else "#F0EFE8"
INK_SOFT = "#4A4A44" if THEME == "light" else "#B8B7B0"

# Semantic color overrides — climate diagram convention takes precedence over Imprint ordinal
TEMP_COLOR = "#AE3030"  # Imprint matte red — thermal warmth
PRECIP_COLOR = "#4467A3"  # Imprint blue — water / precipitation

# Station data — Erzurum, Turkey (1991–2020 climate normals, WMO 17096)
# 4 frost months (J, F, M, D) showcase all four Walter-Lieth diagnostic zones
station_name = "Erzurum"
station_lat = "39°55′N"
station_elev = 1869  # m a.s.l.
months_labels = ["J", "F", "M", "A", "M", "J", "J", "A", "S", "O", "N", "D"]
temp = np.array([-9.7, -8.0, -2.2, 7.0, 12.5, 16.8, 20.9, 20.7, 15.5, 9.2, 1.8, -5.3])
precip = np.array([21, 19, 36, 58, 71, 36, 11, 10, 22, 47, 39, 27])

temp_annual = float(np.mean(temp))
precip_annual = int(np.sum(precip))

# Walter-Lieth scaling: 10 °C ↔ 20 mm (ratio 1:2)
# Above 100 mm: compressed 10:1 — not reached in this dataset, handled for robustness
precip_te = np.where(precip <= 100, precip / 2.0, 50.0 + (precip - 100) / 10.0)

x = np.arange(12)
y_min = -15
y_max = 50

# Canvas — 3200 × 1800 px
fig, ax = plt.subplots(figsize=(8, 4.5), dpi=400, facecolor=PAGE_BG)
ax2 = ax.twinx()  # right axis for precipitation (created early; transparent by default)
ax.set_facecolor(PAGE_BG)

# Humid fills (P > T) — blue/hatched per Walter-Lieth convention
ax.fill_between(
    x,
    temp,
    precip_te,
    where=(precip_te >= temp),
    facecolor=PRECIP_COLOR,
    alpha=0.30,
    hatch="///",
    edgecolor=PRECIP_COLOR,
    interpolate=True,
    zorder=2,
)

# Arid fills (T > P) — red/dotted per Walter-Lieth convention
ax.fill_between(
    x,
    temp,
    precip_te,
    where=(temp >= precip_te),
    facecolor=TEMP_COLOR,
    alpha=0.30,
    hatch="...",
    edgecolor=TEMP_COLOR,
    interpolate=True,
    zorder=2,
)

# Data lines (drawn above fills)
ax.plot(x, temp, color=TEMP_COLOR, linewidth=2.5, zorder=4)
ax.plot(x, precip_te, color=PRECIP_COLOR, linewidth=2.5, zorder=4)

# 0 °C reference line (freezing point)
ax.axhline(0, color=INK_SOFT, linewidth=0.8, alpha=0.45, linestyle="--", zorder=1)

# Subtle horizontal grid
ax.yaxis.grid(True, alpha=0.12, linewidth=0.7, color=INK, zorder=0)

# Left axis — temperature (°C)
ax.set_xlim(-0.5, 11.5)
ax.set_ylim(y_min, y_max)
ax.set_xticks(x)
ax.set_xticklabels(months_labels, fontsize=8, color=INK_SOFT)
ax.tick_params(axis="x", colors=INK_SOFT, labelcolor=INK_SOFT, length=0)
ax.set_yticks([-10, 0, 10, 20, 30, 40])
ax.tick_params(axis="y", colors=INK_SOFT, labelcolor=INK_SOFT, labelsize=8, length=4)
ax.set_ylabel("Temperature (°C)", fontsize=10, color=TEMP_COLOR, labelpad=6)
ax.set_xlabel("Month", fontsize=10, color=INK, labelpad=6)

ax.spines["top"].set_visible(False)
ax.spines["right"].set_visible(False)
ax.spines["left"].set_color(INK_SOFT)
ax.spines["bottom"].set_color(INK_SOFT)

# Right axis — precipitation (mm) at 2× the temperature scale
ax2.set_ylim(y_min * 2, y_max * 2)  # −30 to 100 mm
ax2.set_yticks([0, 20, 40, 60, 100])  # spec: 0, 20, 40, 60, 100
ax2.tick_params(axis="y", colors=INK_SOFT, labelcolor=INK_SOFT, labelsize=8, length=4)
ax2.set_ylabel("Precipitation (mm)", fontsize=10, color=PRECIP_COLOR, labelpad=8)
ax2.spines["top"].set_visible(False)
ax2.spines["left"].set_visible(False)
ax2.spines["bottom"].set_visible(False)
ax2.spines["right"].set_color(INK_SOFT)

# Frost month indicator blocks at the bottom of the axes (Walter-Lieth baseline convention)
# Solid dark bars from y_min upward for each frost month (mean T < 0 °C)
frost_band_height = 2.5
for i in range(12):
    if temp[i] < 0:
        ax.bar(i, frost_band_height, bottom=y_min, color=INK, width=0.85, zorder=5, linewidth=0, alpha=0.90)
# Thin separator above the frost band
ax.axhline(y_min + frost_band_height, color=INK_SOFT, linewidth=0.5, alpha=0.25, zorder=4)

# Station metadata header (upper-left text box)
header = (
    f"{station_name}   {station_lat}   {station_elev} m a.s.l.\n"
    f"Mean T = {temp_annual:.1f} °C     Total P = {precip_annual} mm   (1991–2020)"
)
ax.text(
    0.02,
    0.97,
    header,
    transform=ax.transAxes,
    fontsize=8,
    color=INK,
    verticalalignment="top",
    linespacing=1.6,
    bbox={
        "facecolor": ELEVATED_BG,
        "edgecolor": INK_SOFT,
        "alpha": 0.88,
        "boxstyle": "round,pad=0.3",
        "linewidth": 0.6,
    },
)

# Legend (below chart area)
humid_patch = mpatches.Patch(
    facecolor=PRECIP_COLOR, hatch="///", edgecolor=PRECIP_COLOR, alpha=0.5, label="Humid period (P > T scale)"
)
arid_patch = mpatches.Patch(
    facecolor=TEMP_COLOR, hatch="...", edgecolor=TEMP_COLOR, alpha=0.5, label="Arid period (T > P scale)"
)
frost_patch = mpatches.Patch(facecolor=INK, alpha=0.90, label="Frost months (T < 0 °C)")

leg = ax.legend(
    handles=[humid_patch, arid_patch, frost_patch],
    fontsize=8,
    loc="upper center",
    ncol=3,
    framealpha=0.9,
    bbox_to_anchor=(0.5, -0.16),
    edgecolor=INK_SOFT,
)
if leg:
    leg.get_frame().set_facecolor(ELEVATED_BG)
    leg.get_frame().set_edgecolor(INK_SOFT)
    plt.setp(leg.get_texts(), color=INK_SOFT)

# Title
title = "climograph-walter-lieth · python · matplotlib · anyplot.ai"
n = len(title)
title_fontsize = max(8, round(12 * 67 / n)) if n > 67 else 12
ax.set_title(title, fontsize=title_fontsize, fontweight="medium", color=INK, pad=8)

# Margins: room for title (top), legend below axes (bottom), both y-axis labels (sides)
fig.subplots_adjust(top=0.88, bottom=0.22, left=0.10, right=0.91)

# Save
plt.savefig(f"plot-{THEME}.png", dpi=400, facecolor=PAGE_BG)
plt.close()
Runnable source as JSON, for any HTTP client: https://api.anyplot.ai/specs/climograph-walter-lieth/matplotlib/code. Any spec id and library id listed in llms-full.txt fit the same URL shape; every URL below is complete and callable.
{
  "spec_id": "climograph-walter-lieth",
  "language": "python",
  "library": "matplotlib",
  "page": "https://anyplot.ai/climograph-walter-lieth/python/matplotlib",
  "hub": "https://anyplot.ai/climograph-walter-lieth",
  "code_json": "https://api.anyplot.ai/specs/climograph-walter-lieth/matplotlib/code",
  "spec_json": "https://api.anyplot.ai/specs/climograph-walter-lieth",
  "render_light_png": "https://storage.googleapis.com/anyplot-images/plots/climograph-walter-lieth/python/matplotlib/plot-light.png",
  "render_dark_png": "https://storage.googleapis.com/anyplot-images/plots/climograph-walter-lieth/python/matplotlib/plot-dark.png",
  "quality_score": 89.0,
  "license": "MIT",
  "guide": "https://anyplot.ai/llms.txt"
}
Part of Walter-Lieth Climate Diagram on anyplot.ai.