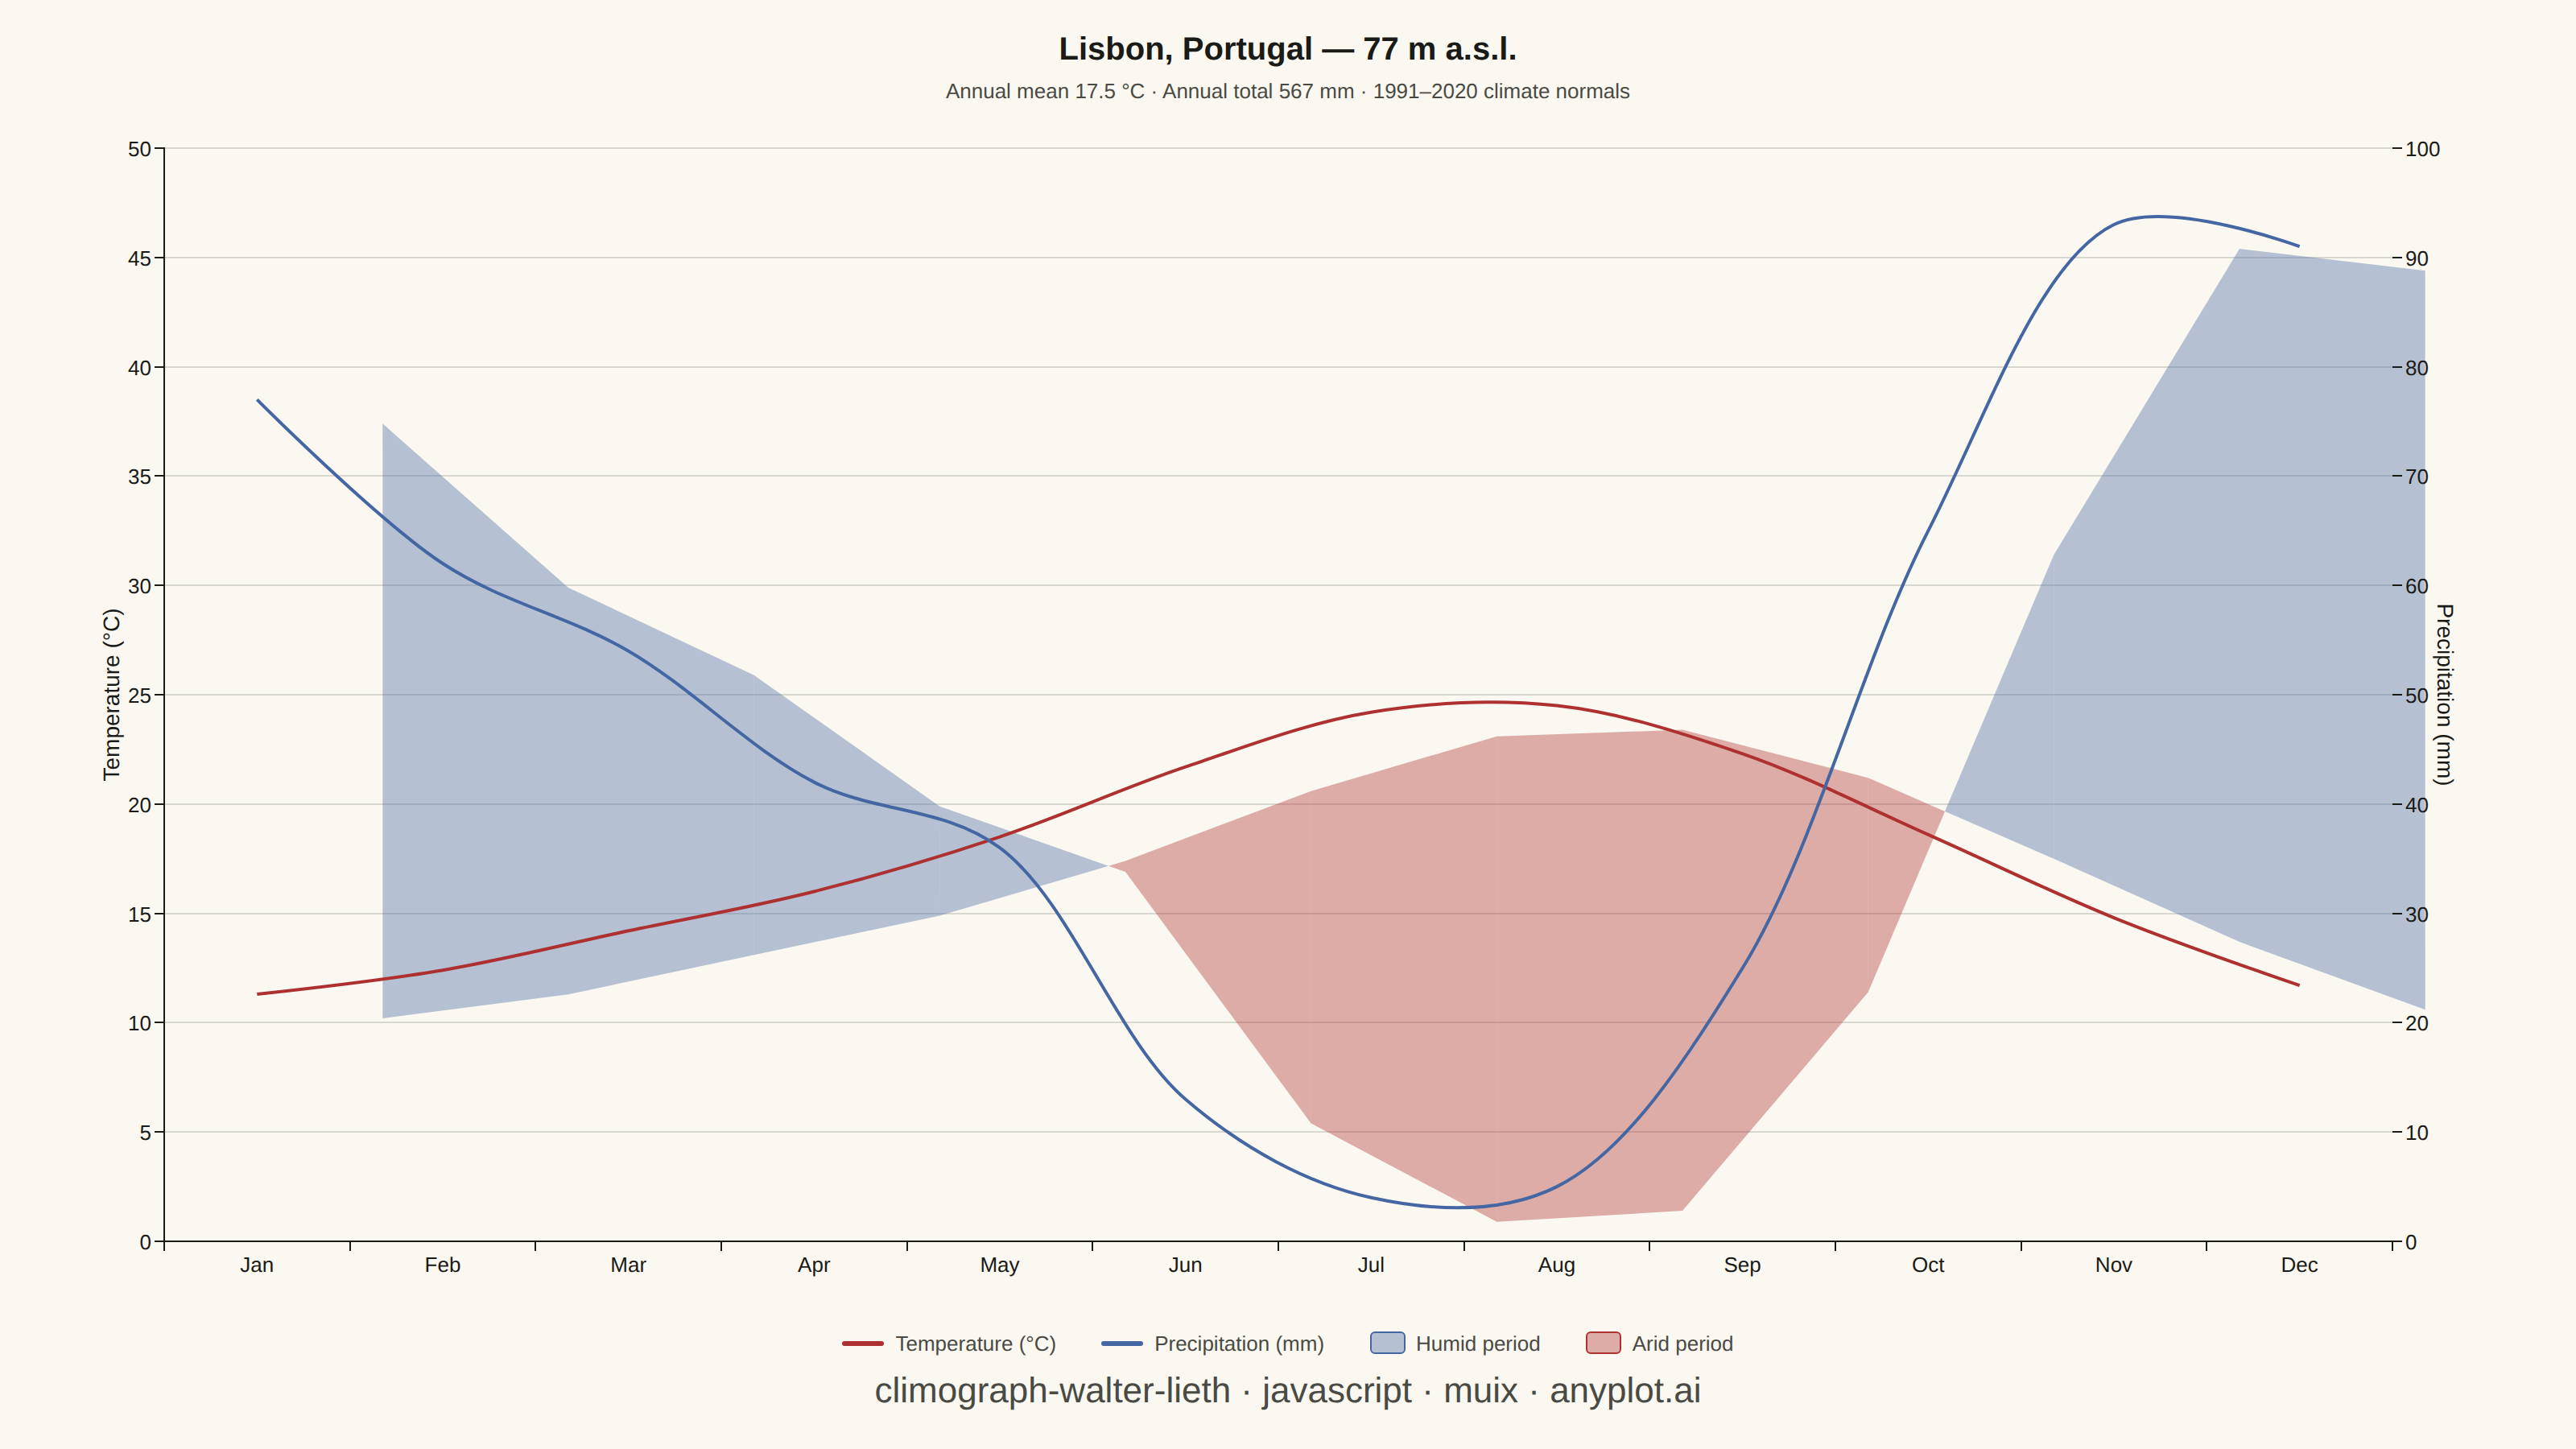
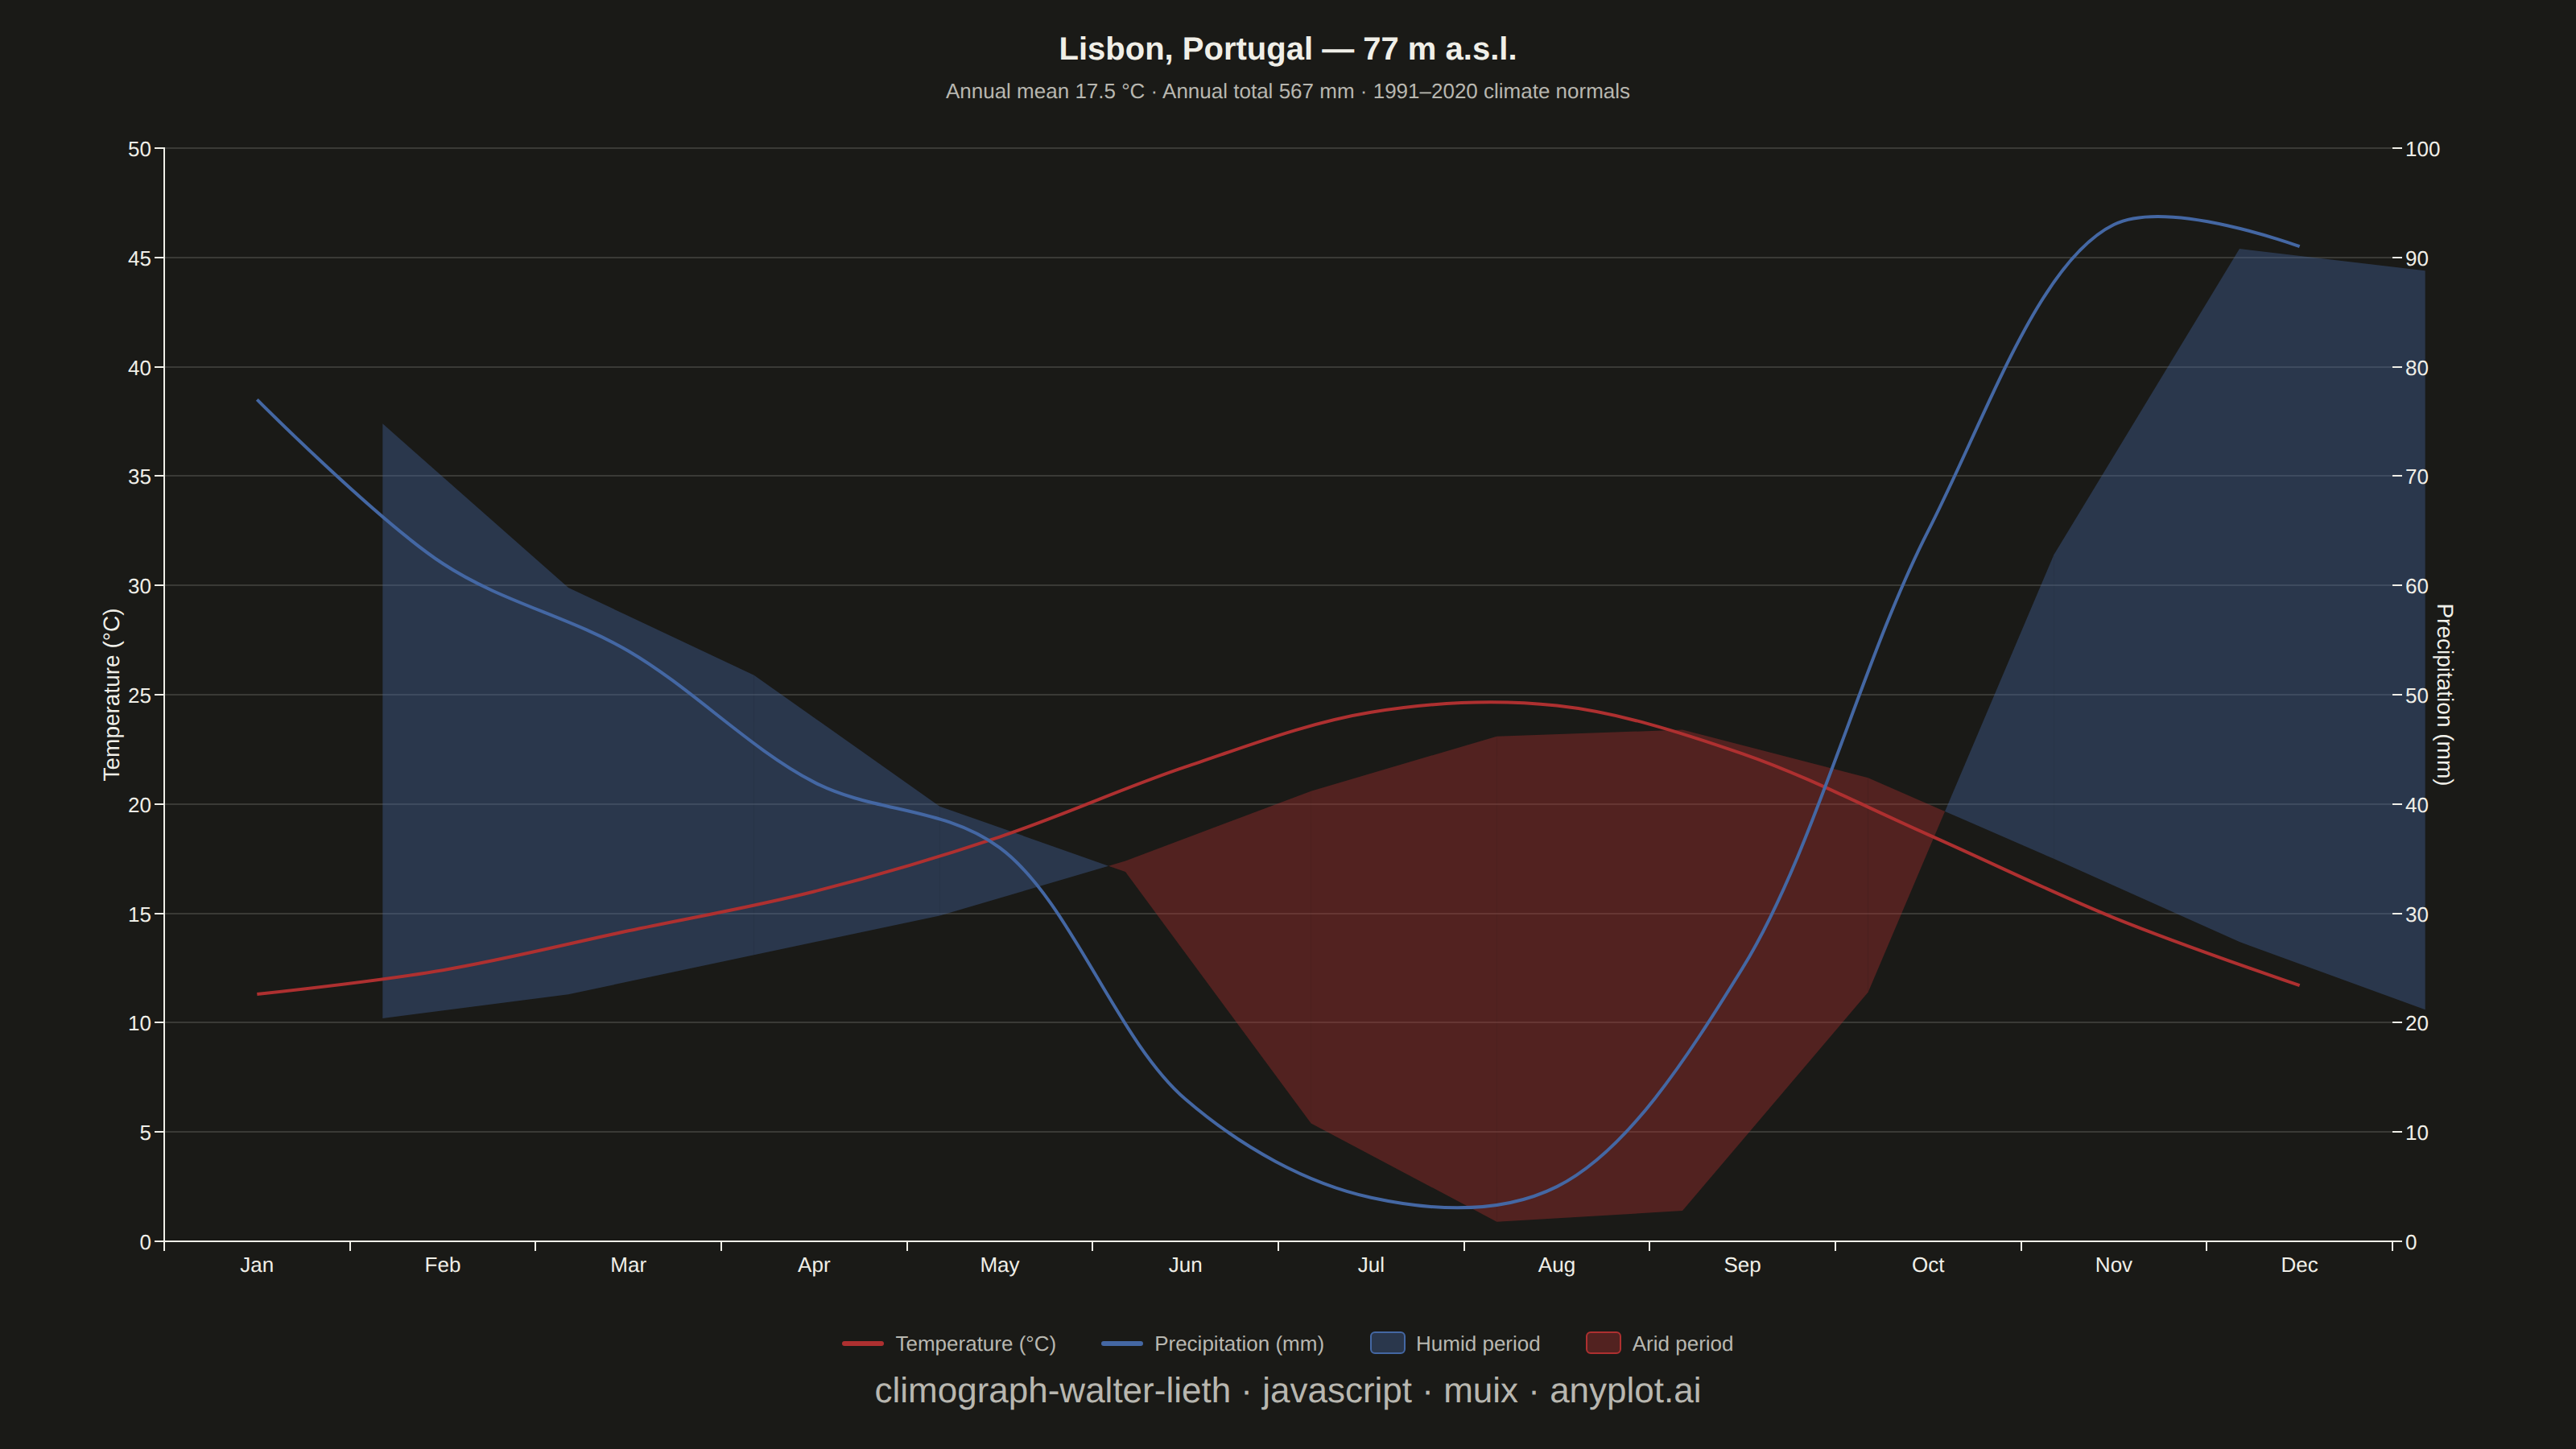
A Walter-Lieth climate diagram (climograph) is the canonical visualization of a location's annual climate, plotting monthly mean temperature and monthly precipitation over the twelve months on a single panel. It uses the classic 1:2 axis-scaling convention where 10 °C on the temperature axis aligns with 20 mm on the precipitation axis, so the relationship between the two curves directly reveals water availability: where precipitation exceeds the temperature curve the period is humid (filled blue/hatched), and where the temperature curve rises above precipitation the period is arid (filled red/dotted). A header carries station metadata and annual means, while frost indicators along the baseline mark cold months.
// anyplot.ai
// climograph-walter-lieth: Walter-Lieth Climate Diagram
// Library: muix 7.29.1 | JavaScript 22.22.3
// Quality: 89/100 | Created: 2026-06-15

import { ChartContainer } from "@mui/x-charts/ChartContainer";
import { LinePlot } from "@mui/x-charts/LineChart";
import { ChartsXAxis } from "@mui/x-charts/ChartsXAxis";
import { ChartsYAxis } from "@mui/x-charts/ChartsYAxis";
import { ChartsGrid } from "@mui/x-charts/ChartsGrid";
import { useDrawingArea, useXScale, useYScale } from "@mui/x-charts/hooks";
import Box from "@mui/material/Box";
import Typography from "@mui/material/Typography";

const t = window.ANYPLOT_TOKENS;

// Station: Lisbon, Portugal — Mediterranean climate (1991–2020 normals)
const ELEVATION = 77;
const months = ["Jan", "Feb", "Mar", "Apr", "May", "Jun", "Jul", "Aug", "Sep", "Oct", "Nov", "Dec"];
const temperature = [11.3, 12.4, 14.2, 16.0, 18.5, 21.7, 24.2, 24.5, 22.3, 18.6, 14.8, 11.7];
const precipitation = [77, 62, 54, 42, 36, 13, 4, 5, 25, 65, 93, 91];

// Walter-Lieth 2:1 scaling: precipitation/2 plotted on temperature axis
// This makes 10°C align with 20 mm so the curves are directly comparable
const precipScaled = precipitation.map((p) => p / 2);

const annualMeanTemp = (temperature.reduce((a, b) => a + b, 0) / 12).toFixed(1);
const annualTotalPrecip = precipitation.reduce((a, b) => a + b, 0);

const TEMP_AXIS_ID = "tempY";
// Imprint palette: blue (#4467A3) for humid, matte red (#AE3030) for arid
// These follow semantic conventions: water=blue, heat/drought=red
const HUMID_FILL = "#4467A3";
const ARID_FILL = "#AE3030";
// Dark blue for frost month indicator bands (mean temp < 0°C)
const FROST_COLOR = "#2B4B8C";

// Draws blue/red fills between the temperature and precipitation curves,
// plus frost month indicator bands below the x-axis for months with mean temp < 0°C
function WalterLiethFill() {
  const { left, top, height } = useDrawingArea();
  const xScale = useXScale();
  const yScale = useYScale(TEMP_AXIS_ID);

  if (!xScale || !yScale || !xScale.bandwidth) return null;

  const bw = xScale.bandwidth();
  const getX = (i) => (xScale(months[i]) ?? 0) + bw / 2;
  const getTY = (i) => yScale(temperature[i]) ?? 0;
  const getPY = (i) => yScale(precipScaled[i]) ?? 0;

  const elems = [];

  // Humid/arid fills between temperature and precipitation curves
  for (let i = 0; i < months.length - 1; i++) {
    const x0 = getX(i);
    const x1 = getX(i + 1);
    const ty0 = getTY(i);
    const ty1 = getTY(i + 1);
    const py0 = getPY(i);
    const py1 = getPY(i + 1);
    const h0 = precipScaled[i] > temperature[i];
    const h1 = precipScaled[i + 1] > temperature[i + 1];

    if (h0 === h1) {
      elems.push(
        <polygon
          key={`f${i}`}
          points={`${x0},${py0} ${x1},${py1} ${x1},${ty1} ${x0},${ty0}`}
          fill={h0 ? HUMID_FILL : ARID_FILL}
          fillOpacity={0.38}
        />
      );
    } else {
      // Curves cross — compute intersection by linear interpolation in SVG space
      const d = (py1 - py0) - (ty1 - ty0);
      const frac = Math.abs(d) > 0.01 ? (ty0 - py0) / d : 0.5;
      const xc = x0 + (x1 - x0) * frac;
      const yc = ty0 + (ty1 - ty0) * frac;
      elems.push(
        <polygon
          key={`f${i}a`}
          points={`${x0},${py0} ${xc},${yc} ${x0},${ty0}`}
          fill={h0 ? HUMID_FILL : ARID_FILL}
          fillOpacity={0.38}
        />,
        <polygon
          key={`f${i}b`}
          points={`${xc},${yc} ${x1},${py1} ${x1},${ty1}`}
          fill={h1 ? HUMID_FILL : ARID_FILL}
          fillOpacity={0.38}
        />
      );
    }
  }

  // Frost month indicator: solid band just below x-axis for months with mean temp < 0°C
  const frostBandH = 6;
  const frostGap = 2;
  for (let i = 0; i < months.length; i++) {
    if (temperature[i] < 0) {
      const xi = getX(i);
      elems.push(
        <rect
          key={`frost${i}`}
          x={xi - bw / 2}
          y={height + frostGap}
          width={bw}
          height={frostBandH}
          fill={FROST_COLOR}
          fillOpacity={0.85}
        />
      );
    }
  }

  return <g transform={`translate(${left},${top})`}>{elems}</g>;
}

const CHART_SERIES = [
  {
    id: "temp",
    label: "Temperature (°C)",
    data: temperature,
    type: "line",
    color: "#AE3030",
    yAxisId: TEMP_AXIS_ID,
    showMark: false,
    curve: "catmullRom",
  },
  {
    id: "precip",
    label: "Precipitation (mm)",
    data: precipScaled,
    type: "line",
    color: "#4467A3",
    yAxisId: TEMP_AXIS_ID,
    showMark: false,
    curve: "catmullRom",
  },
];

export default function Chart() {
  const W = window.ANYPLOT_SIZE.width;
  const H = window.ANYPLOT_SIZE.height;

  const title = "climograph-walter-lieth · javascript · muix · anyplot.ai";
  const titleFontSize = Math.max(11, Math.round(22 * Math.min(1, 67 / title.length)));

  const chartH = H - 158;
  const chartW = W - 48;

  const hasFrostMonths = temperature.some((t) => t < 0);
  const legendItems = [
    { color: "#AE3030", isLine: true, label: "Temperature (°C)" },
    { color: "#4467A3", isLine: true, label: "Precipitation (mm)" },
    { color: "rgba(68,103,163,0.38)", border: "#4467A3", label: "Humid period" },
    { color: "rgba(174,48,48,0.38)", border: "#AE3030", label: "Arid period" },
    ...(hasFrostMonths
      ? [{ color: "rgba(43,75,140,0.85)", border: FROST_COLOR, label: "Frost month" }]
      : []),
  ];

  return (
    <Box
      sx={{
        width: W,
        height: H,
        bgcolor: t.pageBg,
        display: "flex",
        flexDirection: "column",
        px: "24px",
        pt: "18px",
        pb: "14px",
        boxSizing: "border-box",
      }}
    >
      {/* Station header */}
      <Box sx={{ textAlign: "center", mb: "10px" }}>
        <Typography
          sx={{ color: t.ink, fontWeight: 700, fontSize: 20, lineHeight: 1.3 }}
        >
          Lisbon, Portugal — {ELEVATION} m a.s.l.
        </Typography>
        <Typography sx={{ color: t.inkSoft, fontSize: 13, mt: "3px" }}>
          Annual mean {annualMeanTemp} °C · Annual total {annualTotalPrecip} mm · 1991–2020 climate normals
        </Typography>
      </Box>

      {/* Chart */}
      <ChartContainer
        width={chartW}
        height={chartH}
        series={CHART_SERIES}
        xAxis={[
          {
            id: "x",
            scaleType: "band",
            data: months,
            tickLabelStyle: { fontSize: 13 },
          },
        ]}
        yAxis={[
          {
            id: TEMP_AXIS_ID,
            min: 0,
            max: 50,
            tickInterval: 10,
            tickLabelStyle: { fontSize: 13 },
          },
          {
            id: "precipR",
            position: "right",
            min: 0,
            max: 50,
            tickInterval: 10,
            valueFormatter: (v) => `${v * 2}`,
            tickLabelStyle: { fontSize: 13 },
          },
        ]}
        margin={{ top: 15, right: 90, bottom: 48, left: 78 }}
        skipAnimation
        sx={{
          // Suppress right spine — keep left + bottom L-shape only
          "& .MuiChartsAxis-right .MuiChartsAxis-line": { display: "none" },
        }}
      >
        <ChartsGrid horizontal />
        <WalterLiethFill />
        <LinePlot />
        <ChartsXAxis axisId="x" position="bottom" />
        <ChartsYAxis
          axisId={TEMP_AXIS_ID}
          position="left"
          label="Temperature (°C)"
          labelStyle={{ fontSize: 14 }}
        />
        <ChartsYAxis
          axisId="precipR"
          position="right"
          label="Precipitation (mm)"
          labelStyle={{ fontSize: 14 }}
          disableLine
        />
      </ChartContainer>

      {/* Legend */}
      <Box
        sx={{
          display: "flex",
          justifyContent: "center",
          alignItems: "center",
          gap: "28px",
          mt: "6px",
          mb: "6px",
          flexWrap: "wrap",
        }}
      >
        {legendItems.map((item) => (
          <Box
            key={item.label}
            sx={{ display: "flex", alignItems: "center", gap: "7px" }}
          >
            {item.isLine ? (
              <Box
                sx={{
                  width: 26,
                  height: 3,
                  bgcolor: item.color,
                  borderRadius: "2px",
                  flexShrink: 0,
                }}
              />
            ) : (
              <Box
                sx={{
                  width: 22,
                  height: 14,
                  bgcolor: item.color,
                  border: `1.5px solid ${item.border}`,
                  borderRadius: "3px",
                  flexShrink: 0,
                }}
              />
            )}
            <Typography sx={{ fontSize: 13, color: t.inkSoft }}>
              {item.label}
            </Typography>
          </Box>
        ))}
      </Box>

      {/* Plot title */}
      <Typography
        sx={{ color: t.inkSoft, textAlign: "center", fontSize: titleFontSize, lineHeight: 1.3 }}
      >
        {title}
      </Typography>
    </Box>
  );
}
Runnable source as JSON, for any HTTP client: https://api.anyplot.ai/specs/climograph-walter-lieth/muix/code. Any spec id and library id listed in llms-full.txt fit the same URL shape; every URL below is complete and callable.
{
  "spec_id": "climograph-walter-lieth",
  "language": "javascript",
  "library": "muix",
  "page": "https://anyplot.ai/climograph-walter-lieth/javascript/muix",
  "hub": "https://anyplot.ai/climograph-walter-lieth",
  "code_json": "https://api.anyplot.ai/specs/climograph-walter-lieth/muix/code",
  "spec_json": "https://api.anyplot.ai/specs/climograph-walter-lieth",
  "render_light_png": "https://storage.googleapis.com/anyplot-images/plots/climograph-walter-lieth/javascript/muix/plot-light.png",
  "render_dark_png": "https://storage.googleapis.com/anyplot-images/plots/climograph-walter-lieth/javascript/muix/plot-dark.png",
  "interactive_light_html": "https://storage.googleapis.com/anyplot-images/plots/climograph-walter-lieth/javascript/muix/plot-light.html",
  "interactive_dark_html": "https://storage.googleapis.com/anyplot-images/plots/climograph-walter-lieth/javascript/muix/plot-dark.html",
  "quality_score": 89.0,
  "license": "MIT",
  "guide": "https://anyplot.ai/llms.txt"
}
Part of Walter-Lieth Climate Diagram on anyplot.ai.