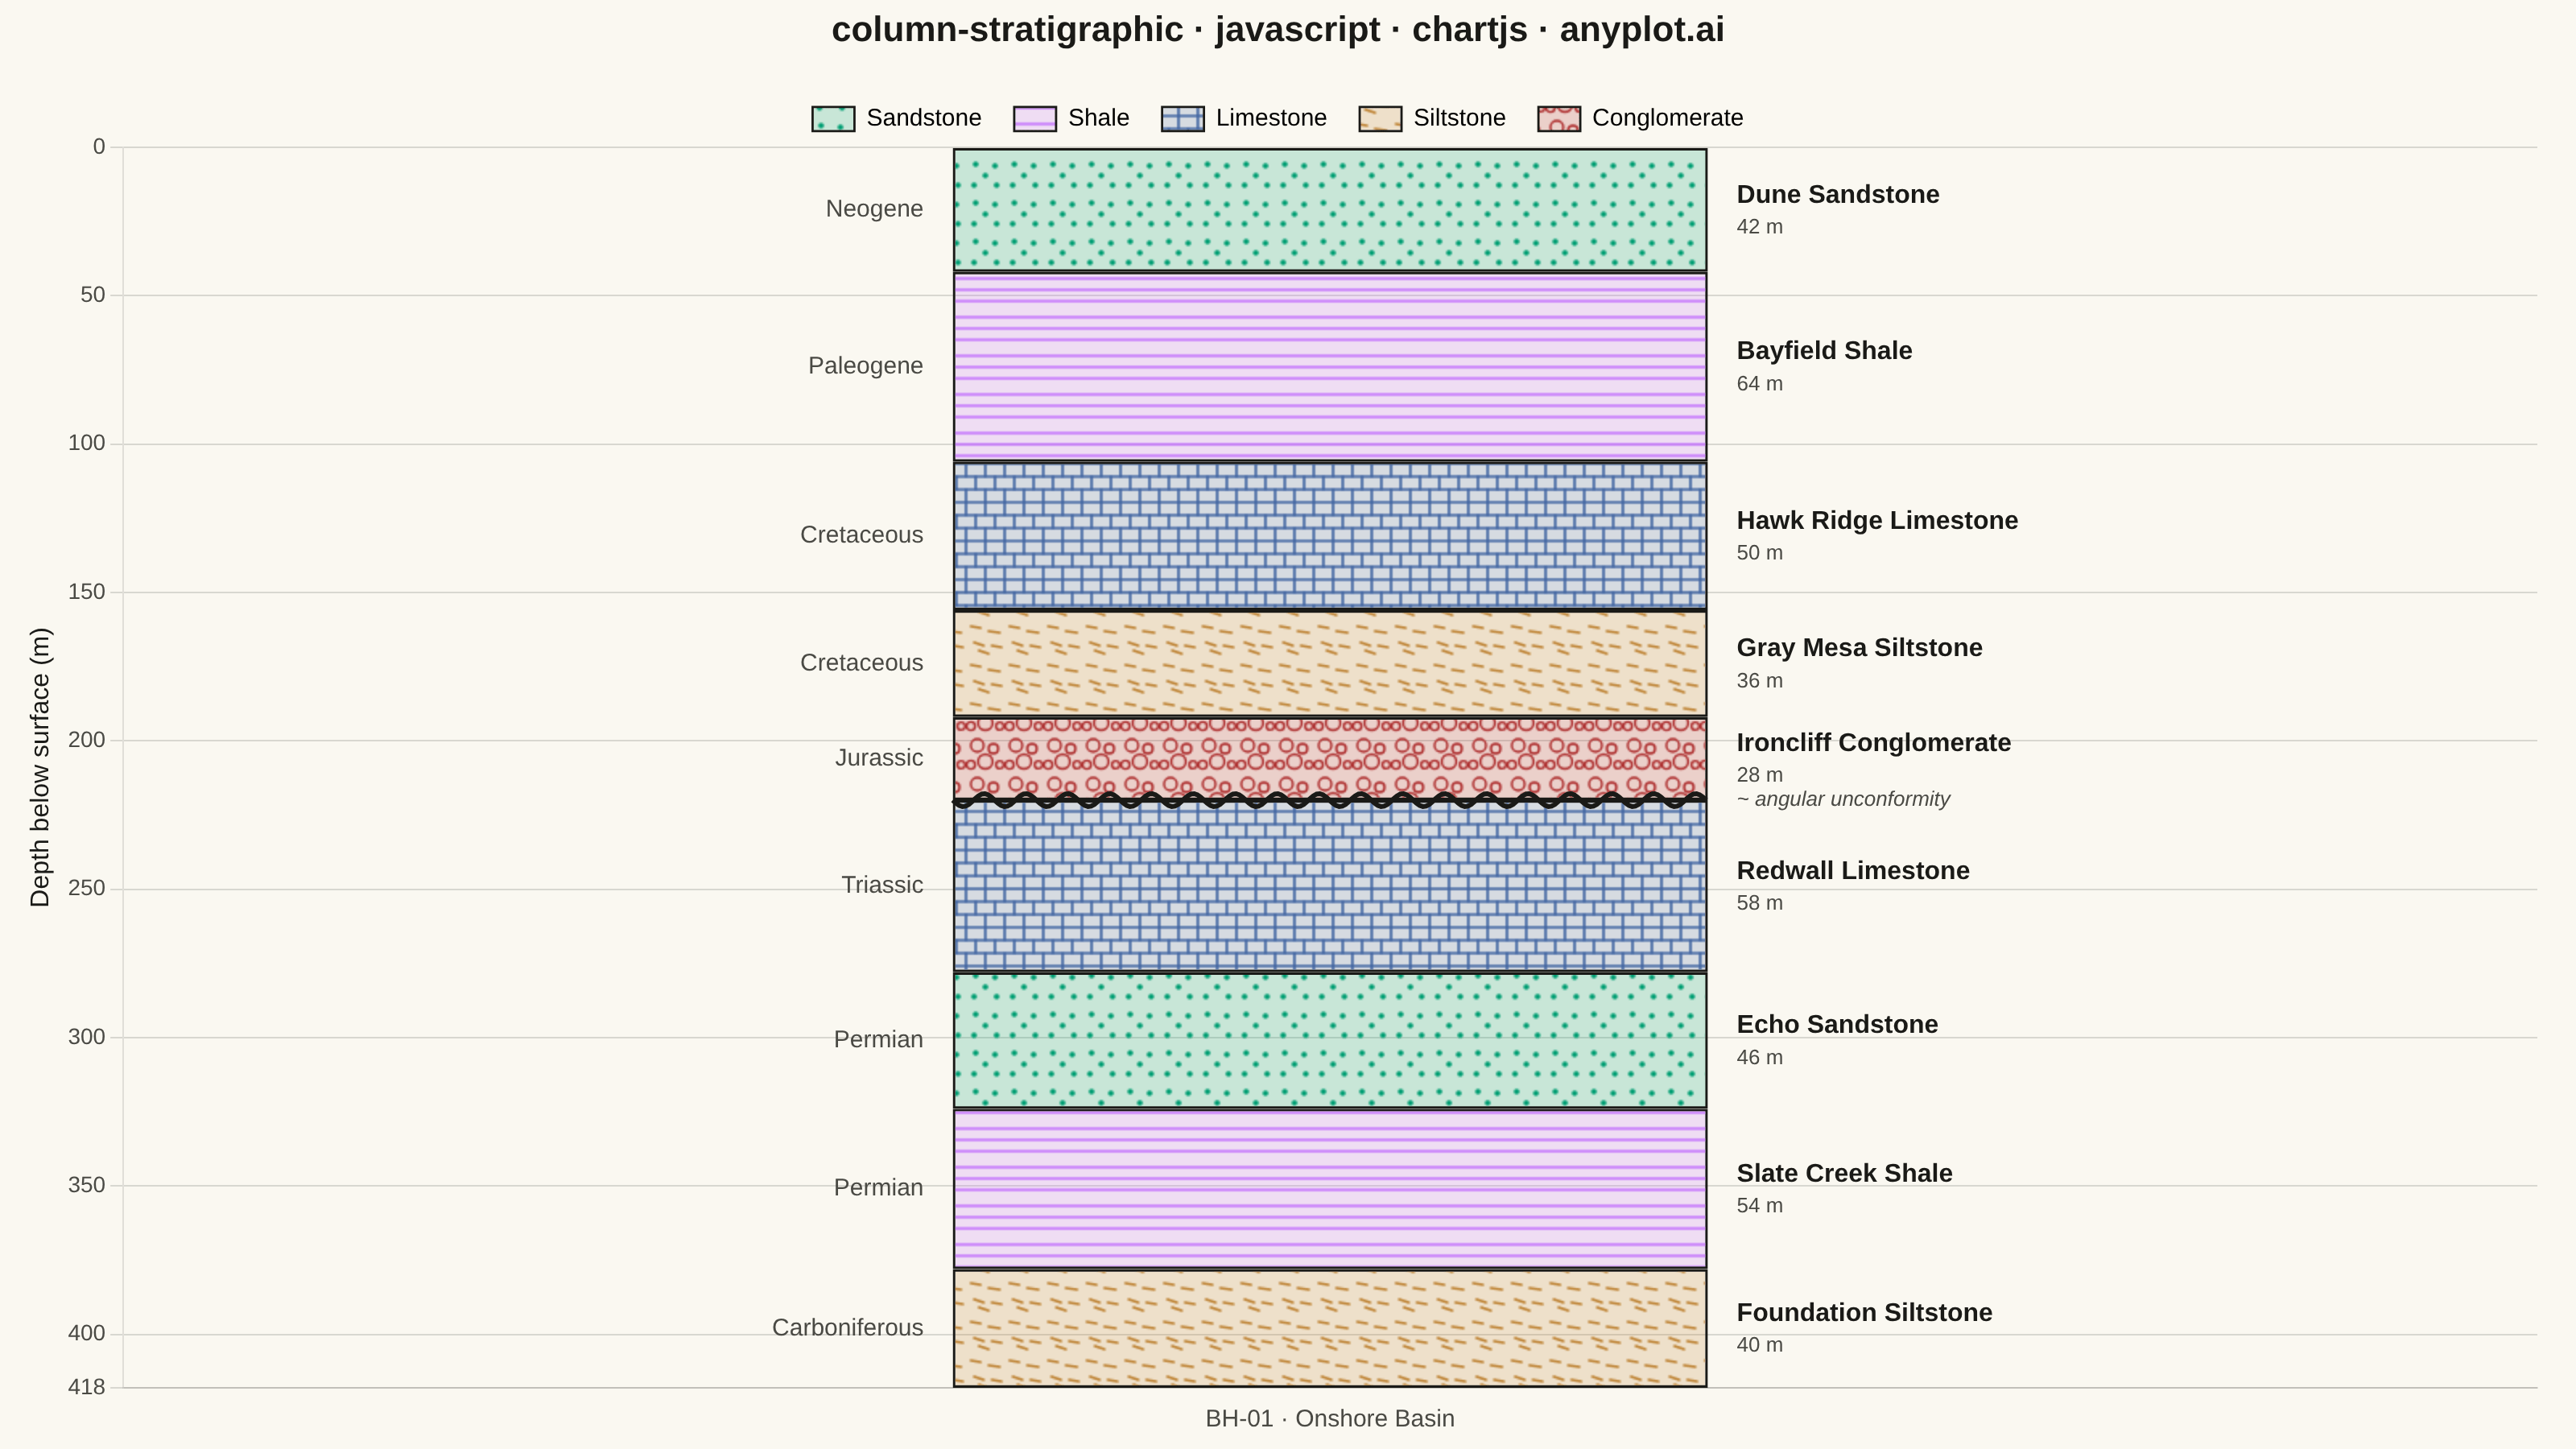
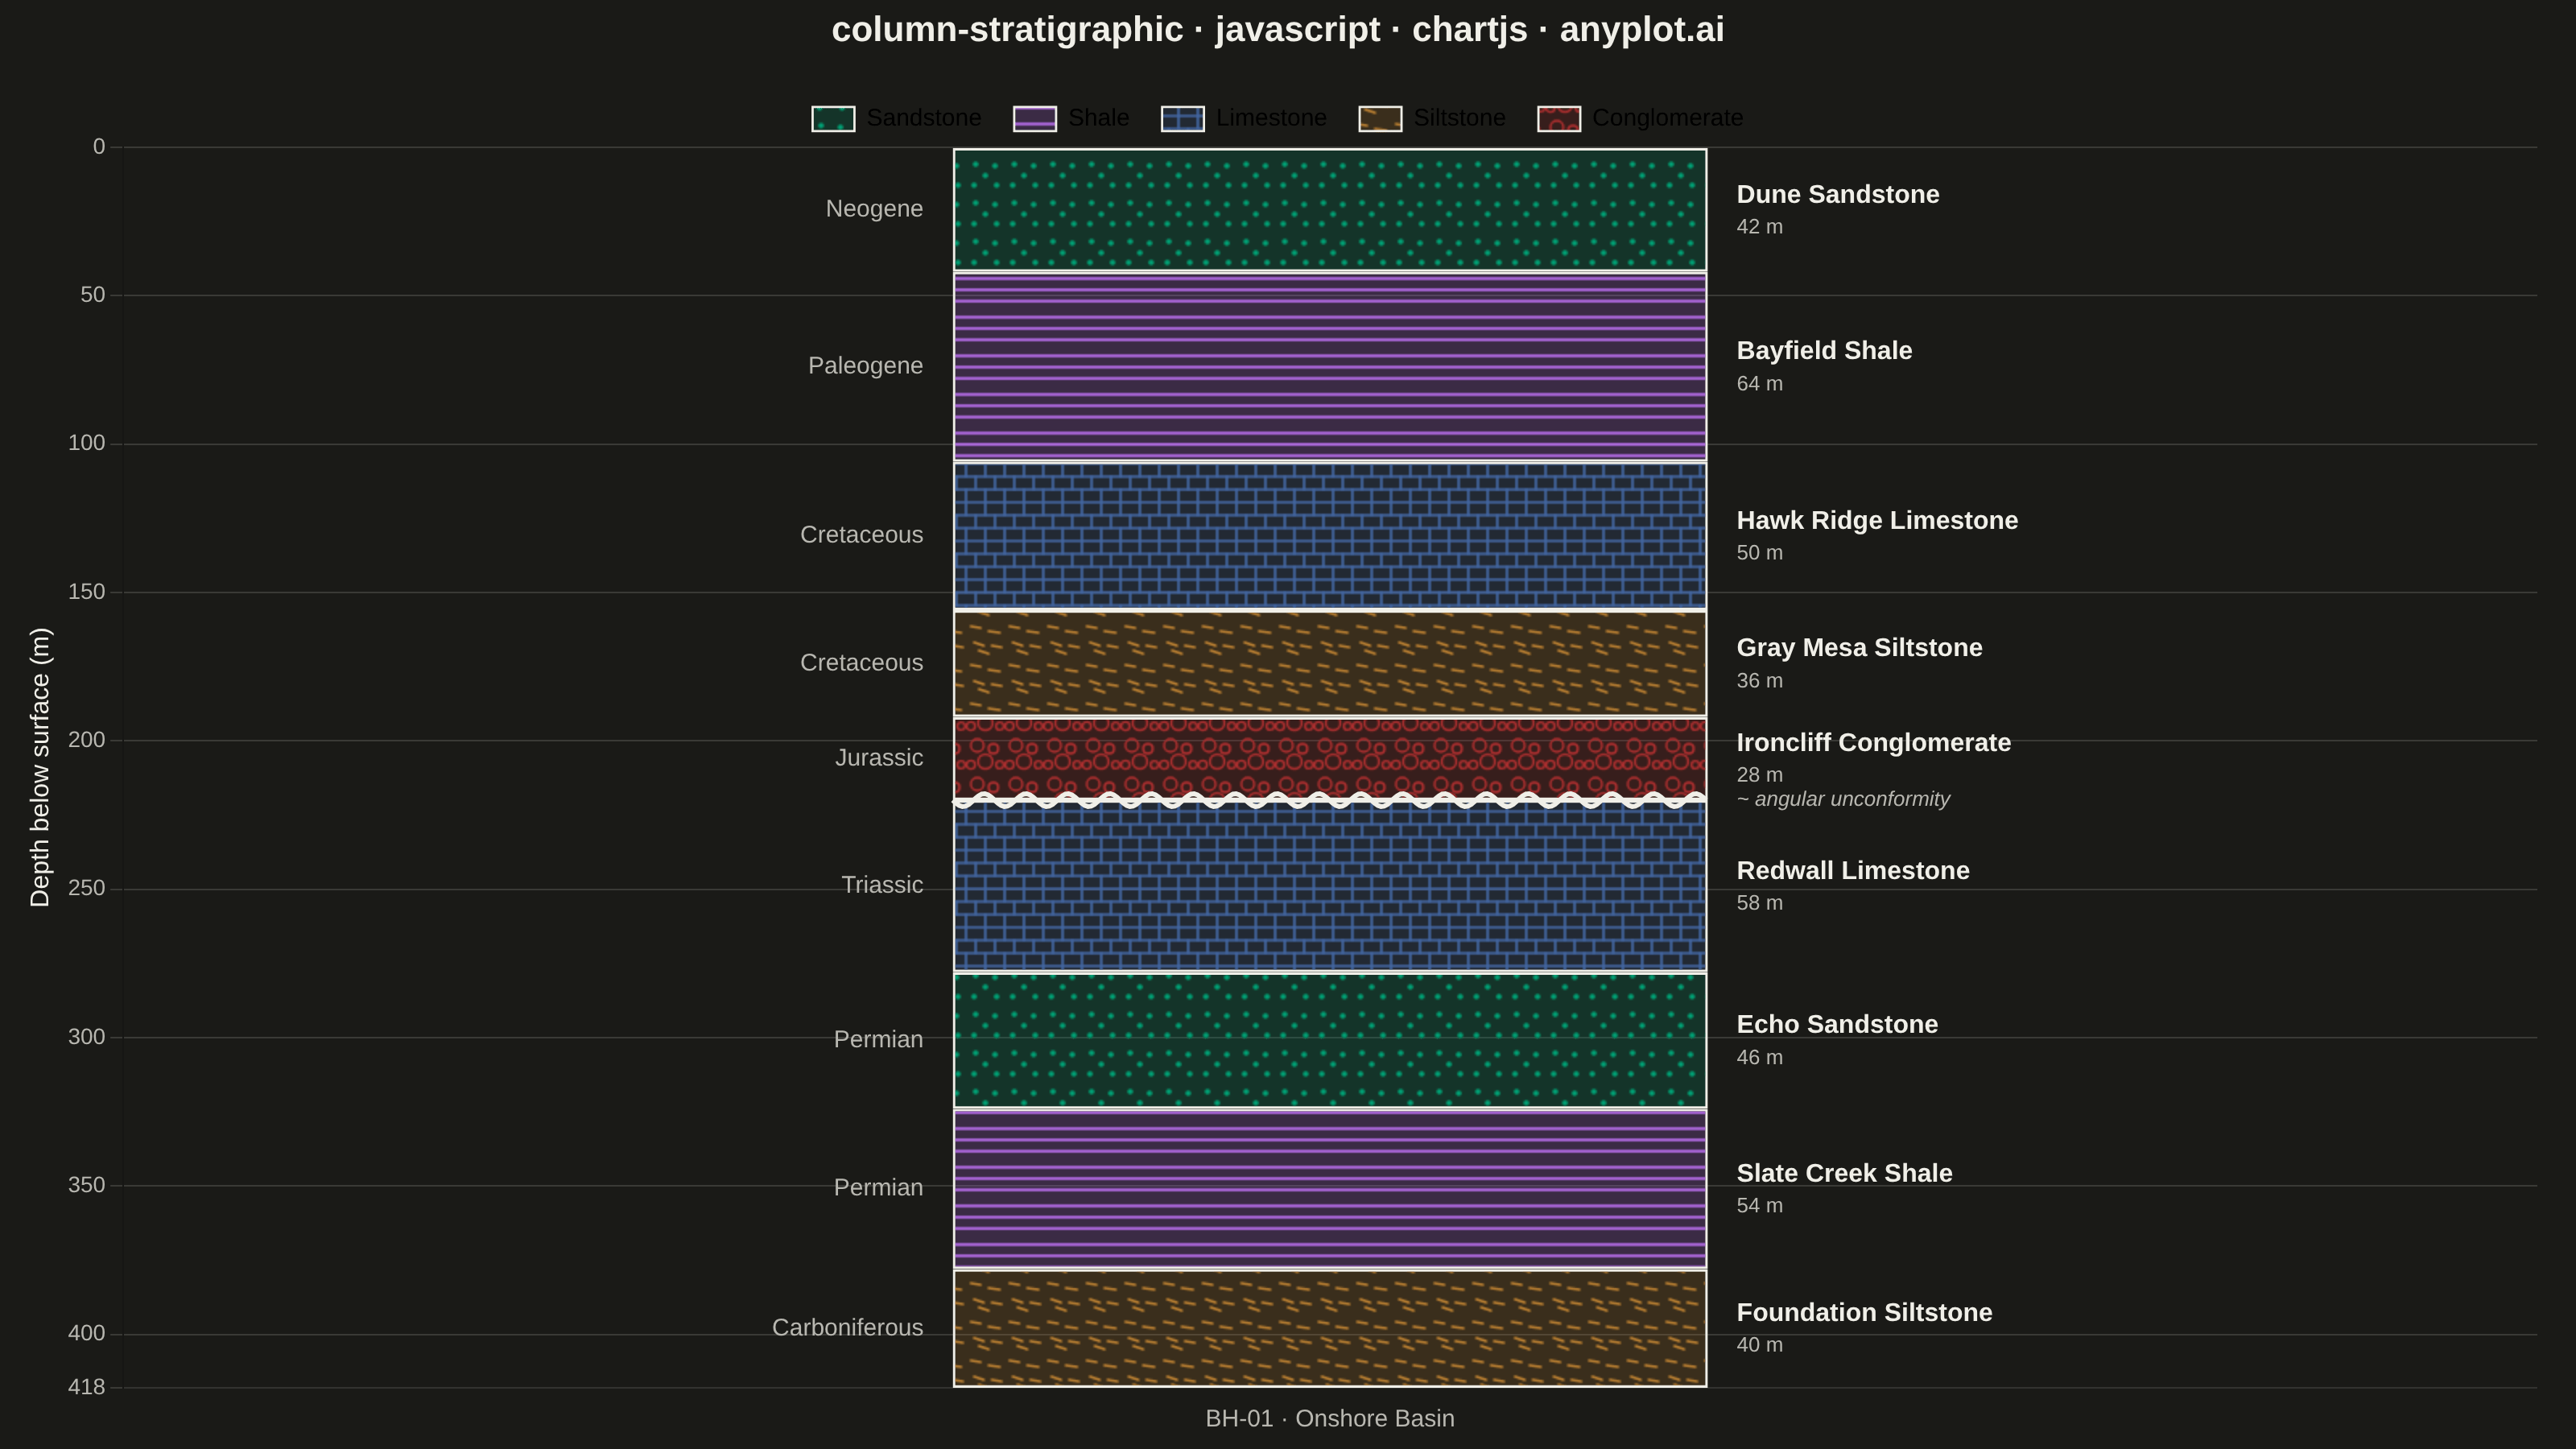
A vertical column visualization showing geological rock layers with standardized lithology patterns, formation names, ages, and thickness scales. Each layer is represented as a stacked rectangular block filled with a distinctive pattern (e.g., brick pattern for limestone, dots for sandstone, dashes for shale) following FGDC/USGS conventions. This plot is essential for communicating subsurface geology and sedimentary sequences in a compact, standardized format.
// anyplot.ai
// column-stratigraphic: Stratigraphic Column with Lithology Patterns
// Library: chartjs 4.4.7 | JavaScript 22.22.3
// Quality: 93/100 | Created: 2026-06-17
//# anyplot-orientation: landscape

const t = window.ANYPLOT_TOKENS;
const THEME = window.ANYPLOT_THEME;
const INK = t.ink;
const INK_SOFT = t.inkSoft;

// --- Lithology types (>=5 distinct FGDC-style fill patterns) ----------------
// First-appearing lithology (sandstone) takes Imprint position 1 (#009E73);
// the rest follow the canonical Imprint order.
const LITHOS = [
  { key: "sandstone", label: "Sandstone", color: t.palette[0], kind: "dots" },
  { key: "shale", label: "Shale", color: t.palette[1], kind: "hlines" },
  { key: "limestone", label: "Limestone", color: t.palette[2], kind: "brick" },
  { key: "siltstone", label: "Siltstone", color: t.palette[3], kind: "dashes" },
  { key: "conglomerate", label: "Conglomerate", color: t.palette[4], kind: "pebbles" },
];

// --- Data: synthetic borehole BH-01, surface downward (depth increases down) -
// Layers ordered top (shallowest) -> bottom (deepest).
const layers = [
  { formation: "Dune Sandstone", litho: "sandstone", thickness: 42, age: "Neogene" },
  { formation: "Bayfield Shale", litho: "shale", thickness: 64, age: "Paleogene" },
  { formation: "Hawk Ridge Limestone", litho: "limestone", thickness: 50, age: "Cretaceous" },
  { formation: "Gray Mesa Siltstone", litho: "siltstone", thickness: 36, age: "Cretaceous" },
  { formation: "Ironcliff Conglomerate", litho: "conglomerate", thickness: 28, age: "Jurassic" },
  { formation: "Redwall Limestone", litho: "limestone", thickness: 58, age: "Triassic" },
  { formation: "Echo Sandstone", litho: "sandstone", thickness: 46, age: "Permian" },
  { formation: "Slate Creek Shale", litho: "shale", thickness: 54, age: "Permian" },
  { formation: "Foundation Siltstone", litho: "siltstone", thickness: 40, age: "Carboniferous" },
];

// Angular unconformity sits below this layer index (Jurassic over Triassic).
const UNCONFORMITY_BELOW = 4;

const totalDepth = layers.reduce((s, l) => s + l.thickness, 0);

// --- Mount ------------------------------------------------------------------
const canvas = document.createElement("canvas");
document.getElementById("container").appendChild(canvas);
const ctx2d = canvas.getContext("2d");

// --- Lithology fill patterns (canvas tiles -> CanvasPattern) ----------------
const hexA = (hex, a) => {
  const n = parseInt(hex.slice(1), 16);
  return `rgba(${(n >> 16) & 255},${(n >> 8) & 255},${n & 255},${a})`;
};

const makePattern = (color, kind) => {
  const s = 24;
  const tile = document.createElement("canvas");
  tile.width = s;
  tile.height = s;
  const c = tile.getContext("2d");
  c.fillStyle = hexA(color, 0.2); // faint colour wash so the block reads as colour + texture
  c.fillRect(0, 0, s, s);
  c.strokeStyle = color;
  c.fillStyle = color;
  c.lineWidth = 1.6;
  c.lineCap = "round";

  if (kind === "dots") {
    // sandstone — stipple dots
    [[6, 6], [18, 7], [12, 13], [5, 19], [19, 19]].forEach(([x, y]) => {
      c.beginPath();
      c.arc(x, y, 1.8, 0, Math.PI * 2);
      c.fill();
    });
  } else if (kind === "hlines") {
    // shale — horizontal dashes
    [5, 12, 19].forEach((y) => {
      c.beginPath();
      c.moveTo(0, y);
      c.lineTo(s, y);
      c.stroke();
    });
  } else if (kind === "brick") {
    // limestone — offset brick courses
    for (let y = 0; y <= s; y += 8) {
      c.beginPath();
      c.moveTo(0, y);
      c.lineTo(s, y);
      c.stroke();
    }
    let row = 0;
    for (let y = 0; y < s; y += 8) {
      const xs = row % 2 === 0 ? [0, 12, 24] : [6, 18];
      xs.forEach((x) => {
        c.beginPath();
        c.moveTo(x, y);
        c.lineTo(x, y + 8);
        c.stroke();
      });
      row += 1;
    }
  } else if (kind === "dashes") {
    // siltstone — short random dashes
    [[3, 5, 9, 6], [14, 8, 21, 9], [5, 15, 11, 17], [16, 17, 22, 18], [8, 20, 14, 22]].forEach(
      ([x1, y1, x2, y2]) => {
        c.beginPath();
        c.moveTo(x1, y1);
        c.lineTo(x2, y2);
        c.stroke();
      }
    );
  } else if (kind === "pebbles") {
    // conglomerate — outlined pebbles
    c.lineWidth = 1.4;
    [[7, 7, 4], [17, 9, 3], [12, 17, 4.5], [21, 19, 2.4], [3, 19, 2.6]].forEach(([x, y, r]) => {
      c.beginPath();
      c.arc(x, y, r, 0, Math.PI * 2);
      c.stroke();
    });
  }
  return ctx2d.createPattern(tile, "repeat");
};

const patterns = {};
LITHOS.forEach((l) => {
  patterns[l.key] = makePattern(l.color, l.kind);
});

// --- Datasets: one stacked segment per layer (thickness on a reversed depth axis)
const datasets = layers.map((l) => ({
  label: l.formation,
  data: [l.thickness],
  backgroundColor: patterns[l.litho],
  borderColor: INK,
  borderWidth: 1.6,
  borderSkipped: false,
  categoryPercentage: 0.92,
  barPercentage: 0.34,
}));

// --- Plugin: formation / age / thickness labels, unconformity --------------
const annotate = {
  id: "strataLabels",
  afterDatasetsDraw(chart) {
    const ctx = chart.ctx;
    const first = chart.getDatasetMeta(0).data[0];
    if (!first) return;
    const colX = first.x;
    const halfW = first.width / 2;
    const leftEdge = colX - halfW;
    const rightEdge = colX + halfW;

    ctx.save();
    ctx.textBaseline = "middle";

    layers.forEach((layer, i) => {
      const bar = chart.getDatasetMeta(i).data[0];
      if (!bar) return;
      const top = Math.min(bar.y, bar.base);
      const bot = Math.max(bar.y, bar.base);
      const cy = (top + bot) / 2;

      // Age label — left of the column
      ctx.fillStyle = INK_SOFT;
      ctx.textAlign = "right";
      ctx.font = "500 15px -apple-system, Segoe UI, Roboto, sans-serif";
      ctx.fillText(layer.age, leftEdge - 18, cy);

      // Formation name + thickness — right of the column
      ctx.textAlign = "left";
      ctx.fillStyle = INK;
      ctx.font = "600 16px -apple-system, Segoe UI, Roboto, sans-serif";
      ctx.fillText(layer.formation, rightEdge + 18, cy - 9);
      ctx.fillStyle = INK_SOFT;
      ctx.font = "400 13px -apple-system, Segoe UI, Roboto, sans-serif";
      ctx.fillText(`${layer.thickness} m`, rightEdge + 18, cy + 11);
    });

    // Angular unconformity — wavy boundary line drawn over the straight border
    const uncBar = chart.getDatasetMeta(UNCONFORMITY_BELOW).data[0];
    if (uncBar) {
      const yU = Math.max(uncBar.y, uncBar.base);
      ctx.strokeStyle = INK;
      ctx.lineWidth = 3;
      ctx.beginPath();
      const amp = 4;
      const period = 26;
      for (let x = leftEdge; x <= rightEdge; x += 2) {
        const y = yU + amp * Math.sin(((x - leftEdge) / period) * Math.PI * 2);
        x === leftEdge ? ctx.moveTo(x, y) : ctx.lineTo(x, y);
      }
      ctx.stroke();
      ctx.fillStyle = INK_SOFT;
      ctx.textAlign = "left";
      ctx.font = "italic 13px -apple-system, Segoe UI, Roboto, sans-serif";
      ctx.fillText("~ angular unconformity", rightEdge + 18, yU);
    }
    ctx.restore();
  },
};

// --- Chart ------------------------------------------------------------------
new Chart(canvas, {
  type: "bar",
  data: { labels: ["BH-01 · Onshore Basin"], datasets },
  options: {
    responsive: true,
    maintainAspectRatio: false,
    animation: false,
    layout: { padding: { top: 6, right: 24, bottom: 6, left: 12 } },
    plugins: {
      title: {
        display: true,
        text: "column-stratigraphic · javascript · chartjs · anyplot.ai",
        color: INK,
        font: { size: 22, weight: "600" },
        padding: { bottom: 14 },
      },
      legend: {
        position: "top",
        onClick: () => {},
        labels: {
          color: INK,
          font: { size: 15 },
          boxWidth: 26,
          boxHeight: 15,
          padding: 20,
          generateLabels: () =>
            LITHOS.map((l) => ({
              text: l.label,
              fillStyle: patterns[l.key],
              strokeStyle: INK,
              lineWidth: 1.4,
            })),
        },
      },
      tooltip: { enabled: false },
    },
    scales: {
      x: {
        stacked: true,
        grid: { display: false },
        ticks: { color: INK_SOFT, font: { size: 15 } },
      },
      y: {
        stacked: true,
        reverse: true,
        min: 0,
        max: totalDepth,
        title: { display: true, text: "Depth below surface (m)", color: INK, font: { size: 16 } },
        ticks: { color: INK_SOFT, font: { size: 14 }, stepSize: 50 },
        grid: { color: t.grid },
      },
    },
  },
  plugins: [annotate],
});
Runnable source as JSON, for any HTTP client: https://api.anyplot.ai/specs/column-stratigraphic/chartjs/code. Any spec id and library id listed in llms-full.txt fit the same URL shape; every URL below is complete and callable.
{
  "spec_id": "column-stratigraphic",
  "language": "javascript",
  "library": "chartjs",
  "page": "https://anyplot.ai/column-stratigraphic/javascript/chartjs",
  "hub": "https://anyplot.ai/column-stratigraphic",
  "code_json": "https://api.anyplot.ai/specs/column-stratigraphic/chartjs/code",
  "spec_json": "https://api.anyplot.ai/specs/column-stratigraphic",
  "render_light_png": "https://storage.googleapis.com/anyplot-images/plots/column-stratigraphic/javascript/chartjs/plot-light.png",
  "render_dark_png": "https://storage.googleapis.com/anyplot-images/plots/column-stratigraphic/javascript/chartjs/plot-dark.png",
  "interactive_light_html": "https://storage.googleapis.com/anyplot-images/plots/column-stratigraphic/javascript/chartjs/plot-light.html",
  "interactive_dark_html": "https://storage.googleapis.com/anyplot-images/plots/column-stratigraphic/javascript/chartjs/plot-dark.html",
  "quality_score": 93.0,
  "license": "MIT",
  "guide": "https://anyplot.ai/llms.txt"
}
Part of Stratigraphic Column with Lithology Patterns on anyplot.ai.