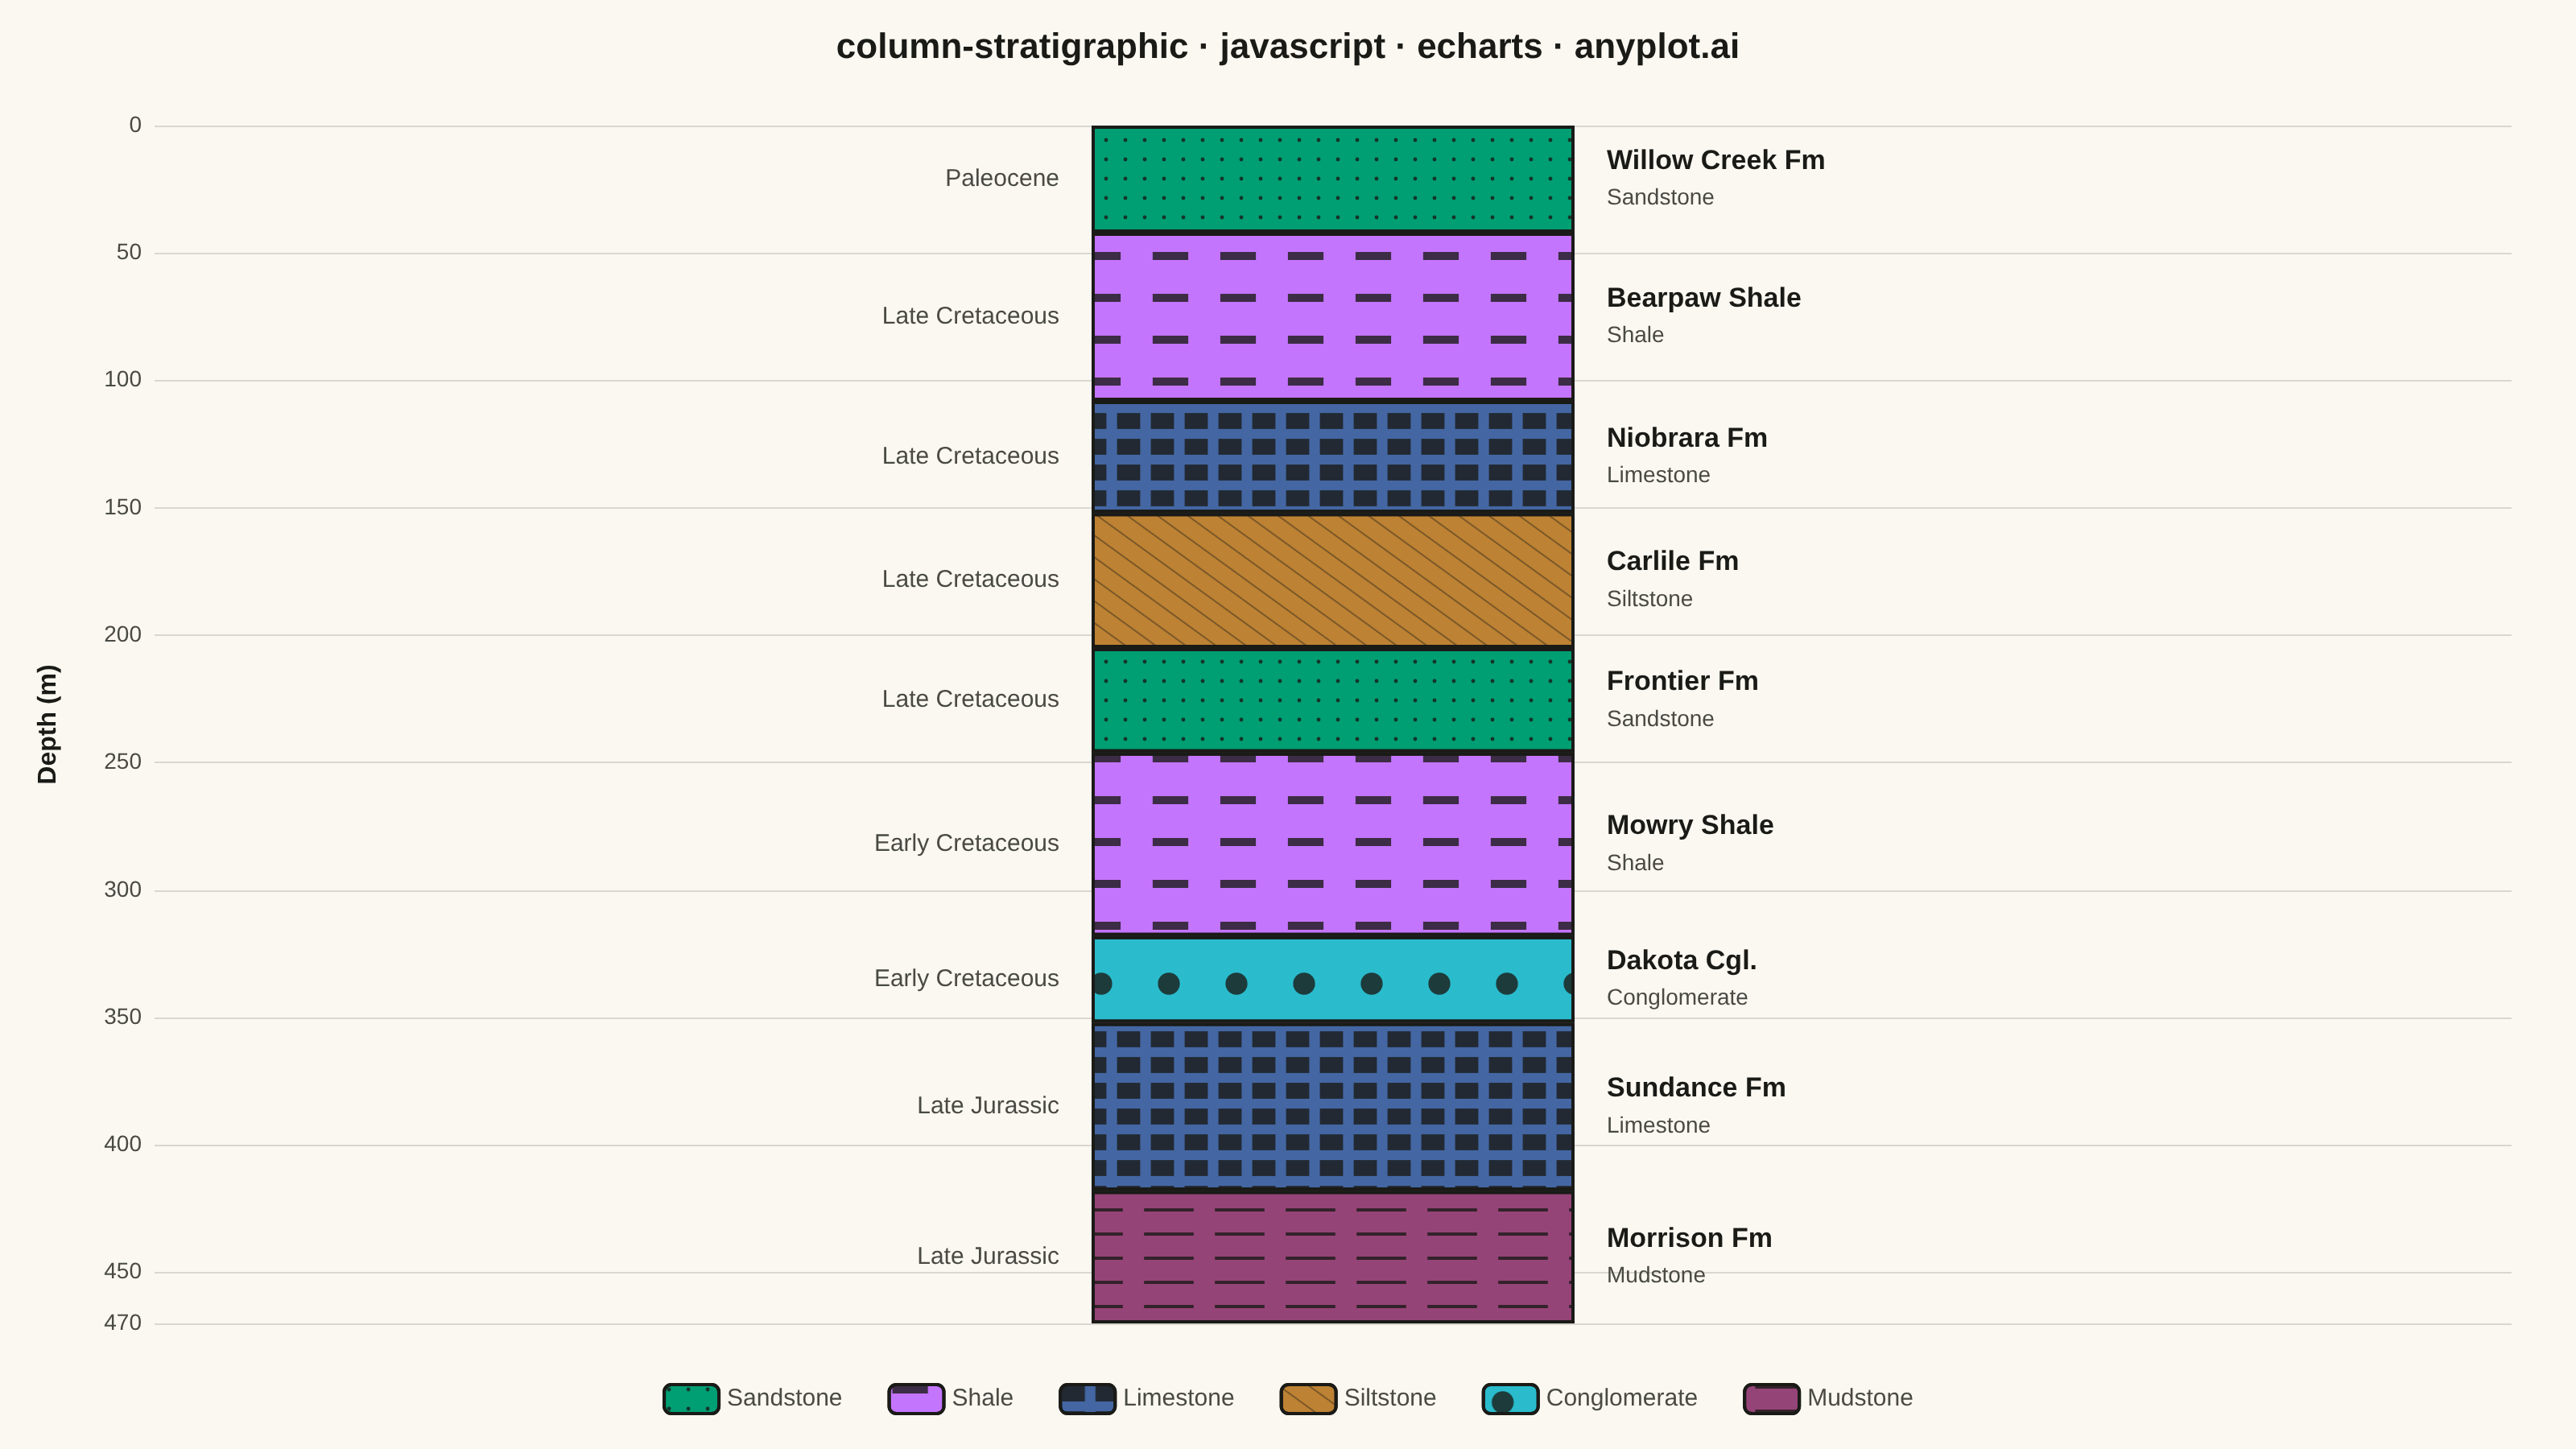
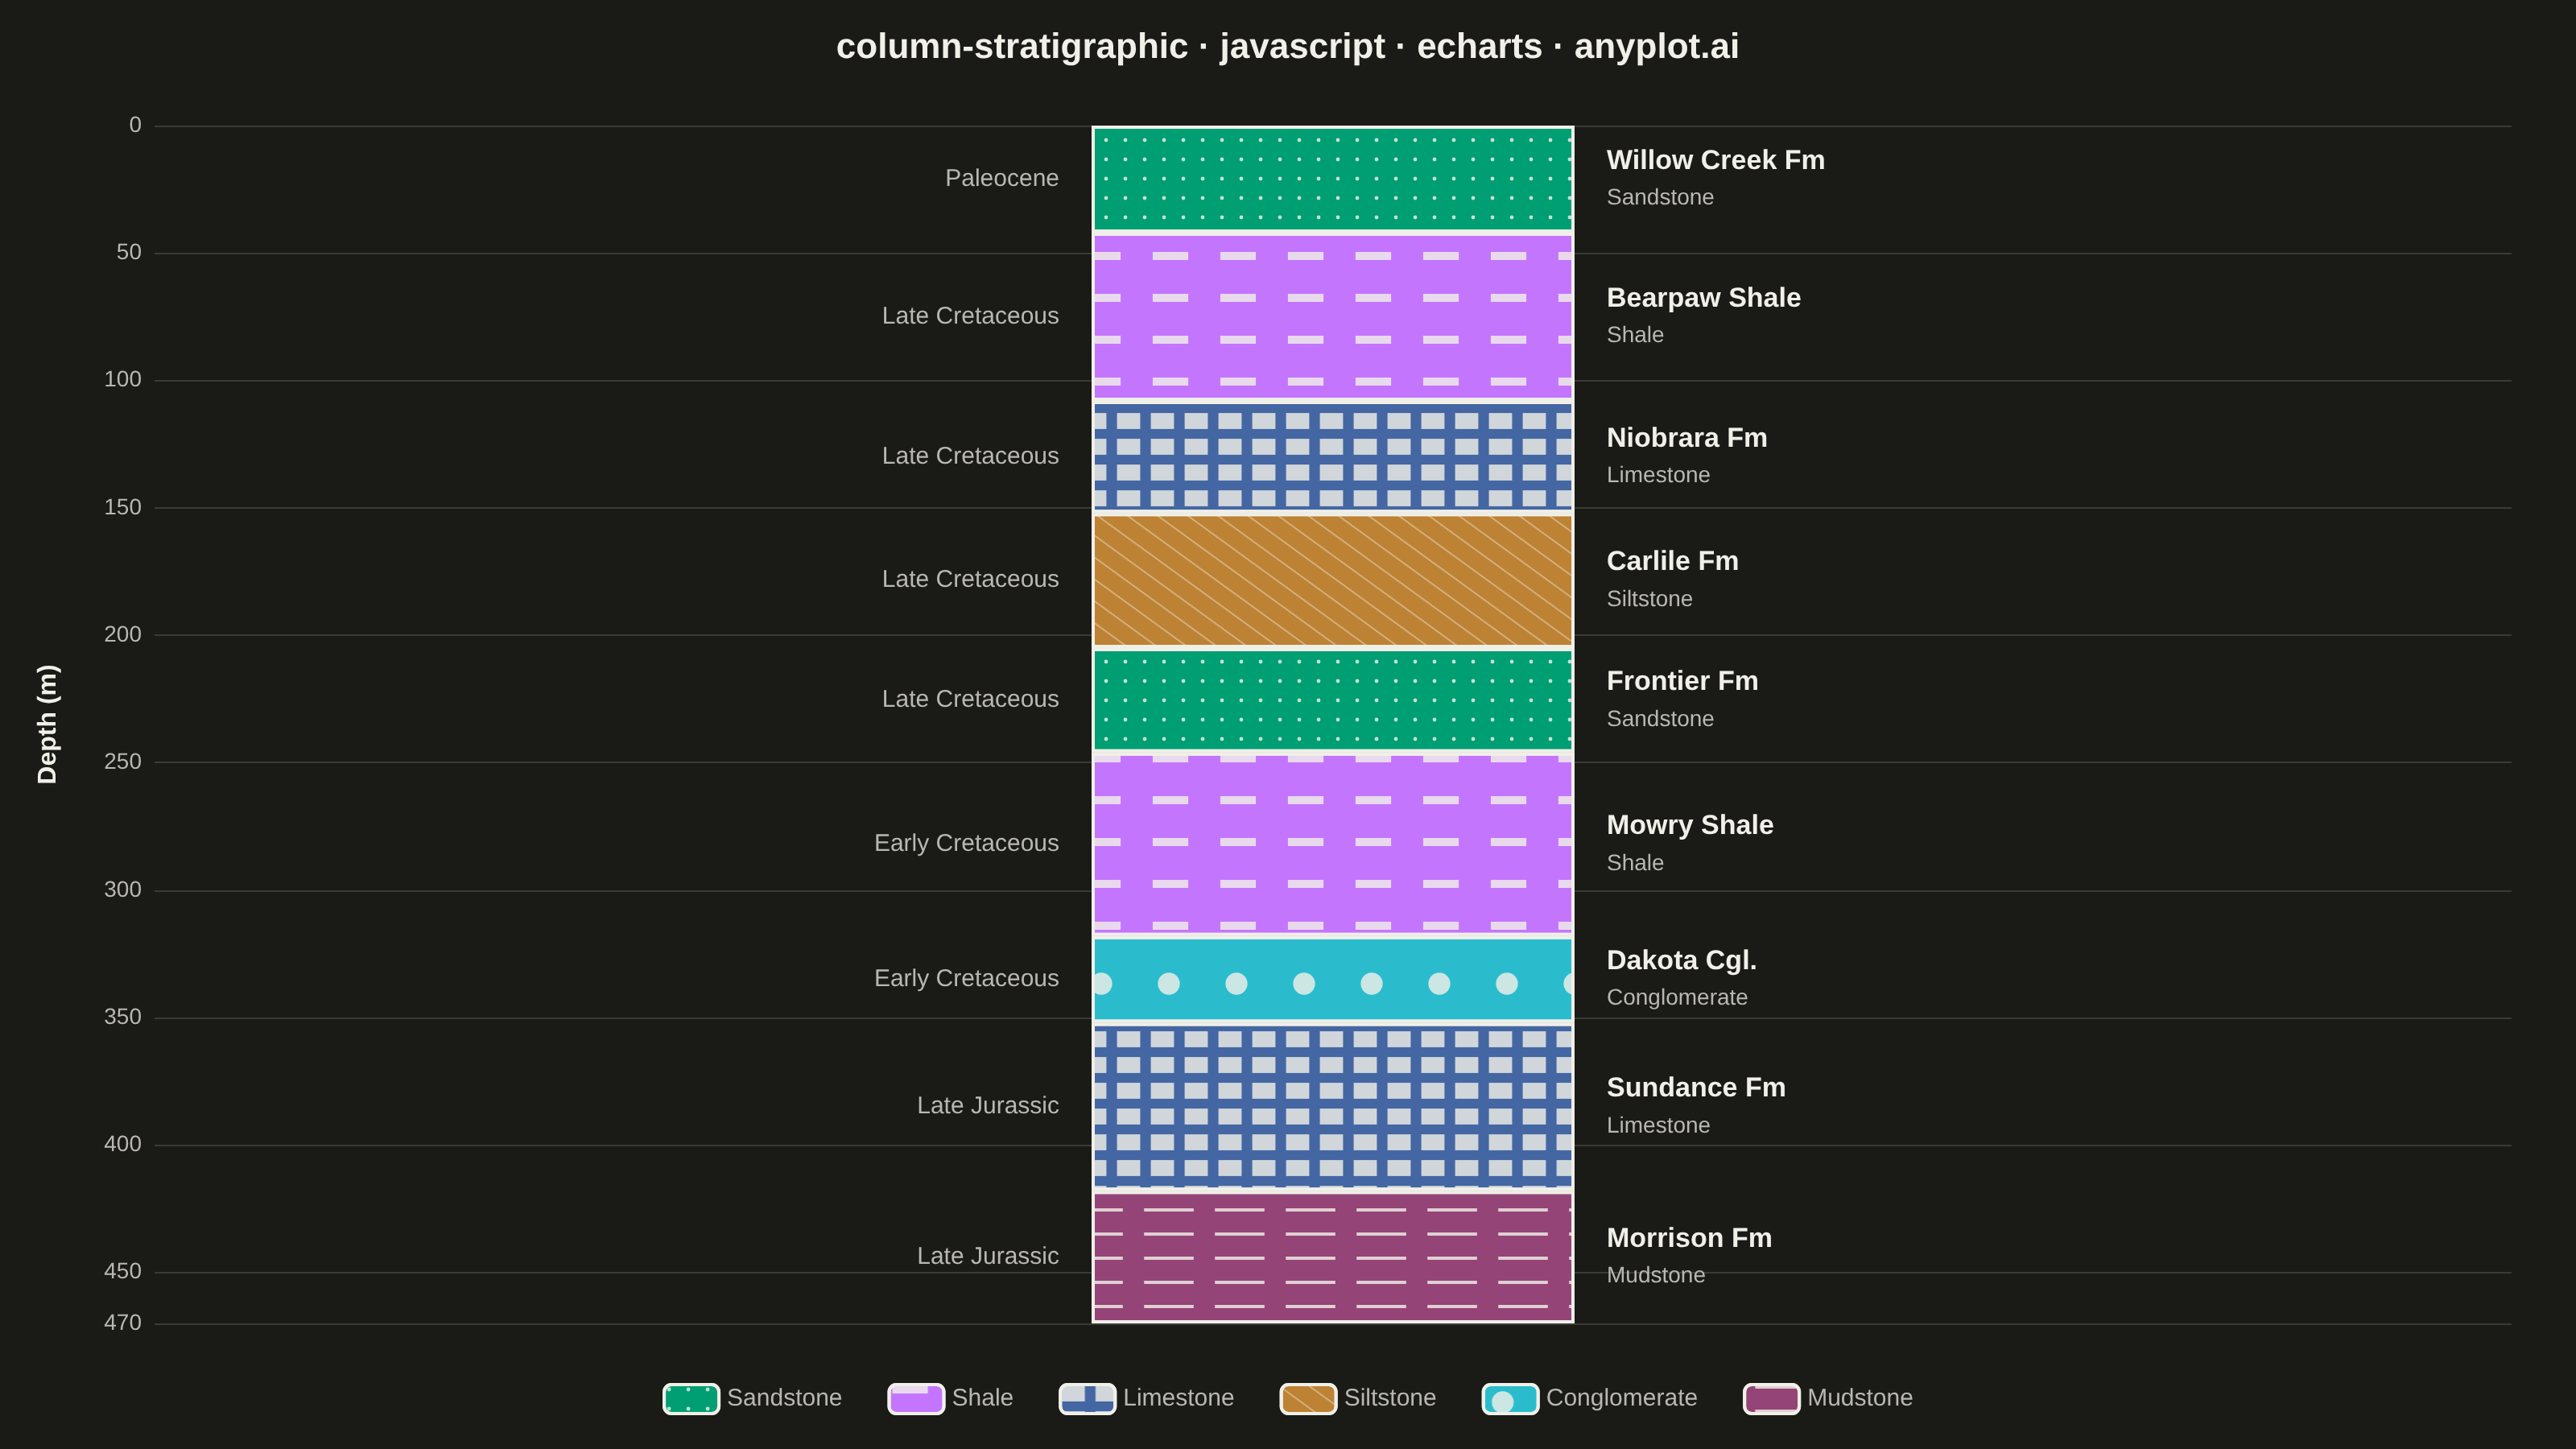
A vertical column visualization showing geological rock layers with standardized lithology patterns, formation names, ages, and thickness scales. Each layer is represented as a stacked rectangular block filled with a distinctive pattern (e.g., brick pattern for limestone, dots for sandstone, dashes for shale) following FGDC/USGS conventions. This plot is essential for communicating subsurface geology and sedimentary sequences in a compact, standardized format.
// anyplot.ai
// column-stratigraphic: Stratigraphic Column with Lithology Patterns
// Library: echarts 5.5.1 | JavaScript 22.22.3
// Quality: 94/100 | Created: 2026-06-17
//# anyplot-orientation: landscape

const t = window.ANYPLOT_TOKENS;
const theme = window.ANYPLOT_THEME;

// Theme-adaptive chrome
const INK = t.ink; // primary text
const INK_SOFT = t.inkSoft; // secondary text
const GRID = t.grid; // gridlines
// Decal (lithology symbol) ink — texture flips with theme so the FGDC-style
// hatch stays legible on the saturated Imprint fills on both surfaces.
const DECAL_INK = theme === "dark" ? "rgba(240,239,232,0.82)" : "rgba(26,26,23,0.80)";

// --- Lithology key ----------------------------------------------------------
// Each rock type pairs an Imprint hue with a decal approximating the standard
// FGDC/USGS map symbol (dots = sandstone, dashes = shale, brick = limestone,
// diagonal = siltstone, pebbles = conglomerate, fine laminae = mudstone).
// Brand green (#009E73) anchors the first lithology; the semantic-red slot is
// skipped — these are neutral earth categories.
function decalFor(kind) {
  switch (kind) {
    case "dots": // sandstone — stipple
      return { symbol: "circle", color: DECAL_INK, symbolSize: 0.4, dashArrayX: [6, 6], dashArrayY: [6, 6] };
    case "hdash": // shale — broken horizontal dashes
      return { symbol: "rect", color: DECAL_INK, symbolSize: 0.85, dashArrayX: [26, 16], dashArrayY: [6, 20] };
    case "brick": // limestone — staggered blocks
      return { symbol: "rect", color: DECAL_INK, symbolSize: 0.9,
               dashArrayX: [[16, 5], [16, 5]], dashArrayY: [11, 5], maxTileWidth: 40, maxTileHeight: 32 };
    case "diagonal": // siltstone — diagonal hatch
      return { symbol: "line", color: DECAL_INK, dashArrayX: [1, 0], dashArrayY: [3, 8], rotation: Math.PI / 5 };
    case "pebbles": // conglomerate — coarse clasts
      return { symbol: "circle", color: DECAL_INK, symbolSize: 0.62, dashArrayX: [24, 18], dashArrayY: [22, 18] };
    case "fline": // mudstone — fine continuous laminae
      return { symbol: "rect", color: DECAL_INK, symbolSize: 0.7, dashArrayX: [44, 0], dashArrayY: [3, 12] };
    default:
      return { symbol: "rect", color: DECAL_INK };
  }
}

const LITHO = {
  Sandstone: { color: t.palette[0], decal: "dots" }, // brand green — first series
  Shale: { color: t.palette[1], decal: "hdash" }, // lavender
  Limestone: { color: t.palette[2], decal: "brick" }, // blue
  Siltstone: { color: t.palette[3], decal: "diagonal" }, // ochre
  Conglomerate: { color: t.palette[5], decal: "pebbles" }, // cyan (skip red slot 5)
  Mudstone: { color: t.palette[6], decal: "fline" }, // rose
};

// --- Data (synthetic well section, depth increasing downward) ---------------
// Top→bottom borehole log spanning Paleocene to Late Jurassic.
const layers = [
  { top: 0, bottom: 42, lithology: "Sandstone", formation: "Willow Creek Fm", age: "Paleocene" },
  { top: 42, bottom: 108, lithology: "Shale", formation: "Bearpaw Shale", age: "Late Cretaceous" },
  { top: 108, bottom: 152, lithology: "Limestone", formation: "Niobrara Fm", age: "Late Cretaceous" },
  { top: 152, bottom: 205, lithology: "Siltstone", formation: "Carlile Fm", age: "Late Cretaceous" },
  { top: 205, bottom: 246, lithology: "Sandstone", formation: "Frontier Fm", age: "Late Cretaceous" },
  { top: 246, bottom: 318, lithology: "Shale", formation: "Mowry Shale", age: "Early Cretaceous" },
  { top: 318, bottom: 352, lithology: "Conglomerate", formation: "Dakota Cgl.", age: "Early Cretaceous" },
  { top: 352, bottom: 418, lithology: "Limestone", formation: "Sundance Fm", age: "Late Jurassic" },
  { top: 418, bottom: 470, lithology: "Mudstone", formation: "Morrison Fm", age: "Late Jurassic" },
];
const maxDepth = 470;
const BAR_WIDTH = 300; // chart px; column width (final PNG is 2×)

// One stacked bar series per layer — decal + color carry the lithology; the
// solid INK border draws the layer boundary lines.
const barSeries = layers.map((l) => ({
  name: l.lithology,
  type: "bar",
  stack: "section",
  barWidth: BAR_WIDTH,
  data: [l.bottom - l.top],
  itemStyle: {
    color: LITHO[l.lithology].color,
    decal: decalFor(LITHO[l.lithology].decal),
    borderColor: INK,
    borderWidth: 2,
  },
  emphasis: { disabled: true },
}));

// --- Label overlay: a custom series in the same grid draws the formation
// (right of column) and age/period (left of column) for each layer. -----------
function renderLabels(params, api) {
  const i = params.dataIndex;
  const l = layers[i];
  const mid = (l.top + l.bottom) / 2;
  const center = api.coord([0, mid]); // [centerX_px, y_px] for the single category
  const cx = center[0];
  const cy = center[1];
  const half = BAR_WIDTH / 2;

  const formation = {
    type: "text",
    style: {
      text: l.formation,
      x: cx + half + 20,
      y: cy - 11,
      textAlign: "left",
      textVerticalAlign: "middle",
      fill: INK,
      fontSize: 17,
      fontWeight: "bold",
    },
  };
  const lithology = {
    type: "text",
    style: {
      text: l.lithology,
      x: cx + half + 20,
      y: cy + 12,
      textAlign: "left",
      textVerticalAlign: "middle",
      fill: INK_SOFT,
      fontSize: 14,
    },
  };
  const age = {
    type: "text",
    style: {
      text: l.age,
      x: cx - half - 20,
      y: cy,
      textAlign: "right",
      textVerticalAlign: "middle",
      fill: INK_SOFT,
      fontSize: 15,
    },
  };
  return { type: "group", children: [age, formation, lithology] };
}

// --- Init -------------------------------------------------------------------
const chart = echarts.init(document.getElementById("container"));

chart.setOption({
  animation: false,
  backgroundColor: "transparent",
  color: t.palette,
  title: {
    text: "column-stratigraphic · javascript · echarts · anyplot.ai",
    left: "center",
    top: 14,
    textStyle: { color: INK, fontSize: 22, fontWeight: "bold" },
  },
  legend: {
    data: Object.keys(LITHO),
    bottom: 16,
    textStyle: { color: INK_SOFT, fontSize: 15 },
    itemWidth: 34,
    itemHeight: 18,
    itemGap: 28,
  },
  grid: { left: 96, right: 40, top: 78, bottom: 78 },
  xAxis: {
    type: "category",
    data: ["Section"],
    show: false,
  },
  yAxis: {
    type: "value",
    name: "Depth (m)",
    nameLocation: "middle",
    nameGap: 58,
    nameTextStyle: { color: INK, fontSize: 16, fontWeight: "bold" },
    min: 0,
    max: maxDepth,
    inverse: true,
    interval: 50,
    axisLine: { lineStyle: { color: INK_SOFT } },
    axisTick: { lineStyle: { color: INK_SOFT } },
    axisLabel: { color: INK_SOFT, fontSize: 14 },
    splitLine: { lineStyle: { color: GRID } },
  },
  series: [
    ...barSeries,
    {
      name: "labels",
      type: "custom",
      renderItem: renderLabels,
      data: layers.map((l) => [(l.top + l.bottom) / 2]),
      silent: true,
      z: 10,
      tooltip: { show: false },
    },
  ],
});
Runnable source as JSON, for any HTTP client: https://api.anyplot.ai/specs/column-stratigraphic/echarts/code. Any spec id and library id listed in llms-full.txt fit the same URL shape; every URL below is complete and callable.
{
  "spec_id": "column-stratigraphic",
  "language": "javascript",
  "library": "echarts",
  "page": "https://anyplot.ai/column-stratigraphic/javascript/echarts",
  "hub": "https://anyplot.ai/column-stratigraphic",
  "code_json": "https://api.anyplot.ai/specs/column-stratigraphic/echarts/code",
  "spec_json": "https://api.anyplot.ai/specs/column-stratigraphic",
  "render_light_png": "https://storage.googleapis.com/anyplot-images/plots/column-stratigraphic/javascript/echarts/plot-light.png",
  "render_dark_png": "https://storage.googleapis.com/anyplot-images/plots/column-stratigraphic/javascript/echarts/plot-dark.png",
  "interactive_light_html": "https://storage.googleapis.com/anyplot-images/plots/column-stratigraphic/javascript/echarts/plot-light.html",
  "interactive_dark_html": "https://storage.googleapis.com/anyplot-images/plots/column-stratigraphic/javascript/echarts/plot-dark.html",
  "quality_score": 94.0,
  "license": "MIT",
  "guide": "https://anyplot.ai/llms.txt"
}
Part of Stratigraphic Column with Lithology Patterns on anyplot.ai.