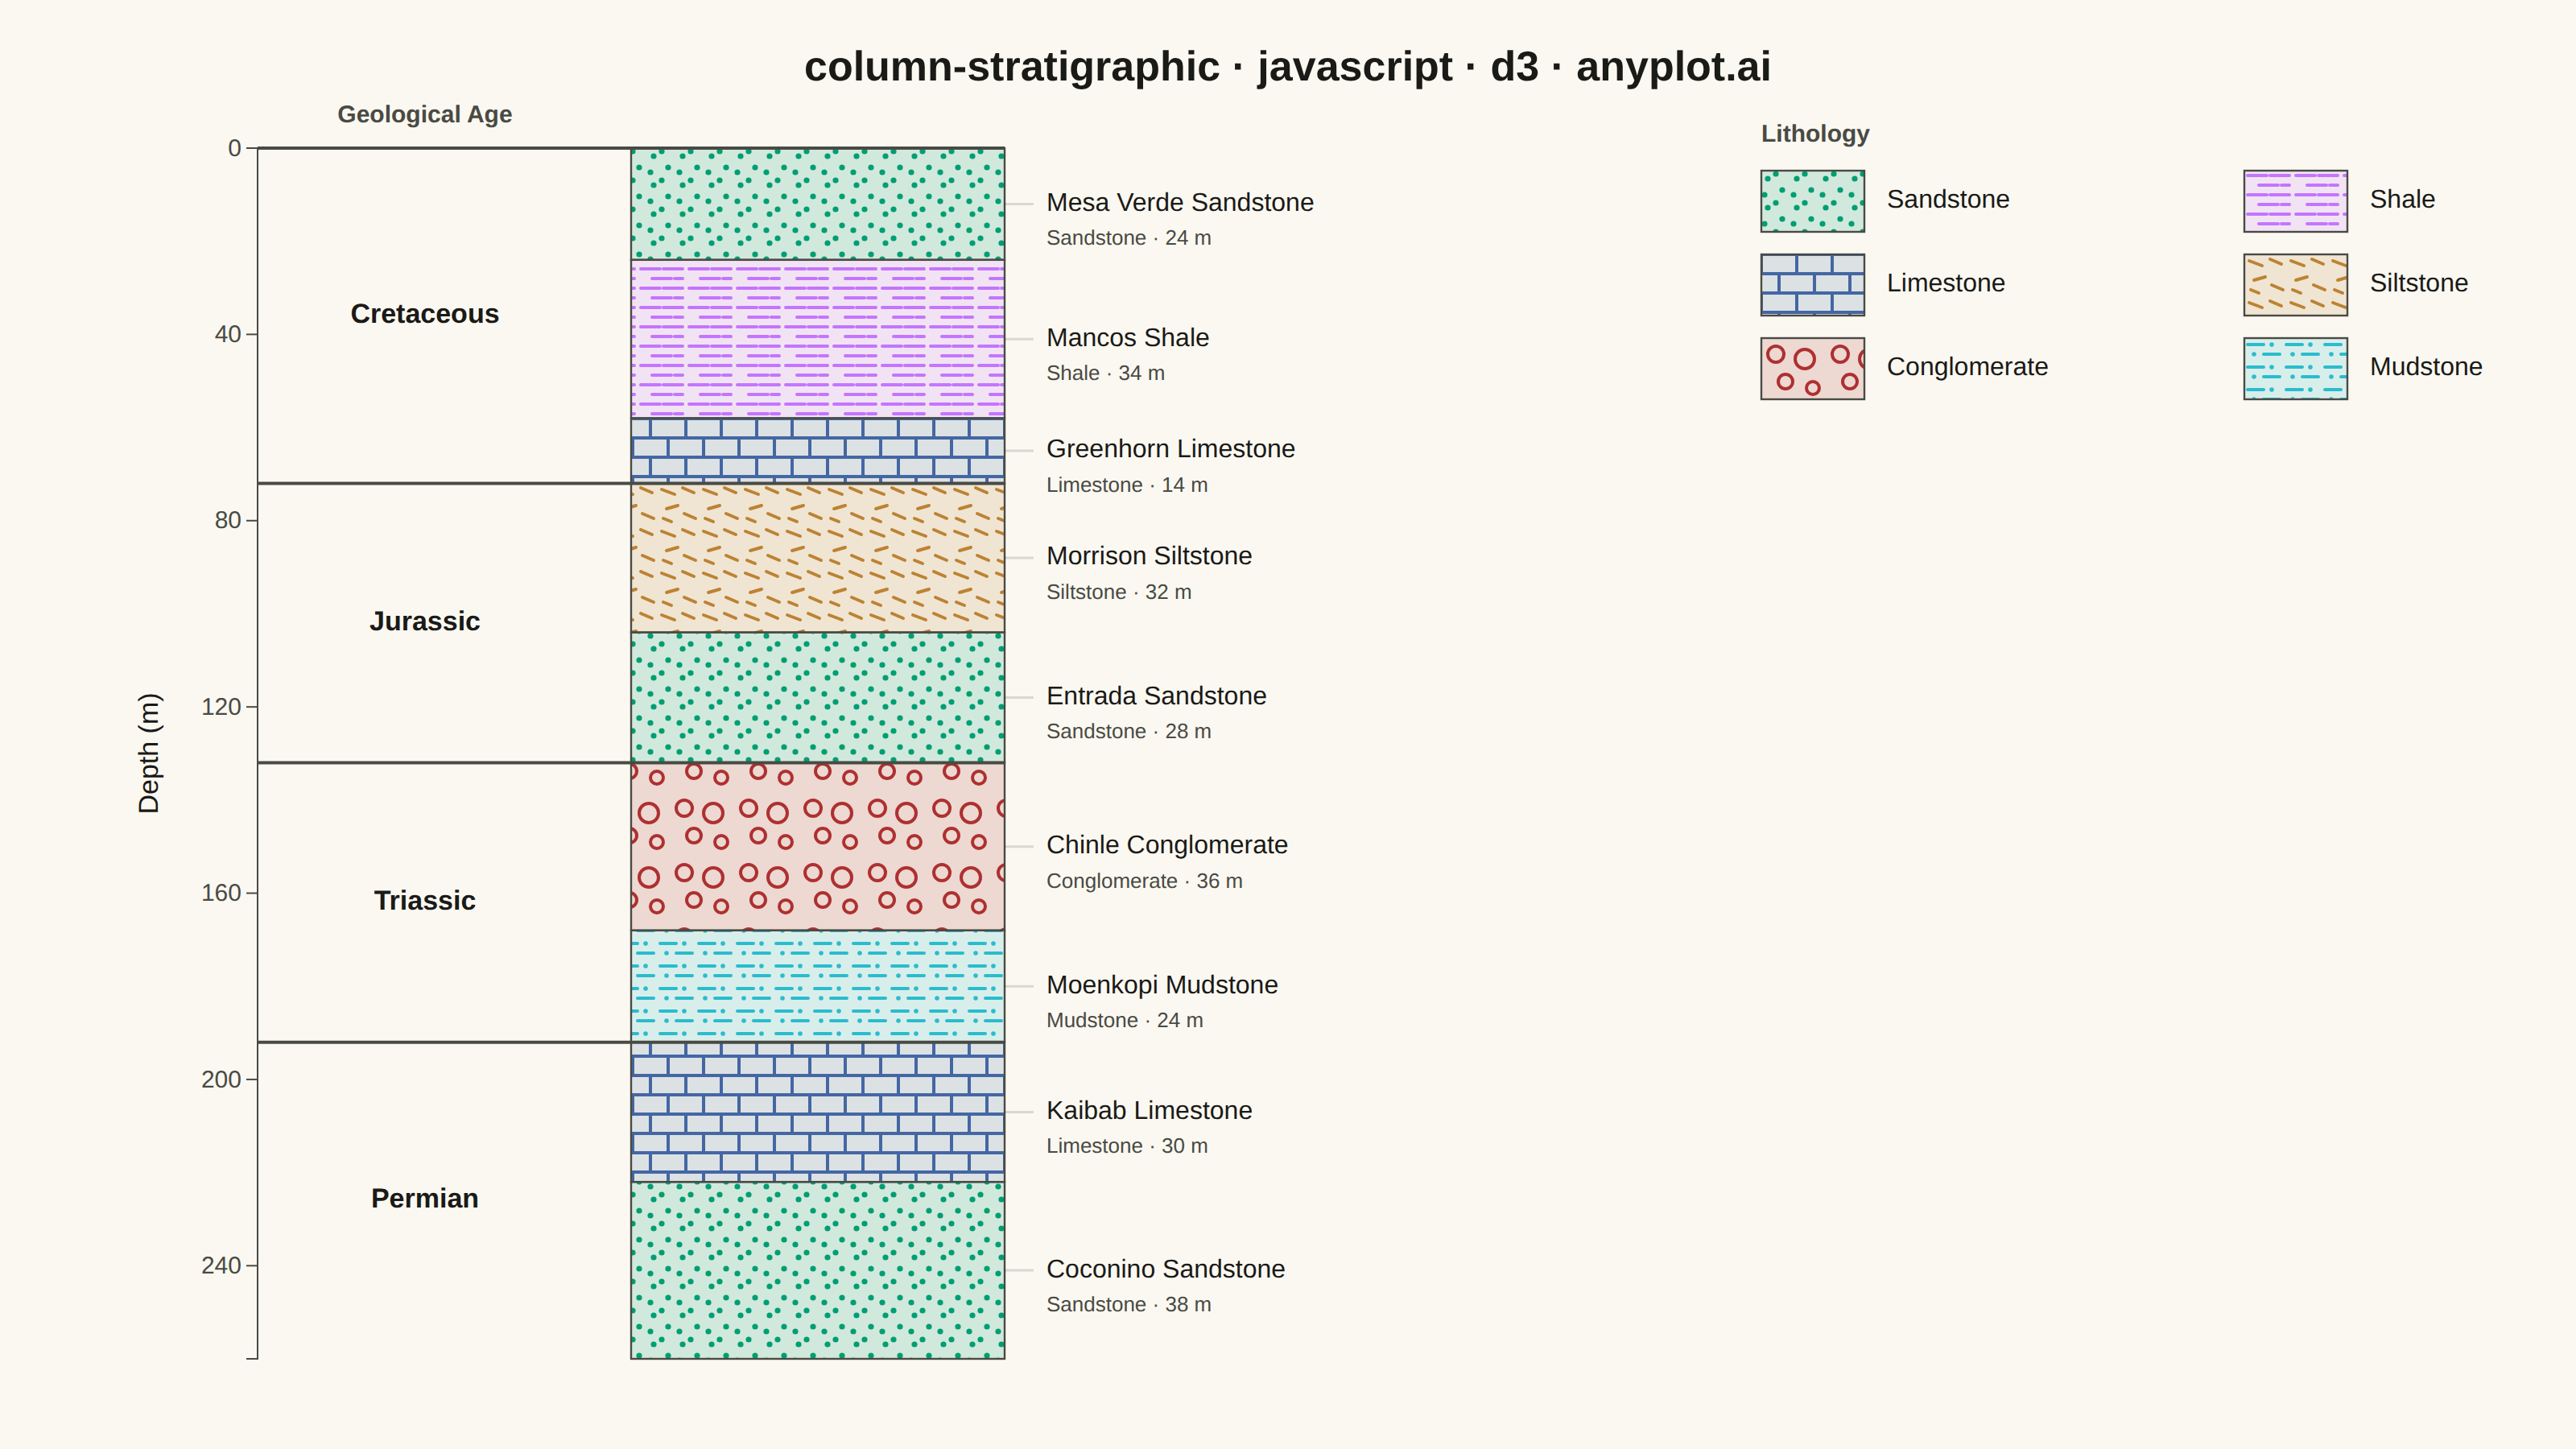
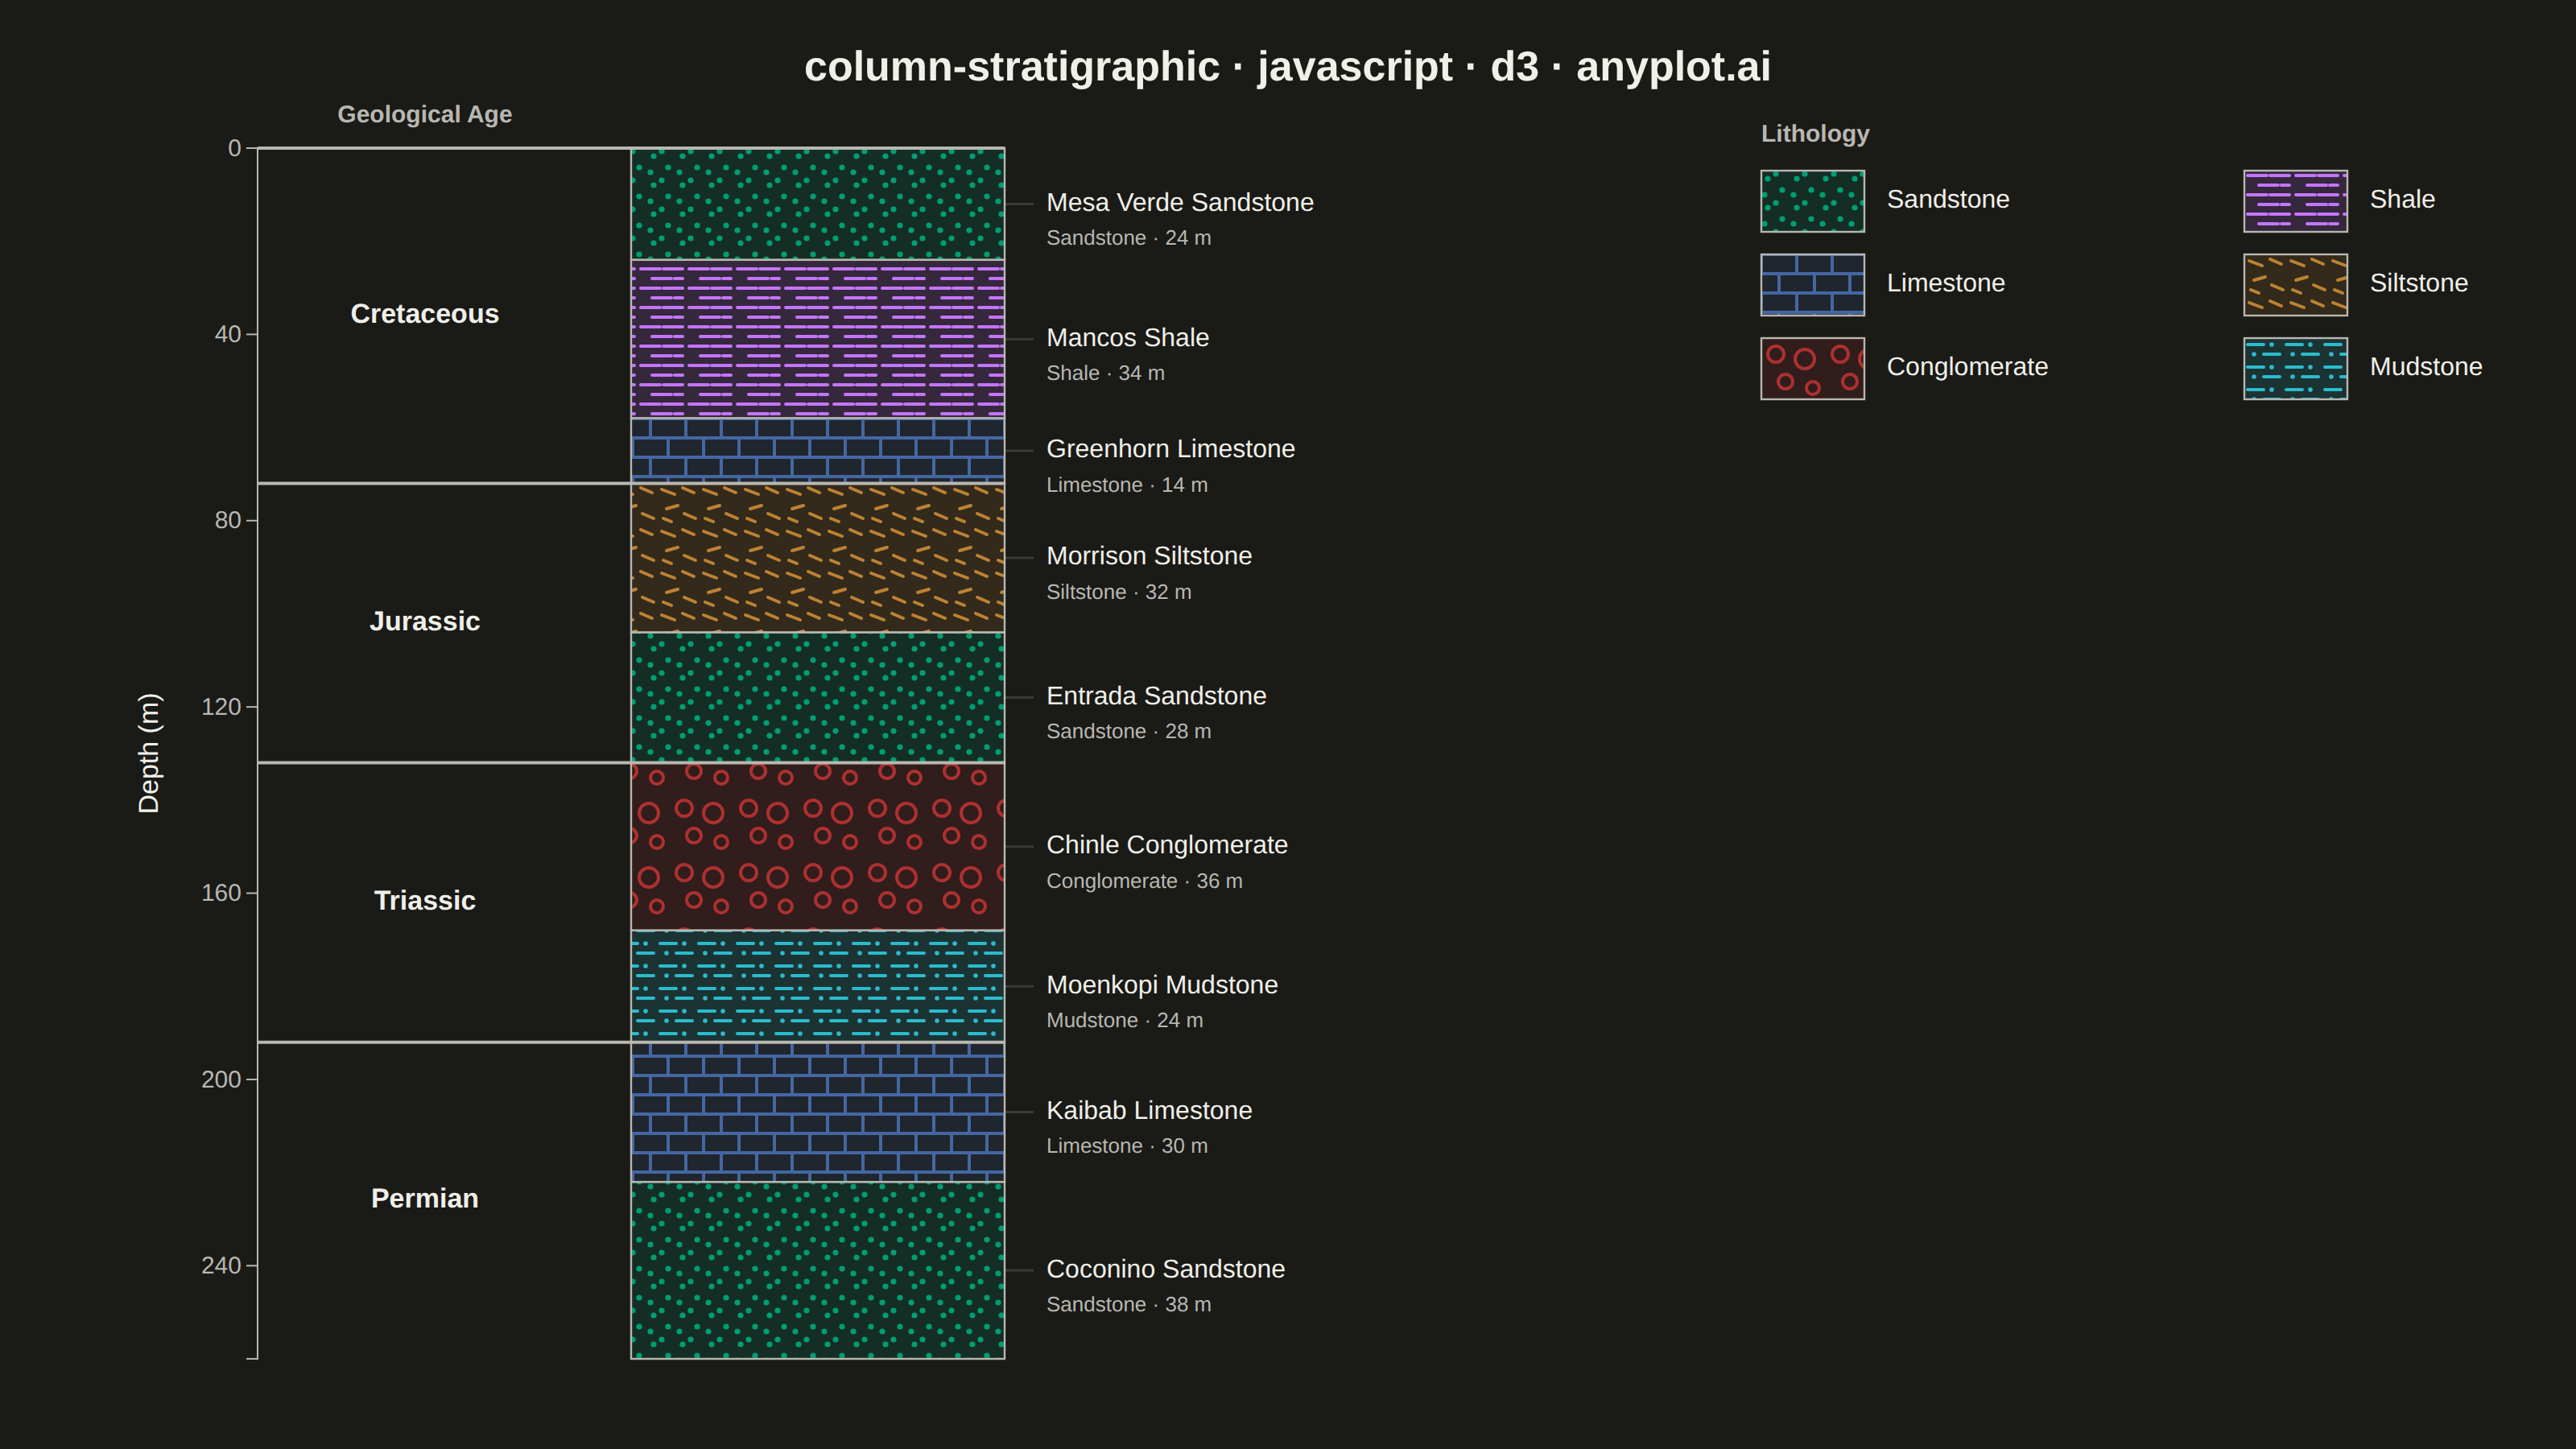
A vertical column visualization showing geological rock layers with standardized lithology patterns, formation names, ages, and thickness scales. Each layer is represented as a stacked rectangular block filled with a distinctive pattern (e.g., brick pattern for limestone, dots for sandstone, dashes for shale) following FGDC/USGS conventions. This plot is essential for communicating subsurface geology and sedimentary sequences in a compact, standardized format.
// anyplot.ai
// column-stratigraphic: Stratigraphic Column with Lithology Patterns
// Library: d3 7.9.0 | JavaScript 22.22.3
// Quality: 91/100 | Created: 2026-06-17
//# anyplot-orientation: landscape

const t = window.ANYPLOT_TOKENS;
const { width, height } = window.ANYPLOT_SIZE;
const margin = { top: 92, right: 48, bottom: 56, left: 96 };
const iw = width - margin.left - margin.right;
const ih = height - margin.top - margin.bottom;

// --- Data: synthetic sedimentary section, depth increasing downward ---------
// Imprint palette is assigned per lithology; the fill PATTERN is the primary
// (redundant) encoding so the section reads even in grayscale.
const lithologies = {
  Sandstone: { color: t.palette[0] }, // brand green — first categorical series
  Shale: { color: t.palette[1] },
  Limestone: { color: t.palette[2] },
  Siltstone: { color: t.palette[3] },
  Conglomerate: { color: t.palette[4] },
  Mudstone: { color: t.palette[5] },
};

const layers = [
  { top: 0, bottom: 24, lithology: "Sandstone", formation: "Mesa Verde Sandstone", age: "Cretaceous" },
  { top: 24, bottom: 58, lithology: "Shale", formation: "Mancos Shale", age: "Cretaceous" },
  { top: 58, bottom: 72, lithology: "Limestone", formation: "Greenhorn Limestone", age: "Cretaceous" },
  { top: 72, bottom: 104, lithology: "Siltstone", formation: "Morrison Siltstone", age: "Jurassic" },
  { top: 104, bottom: 132, lithology: "Sandstone", formation: "Entrada Sandstone", age: "Jurassic" },
  { top: 132, bottom: 168, lithology: "Conglomerate", formation: "Chinle Conglomerate", age: "Triassic" },
  { top: 168, bottom: 192, lithology: "Mudstone", formation: "Moenkopi Mudstone", age: "Triassic" },
  { top: 192, bottom: 222, lithology: "Limestone", formation: "Kaibab Limestone", age: "Permian" },
  { top: 222, bottom: 260, lithology: "Sandstone", formation: "Coconino Sandstone", age: "Permian" },
];
const maxDepth = layers[layers.length - 1].bottom;

// --- Layout columns (x positions inside g) ----------------------------------
const axisX = 64; // depth axis line
const ageX = 168; // centre of the age/period band
const colLeft = 296;
const colWidth = 232;
const colRight = colLeft + colWidth;
const formX = colRight + 26; // formation labels begin here

// --- SVG mount --------------------------------------------------------------
const svg = d3.select("#container").append("svg").attr("width", width).attr("height", height);
const defs = svg.append("defs");
const g = svg.append("g").attr("transform", `translate(${margin.left},${margin.top})`);

// --- Depth scale (increases downward) ---------------------------------------
const y = d3.scaleLinear().domain([0, maxDepth]).range([0, ih]);

// --- Lithology fill patterns (approximate FGDC/USGS symbols) -----------------
// One <pattern> per lithology; the pattern strokes use the lithology colour so
// the encoding is identical between light and dark (only chrome flips).
function buildPattern(id, kind, color) {
  const sw = 2; // pattern stroke width
  if (kind === "Sandstone") {
    // stipple dots
    const p = defs.append("pattern").attr("id", id).attr("width", 18).attr("height", 18).attr("patternUnits", "userSpaceOnUse");
    [[4, 5], [13, 12], [9, 2], [2, 15]].forEach(([cx, cy]) =>
      p.append("circle").attr("cx", cx).attr("cy", cy).attr("r", 1.8).attr("fill", color)
    );
  } else if (kind === "Shale") {
    // fine horizontal dashes
    const p = defs.append("pattern").attr("id", id).attr("width", 30).attr("height", 12).attr("patternUnits", "userSpaceOnUse");
    [[2, 3, 12], [16, 3, 12], [9, 9, 12], [23, 9, 5]].forEach(([x0, yy, len]) =>
      p.append("line").attr("x1", x0).attr("y1", yy).attr("x2", x0 + len).attr("y2", yy).attr("stroke", color).attr("stroke-width", sw).attr("stroke-linecap", "round")
    );
  } else if (kind === "Limestone") {
    // brick pattern
    const p = defs.append("pattern").attr("id", id).attr("width", 44).attr("height", 24).attr("patternUnits", "userSpaceOnUse");
    p.append("path")
      .attr("d", "M0,0 H44 M0,12 H44 M0,24 H44 M0,0 V12 M22,0 V12 M44,0 V12 M11,12 V24 M33,12 V24")
      .attr("stroke", color).attr("stroke-width", sw).attr("fill", "none");
  } else if (kind === "Siltstone") {
    // mixed short dashes (random-look, fixed)
    const p = defs.append("pattern").attr("id", id).attr("width", 26).attr("height", 26).attr("patternUnits", "userSpaceOnUse");
    [[3, 4, 11, 7], [16, 3, 23, 6], [6, 16, 13, 14], [17, 19, 24, 22], [4, 22, 9, 24]].forEach(([x1, y1, x2, y2]) =>
      p.append("line").attr("x1", x1).attr("y1", y1).attr("x2", x2).attr("y2", y2).attr("stroke", color).attr("stroke-width", sw).attr("stroke-linecap", "round")
    );
  } else if (kind === "Conglomerate") {
    // pebbles of varied size
    const p = defs.append("pattern").attr("id", id).attr("width", 40).attr("height", 40).attr("patternUnits", "userSpaceOnUse");
    [[9, 10, 5], [27, 13, 6], [15, 27, 4.5], [32, 31, 4]].forEach(([cx, cy, r]) =>
      p.append("circle").attr("cx", cx).attr("cy", cy).attr("r", r).attr("fill", "none").attr("stroke", color).attr("stroke-width", sw)
    );
  } else if (kind === "Mudstone") {
    // dash-dot horizontal
    const p = defs.append("pattern").attr("id", id).attr("width", 24).attr("height", 14).attr("patternUnits", "userSpaceOnUse");
    p.append("line").attr("x1", 2).attr("y1", 4).attr("x2", 12).attr("y2", 4).attr("stroke", color).attr("stroke-width", sw).attr("stroke-linecap", "round");
    p.append("circle").attr("cx", 17).attr("cy", 4).attr("r", 1.4).attr("fill", color);
    p.append("line").attr("x1", 12).attr("y1", 10).attr("x2", 22).attr("y2", 10).attr("stroke", color).attr("stroke-width", sw).attr("stroke-linecap", "round");
    p.append("circle").attr("cx", 6).attr("cy", 10).attr("r", 1.4).attr("fill", color);
  }
}
Object.entries(lithologies).forEach(([name, def]) => buildPattern(`pat-${name}`, name, def.color));

// --- A filled lithology box: colour tint base + pattern overlay + ink outline
function drawLithoBox(parent, x, yy, w, h, name) {
  const color = lithologies[name].color;
  parent.append("rect").attr("x", x).attr("y", yy).attr("width", w).attr("height", h).attr("fill", color).attr("opacity", 0.16);
  parent.append("rect").attr("x", x).attr("y", yy).attr("width", w).attr("height", h).attr("fill", `url(#pat-${name})`);
  parent.append("rect").attr("x", x).attr("y", yy).attr("width", w).attr("height", h).attr("fill", "none").attr("stroke", t.inkSoft).attr("stroke-width", 1.2);
}

// --- Lithology column -------------------------------------------------------
layers.forEach((d) => {
  drawLithoBox(g, colLeft, y(d.top), colWidth, y(d.bottom) - y(d.top), d.lithology);
});

// --- Depth axis (meters, increasing downward) -------------------------------
const depthAxis = g.append("g").attr("transform", `translate(${axisX},0)`).call(d3.axisLeft(y).tickValues(d3.range(0, maxDepth + 1, 40)).tickSize(7));
depthAxis.selectAll("text").attr("fill", t.inkSoft).style("font-size", "15px");
depthAxis.selectAll("line").attr("stroke", t.inkSoft);
depthAxis.select(".domain").attr("stroke", t.inkSoft);
g.append("text").attr("transform", "rotate(-90)").attr("x", -ih / 2).attr("y", axisX - 62)
  .attr("text-anchor", "middle").attr("fill", t.ink).style("font-size", "17px").text("Depth (m)");

// --- Age / period band (merge consecutive layers of the same age) -----------
const periods = d3.groups(layers, (d) => d.age).map(([age, rows]) => ({
  age,
  top: d3.min(rows, (r) => r.top),
  bottom: d3.max(rows, (r) => r.bottom),
}));
periods.forEach((p) => {
  // boundary rule across the whole strip at each period change
  g.append("line").attr("x1", axisX).attr("x2", colRight).attr("y1", y(p.top)).attr("y2", y(p.top))
    .attr("stroke", t.inkSoft).attr("stroke-width", 2);
  g.append("text").attr("x", ageX).attr("y", (y(p.top) + y(p.bottom)) / 2)
    .attr("text-anchor", "middle").attr("dominant-baseline", "middle")
    .attr("fill", t.ink).style("font-size", "17px").style("font-weight", "600").text(p.age);
});
g.append("text").attr("x", ageX).attr("y", -16).attr("text-anchor", "middle")
  .attr("fill", t.inkSoft).style("font-size", "15px").style("font-weight", "600").text("Geological Age");

// --- Formation labels with leader lines -------------------------------------
layers.forEach((d) => {
  const midY = (y(d.top) + y(d.bottom)) / 2;
  g.append("line").attr("x1", colRight).attr("x2", formX - 8).attr("y1", midY).attr("y2", midY)
    .attr("stroke", t.grid).attr("stroke-width", 1.5);
  g.append("text").attr("x", formX).attr("y", midY).attr("dominant-baseline", "middle")
    .attr("fill", t.ink).style("font-size", "16px").text(d.formation);
  g.append("text").attr("x", formX).attr("y", midY + 22).attr("dominant-baseline", "middle")
    .attr("fill", t.inkSoft).style("font-size", "13px").text(`${d.lithology} · ${d.bottom - d.top} m`);
});

// --- Lithology legend (top-right) -------------------------------------------
const legendNames = Object.keys(lithologies);
const legCols = 2;
const legColW = 300;
const swW = 64;
const swH = 38;
const rowH = 52;
const legX = colRight + 470;
const legY = 6;
const legend = g.append("g").attr("transform", `translate(${legX},${legY})`);
legend.append("text").attr("x", 0).attr("y", -10).attr("fill", t.inkSoft)
  .style("font-size", "15px").style("font-weight", "600").text("Lithology");
legendNames.forEach((name, i) => {
  const cx = (i % legCols) * legColW;
  const cy = Math.floor(i / legCols) * rowH + 8;
  const cell = legend.append("g").attr("transform", `translate(${cx},${cy})`);
  drawLithoBox(cell, 0, 0, swW, swH, name);
  cell.append("text").attr("x", swW + 14).attr("y", swH / 2).attr("dominant-baseline", "middle")
    .attr("fill", t.ink).style("font-size", "16px").text(name);
});

// --- Title ------------------------------------------------------------------
svg.append("text").attr("x", width / 2).attr("y", 50).attr("text-anchor", "middle")
  .attr("fill", t.ink).style("font-size", "26px").style("font-weight", "600")
  .text("column-stratigraphic · javascript · d3 · anyplot.ai");
Runnable source as JSON, for any HTTP client: https://api.anyplot.ai/specs/column-stratigraphic/d3/code. Any spec id and library id listed in llms-full.txt fit the same URL shape; every URL below is complete and callable.
{
  "spec_id": "column-stratigraphic",
  "language": "javascript",
  "library": "d3",
  "page": "https://anyplot.ai/column-stratigraphic/javascript/d3",
  "hub": "https://anyplot.ai/column-stratigraphic",
  "code_json": "https://api.anyplot.ai/specs/column-stratigraphic/d3/code",
  "spec_json": "https://api.anyplot.ai/specs/column-stratigraphic",
  "render_light_png": "https://storage.googleapis.com/anyplot-images/plots/column-stratigraphic/javascript/d3/plot-light.png",
  "render_dark_png": "https://storage.googleapis.com/anyplot-images/plots/column-stratigraphic/javascript/d3/plot-dark.png",
  "interactive_light_html": "https://storage.googleapis.com/anyplot-images/plots/column-stratigraphic/javascript/d3/plot-light.html",
  "interactive_dark_html": "https://storage.googleapis.com/anyplot-images/plots/column-stratigraphic/javascript/d3/plot-dark.html",
  "quality_score": 91.0,
  "license": "MIT",
  "guide": "https://anyplot.ai/llms.txt"
}
Part of Stratigraphic Column with Lithology Patterns on anyplot.ai.