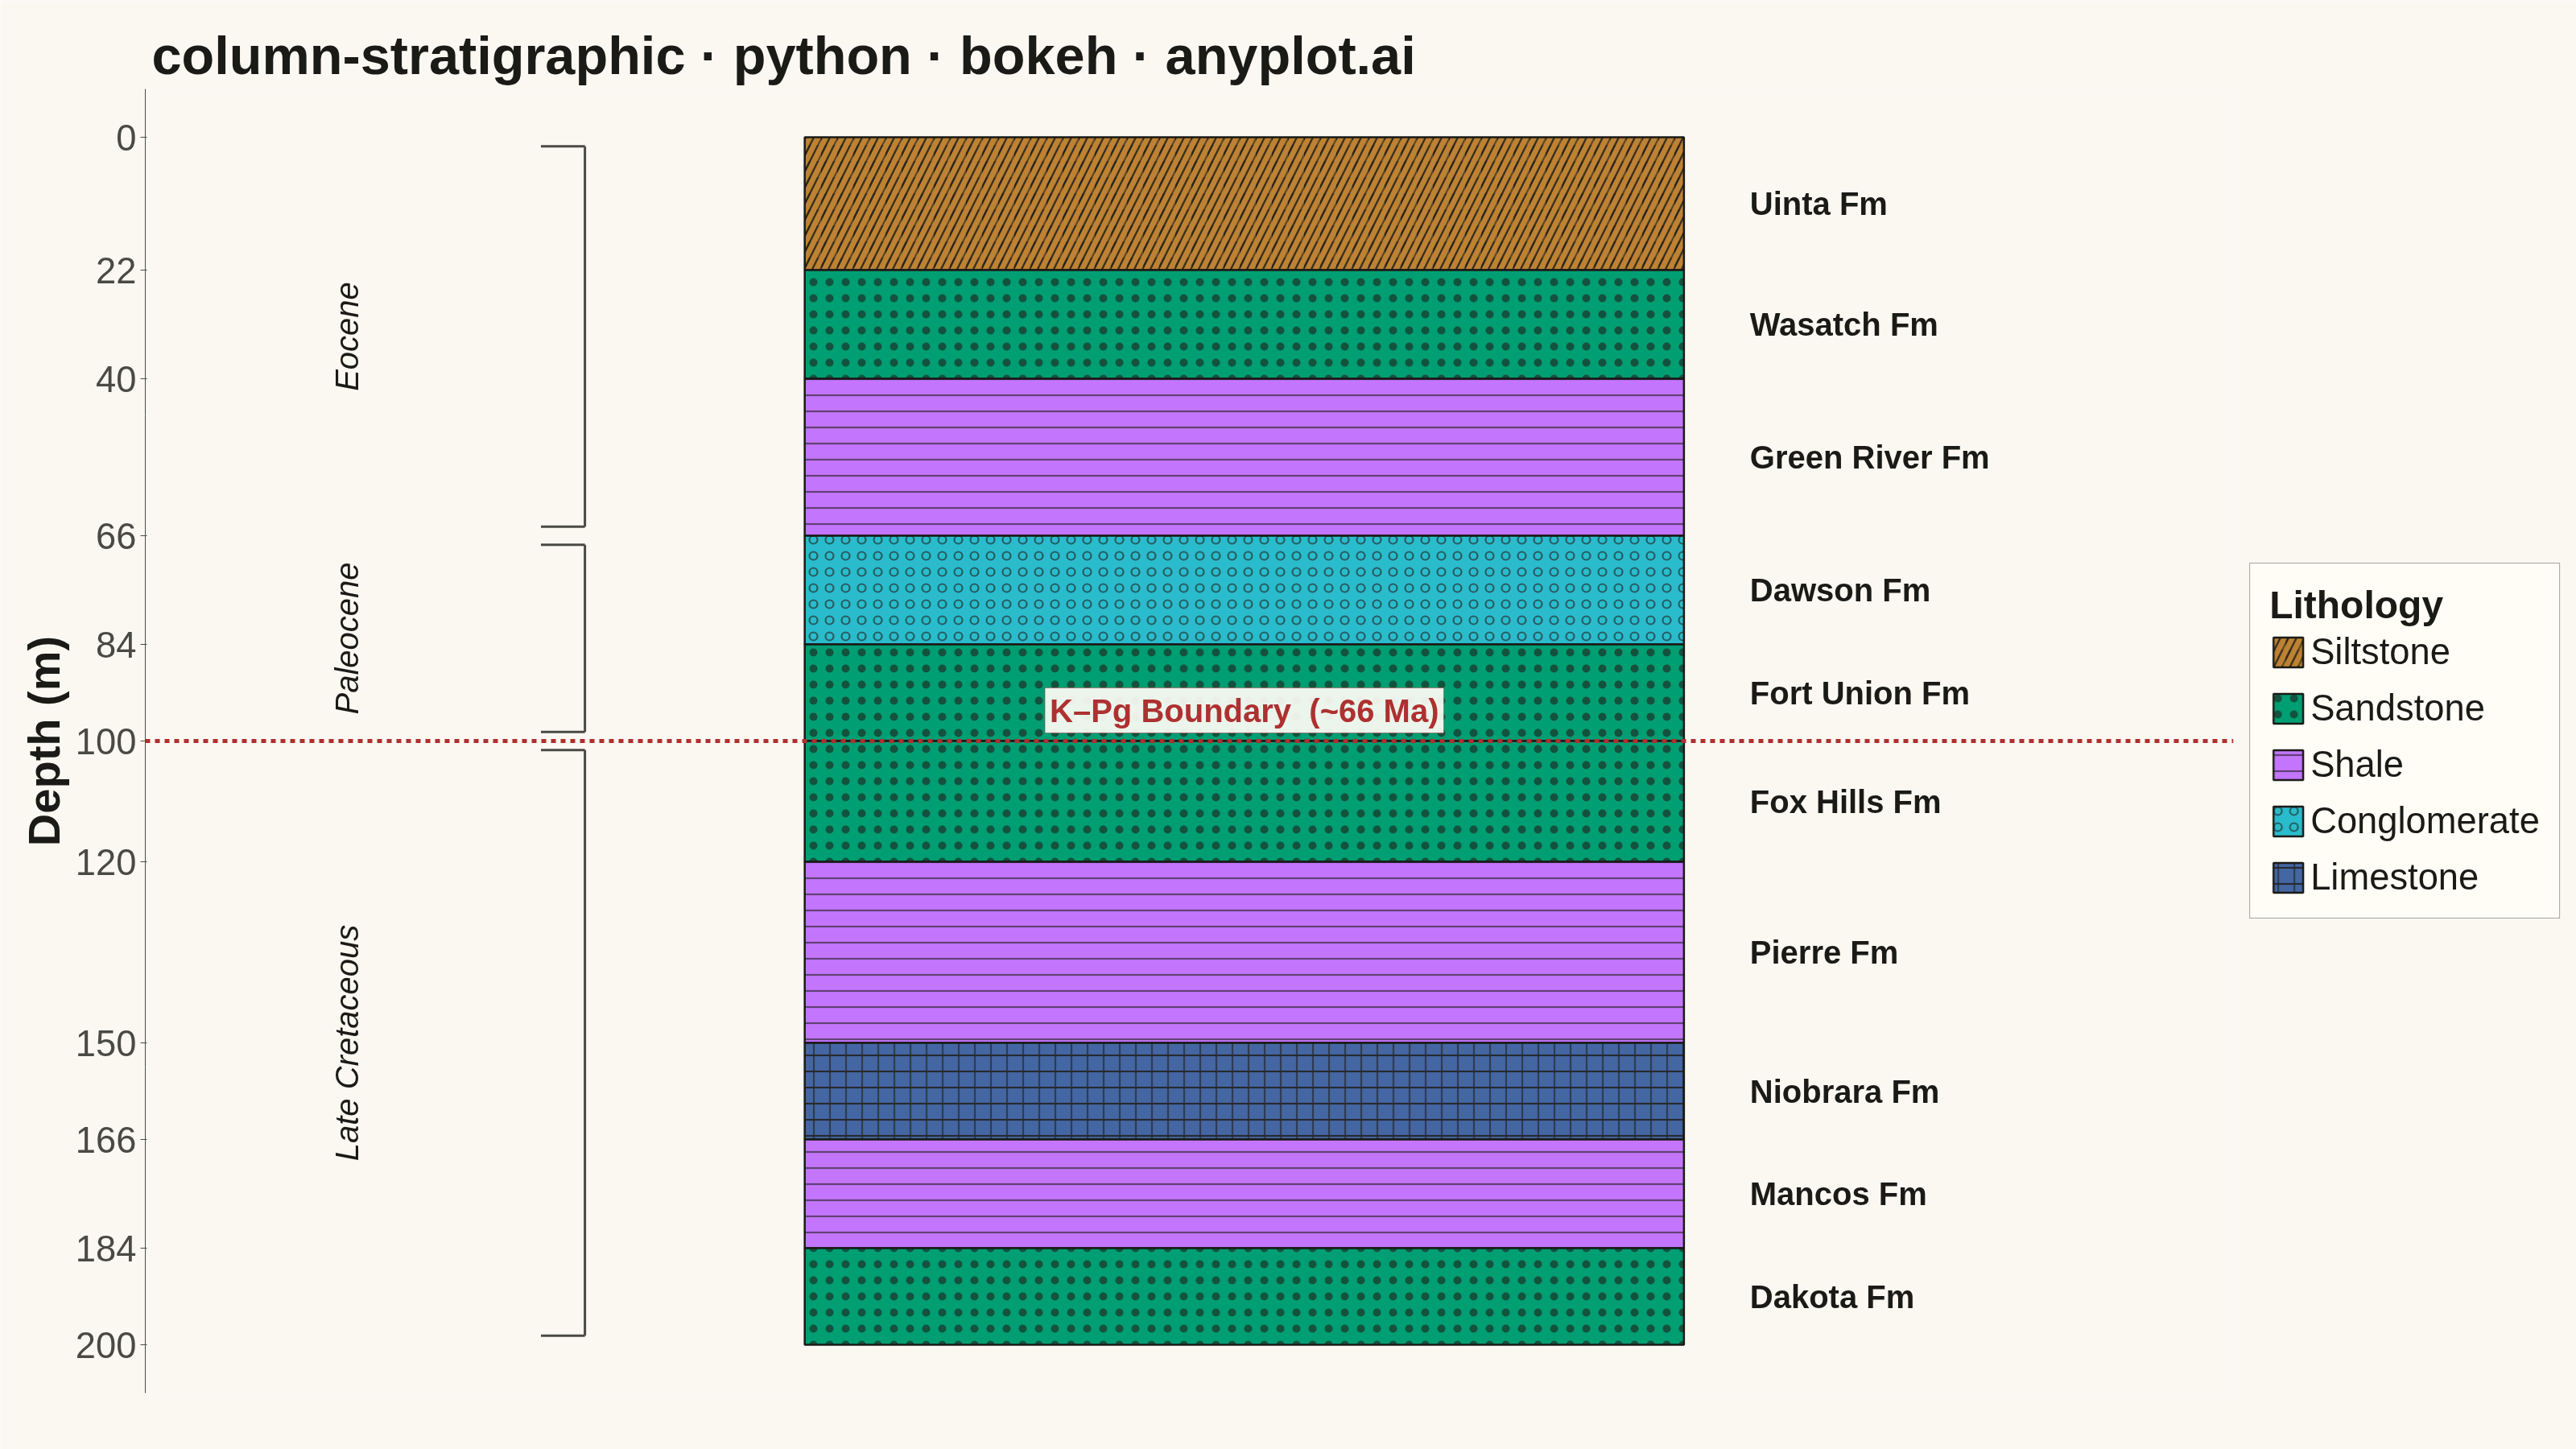
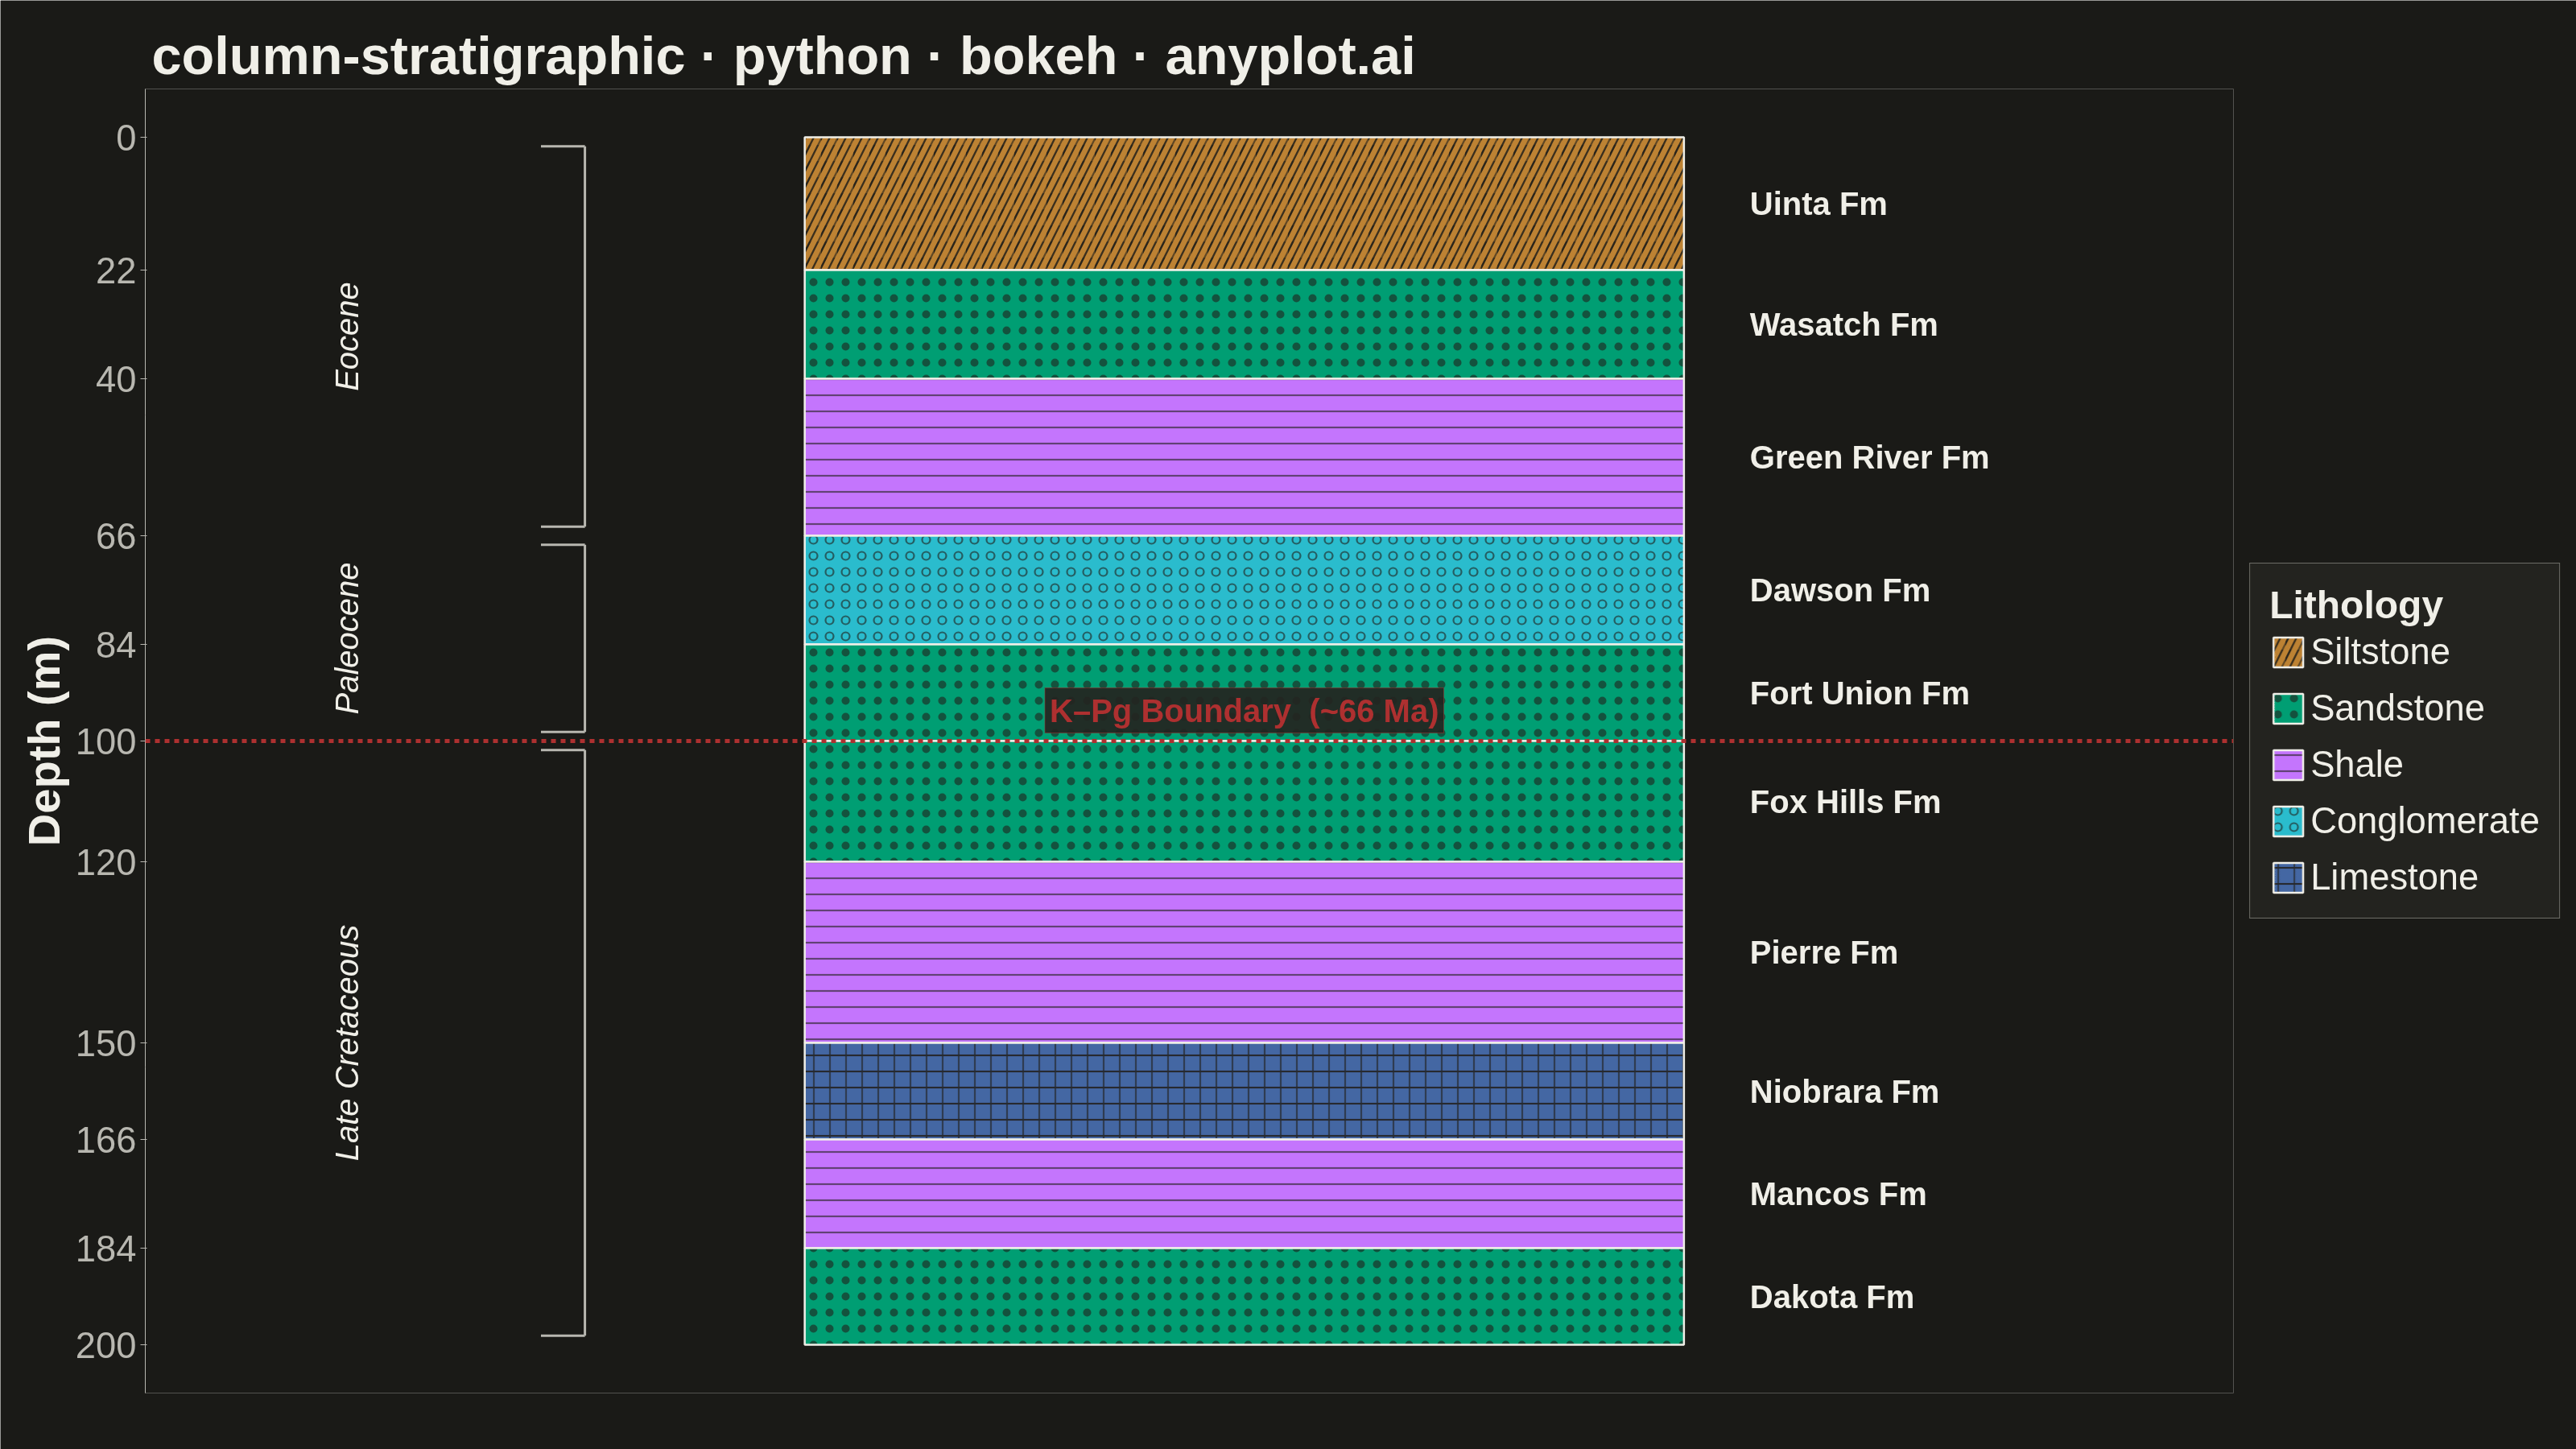
A vertical column visualization showing geological rock layers with standardized lithology patterns, formation names, ages, and thickness scales. Each layer is represented as a stacked rectangular block filled with a distinctive pattern (e.g., brick pattern for limestone, dots for sandstone, dashes for shale) following FGDC/USGS conventions. This plot is essential for communicating subsurface geology and sedimentary sequences in a compact, standardized format.
""" anyplot.ai
column-stratigraphic: Stratigraphic Column with Lithology Patterns
Library: bokeh 3.9.1 | Python 3.13.13
Quality: 94/100 | Updated: 2026-06-17
"""

import math
import os
import sys


# Prevent self-import: this file is named bokeh.py, which shadows the installed
# bokeh package when its directory sits at the front of sys.path.
_this_dir = os.path.dirname(os.path.abspath(__file__))
sys.path = [p for p in sys.path if os.path.abspath(p or ".") != _this_dir]

import time
from pathlib import Path

from bokeh.io import output_file, save
from bokeh.models import ColumnDataSource, FixedTicker, HoverTool, Label, Legend, LegendItem, Range1d, Span
from bokeh.plotting import figure
from selenium import webdriver
from selenium.webdriver.chrome.options import Options


# Theme-adaptive chrome (see prompts/default-style-guide.md "Theme-adaptive Chrome")
THEME = os.getenv("ANYPLOT_THEME", "light")
PAGE_BG = "#FAF8F1" if THEME == "light" else "#1A1A17"
ELEVATED_BG = "#FFFDF6" if THEME == "light" else "#242420"
INK = "#1A1A17" if THEME == "light" else "#F0EFE8"
INK_SOFT = "#4A4A44" if THEME == "light" else "#B8B7B0"

# Imprint palette — data colors stay identical across light/dark themes
IMPRINT_RED = "#AE3030"  # semantic anchor — K-Pg extinction event marker

# Data: synthetic borehole section, depth increasing downward (law of
# superposition — youngest beds on top, oldest at depth). Ages run from
# Eocene (shallow) down through Paleocene to Late Cretaceous (deep).
layers = [
    {"top": 0, "bottom": 22, "lithology": "Siltstone", "formation": "Uinta Fm", "age": "Eocene"},
    {"top": 22, "bottom": 40, "lithology": "Sandstone", "formation": "Wasatch Fm", "age": "Eocene"},
    {"top": 40, "bottom": 66, "lithology": "Shale", "formation": "Green River Fm", "age": "Eocene"},
    {"top": 66, "bottom": 84, "lithology": "Conglomerate", "formation": "Dawson Fm", "age": "Paleocene"},
    {"top": 84, "bottom": 100, "lithology": "Sandstone", "formation": "Fort Union Fm", "age": "Paleocene"},
    {"top": 100, "bottom": 120, "lithology": "Sandstone", "formation": "Fox Hills Fm", "age": "Late Cretaceous"},
    {"top": 120, "bottom": 150, "lithology": "Shale", "formation": "Pierre Fm", "age": "Late Cretaceous"},
    {"top": 150, "bottom": 166, "lithology": "Limestone", "formation": "Niobrara Fm", "age": "Late Cretaceous"},
    {"top": 166, "bottom": 184, "lithology": "Shale", "formation": "Mancos Fm", "age": "Late Cretaceous"},
    {"top": 184, "bottom": 200, "lithology": "Sandstone", "formation": "Dakota Fm", "age": "Late Cretaceous"},
]

# Lithology styling: Imprint colors (constant) + FGDC-style hatch for a
# redundant, colorblind-safe encoding (stipple=sandstone, dashes=shale, etc.)
lithology_styles = {
    "Sandstone": {"color": "#009E73", "hatch_pattern": "."},  # Imprint 1 (brand — first series)
    "Shale": {"color": "#C475FD", "hatch_pattern": "-"},  # Imprint 2
    "Limestone": {"color": "#4467A3", "hatch_pattern": "+"},  # Imprint 3
    "Siltstone": {"color": "#BD8233", "hatch_pattern": "/"},  # Imprint 4
    "Conglomerate": {"color": "#2ABCCD", "hatch_pattern": "o"},  # Imprint 6
}
HATCH_INK = "#211F1A"  # dark hatch reads on every (constant) Imprint fill

# K-Pg boundary: contact between Paleocene (above) and Late Cretaceous (below)
KPG_DEPTH = 100

# Column geometry
COL_LEFT, COL_RIGHT = 0.0, 2.4
col_center = (COL_LEFT + COL_RIGHT) / 2

# Plot
title = "column-stratigraphic · python · bokeh · anyplot.ai"
p = figure(
    width=3200,
    height=1800,
    title=title,
    y_axis_label="Depth (m)",
    toolbar_location=None,
    x_range=Range1d(-1.8, 3.9),
    y_range=Range1d(208, -8),
    min_border_left=180,
    min_border_top=110,
    min_border_bottom=70,
    min_border_right=40,
)

# Draw each layer as a depth interval with its lithology pattern
legend_renderers = {}
for layer in layers:
    style = lithology_styles[layer["lithology"]]
    source = ColumnDataSource(
        data={
            "left": [COL_LEFT],
            "right": [COL_RIGHT],
            "top": [layer["top"]],
            "bottom": [layer["bottom"]],
            "lithology": [layer["lithology"]],
            "formation": [layer["formation"]],
            "age": [layer["age"]],
            "top_depth": [layer["top"]],
            "bottom_depth": [layer["bottom"]],
            "thickness": [layer["bottom"] - layer["top"]],
        }
    )

    renderer = p.quad(
        left="left",
        right="right",
        top="top",
        bottom="bottom",
        source=source,
        fill_color=style["color"],
        line_color=INK,
        line_width=2.5,
        hatch_pattern=style["hatch_pattern"],
        hatch_color=HATCH_INK,
        hatch_alpha=0.6,
        hatch_scale=20,
        hatch_weight=2.2,
    )

    legend_renderers.setdefault(layer["lithology"], renderer)

    p.add_tools(
        HoverTool(
            renderers=[renderer],
            tooltips=[
                ("Lithology", "@lithology"),
                ("Formation", "@formation"),
                ("Age", "@age"),
                ("Top", "@top_depth{0.0} m"),
                ("Bottom", "@bottom_depth{0.0} m"),
                ("Thickness", "@thickness{0.0} m"),
            ],
        )
    )

# Formation labels — to the right of the column
for layer in layers:
    p.add_layout(
        Label(
            x=COL_RIGHT + 0.18,
            y=(layer["top"] + layer["bottom"]) / 2,
            text=layer["formation"],
            text_font_size="30pt",
            text_font_style="bold",
            text_align="left",
            text_baseline="middle",
            text_color=INK,
        )
    )

# Geological age brackets on the left — rotated period names + bracket lines
age_groups = {}
for layer in layers:
    bounds = age_groups.setdefault(layer["age"], {"top": layer["top"], "bottom": layer["bottom"]})
    bounds["top"] = min(bounds["top"], layer["top"])
    bounds["bottom"] = max(bounds["bottom"], layer["bottom"])

bracket_x = -0.6
for age, bounds in age_groups.items():
    mid_y = (bounds["top"] + bounds["bottom"]) / 2
    p.add_layout(
        Label(
            x=-1.25,
            y=mid_y,
            text=age,
            text_font_size="30pt",
            text_font_style="italic",
            text_align="center",
            text_baseline="middle",
            text_color=INK,
            angle=math.pi / 2,
        )
    )
    p.line(x=[bracket_x, bracket_x], y=[bounds["top"] + 1.5, bounds["bottom"] - 1.5], line_color=INK_SOFT, line_width=3)
    for y in (bounds["top"] + 1.5, bounds["bottom"] - 1.5):
        p.line(x=[bracket_x - 0.12, bracket_x], y=[y, y], line_color=INK_SOFT, line_width=3)

# K-Pg boundary emphasis — dashed red rule + labelled event marker
p.add_layout(Span(location=KPG_DEPTH, dimension="width", line_color=IMPRINT_RED, line_width=5, line_dash="dashed"))
p.add_layout(
    Label(
        x=col_center,
        y=KPG_DEPTH,
        text="K–Pg Boundary  (~66 Ma)",
        text_font_size="30pt",
        text_font_style="bold",
        text_color=IMPRINT_RED,
        text_align="center",
        text_baseline="bottom",
        y_offset=10,
        background_fill_color=ELEVATED_BG,
        background_fill_alpha=0.92,
        border_line_color=IMPRINT_RED,
        border_line_alpha=0.5,
        padding=6,
    )
)

# Legend — lithology key on the right panel (fills the wide landscape canvas)
legend = Legend(
    items=[LegendItem(label=lith, renderers=[rend]) for lith, rend in legend_renderers.items()],
    title="Lithology",
    location="center",
    label_text_font_size="34pt",
    label_text_color=INK,
    title_text_font_size="36pt",
    title_text_font_style="bold",
    title_text_color=INK,
    glyph_height=46,
    glyph_width=46,
    spacing=18,
    padding=24,
    margin=20,
    background_fill_color=ELEVATED_BG,
    border_line_color=INK_SOFT,
)
p.add_layout(legend, "right")

# Typography + chrome
p.title.text_font_size = "50pt"
p.title.text_color = INK
p.title.offset = 8
p.yaxis.axis_label_text_font_size = "42pt"
p.yaxis.axis_label_text_font_style = "bold"
p.yaxis.axis_label_text_color = INK
p.yaxis.major_label_text_font_size = "34pt"
p.yaxis.major_label_text_color = INK_SOFT
p.yaxis.ticker = FixedTicker(ticks=sorted({lz["top"] for lz in layers} | {lz["bottom"] for lz in layers}))
p.yaxis.axis_line_color = INK_SOFT
p.yaxis.major_tick_line_color = INK_SOFT
p.yaxis.minor_tick_line_color = None

p.xaxis.visible = False
p.xgrid.grid_line_color = None
p.ygrid.grid_line_color = None
p.outline_line_color = None
p.background_fill_color = PAGE_BG
p.border_fill_color = PAGE_BG

# Save — interactive HTML, then screenshot it with headless Chrome
output_file(f"plot-{THEME}.html", title=title)
save(p)

W, H = 3200, 1800
opts = Options()
for arg in (
    "--headless=new",
    "--no-sandbox",
    "--disable-dev-shm-usage",
    "--disable-gpu",
    f"--window-size={W},{H}",
    "--hide-scrollbars",
):
    opts.add_argument(arg)
driver = webdriver.Chrome(options=opts)
# CDP override forces an exact W×H viewport regardless of outer window chrome
driver.execute_cdp_cmd(
    "Emulation.setDeviceMetricsOverride", {"width": W, "height": H, "deviceScaleFactor": 1, "mobile": False}
)
driver.get(f"file://{Path(f'plot-{THEME}.html').resolve()}")
time.sleep(3)
driver.save_screenshot(f"plot-{THEME}.png")
driver.quit()
Runnable source as JSON, for any HTTP client: https://api.anyplot.ai/specs/column-stratigraphic/bokeh/code. Any spec id and library id listed in llms-full.txt fit the same URL shape; every URL below is complete and callable.
{
  "spec_id": "column-stratigraphic",
  "language": "python",
  "library": "bokeh",
  "page": "https://anyplot.ai/column-stratigraphic/python/bokeh",
  "hub": "https://anyplot.ai/column-stratigraphic",
  "code_json": "https://api.anyplot.ai/specs/column-stratigraphic/bokeh/code",
  "spec_json": "https://api.anyplot.ai/specs/column-stratigraphic",
  "render_light_png": "https://storage.googleapis.com/anyplot-images/plots/column-stratigraphic/python/bokeh/plot-light.png",
  "render_dark_png": "https://storage.googleapis.com/anyplot-images/plots/column-stratigraphic/python/bokeh/plot-dark.png",
  "interactive_light_html": "https://storage.googleapis.com/anyplot-images/plots/column-stratigraphic/python/bokeh/plot-light.html",
  "interactive_dark_html": "https://storage.googleapis.com/anyplot-images/plots/column-stratigraphic/python/bokeh/plot-dark.html",
  "quality_score": 94.0,
  "license": "MIT",
  "guide": "https://anyplot.ai/llms.txt"
}
Part of Stratigraphic Column with Lithology Patterns on anyplot.ai.