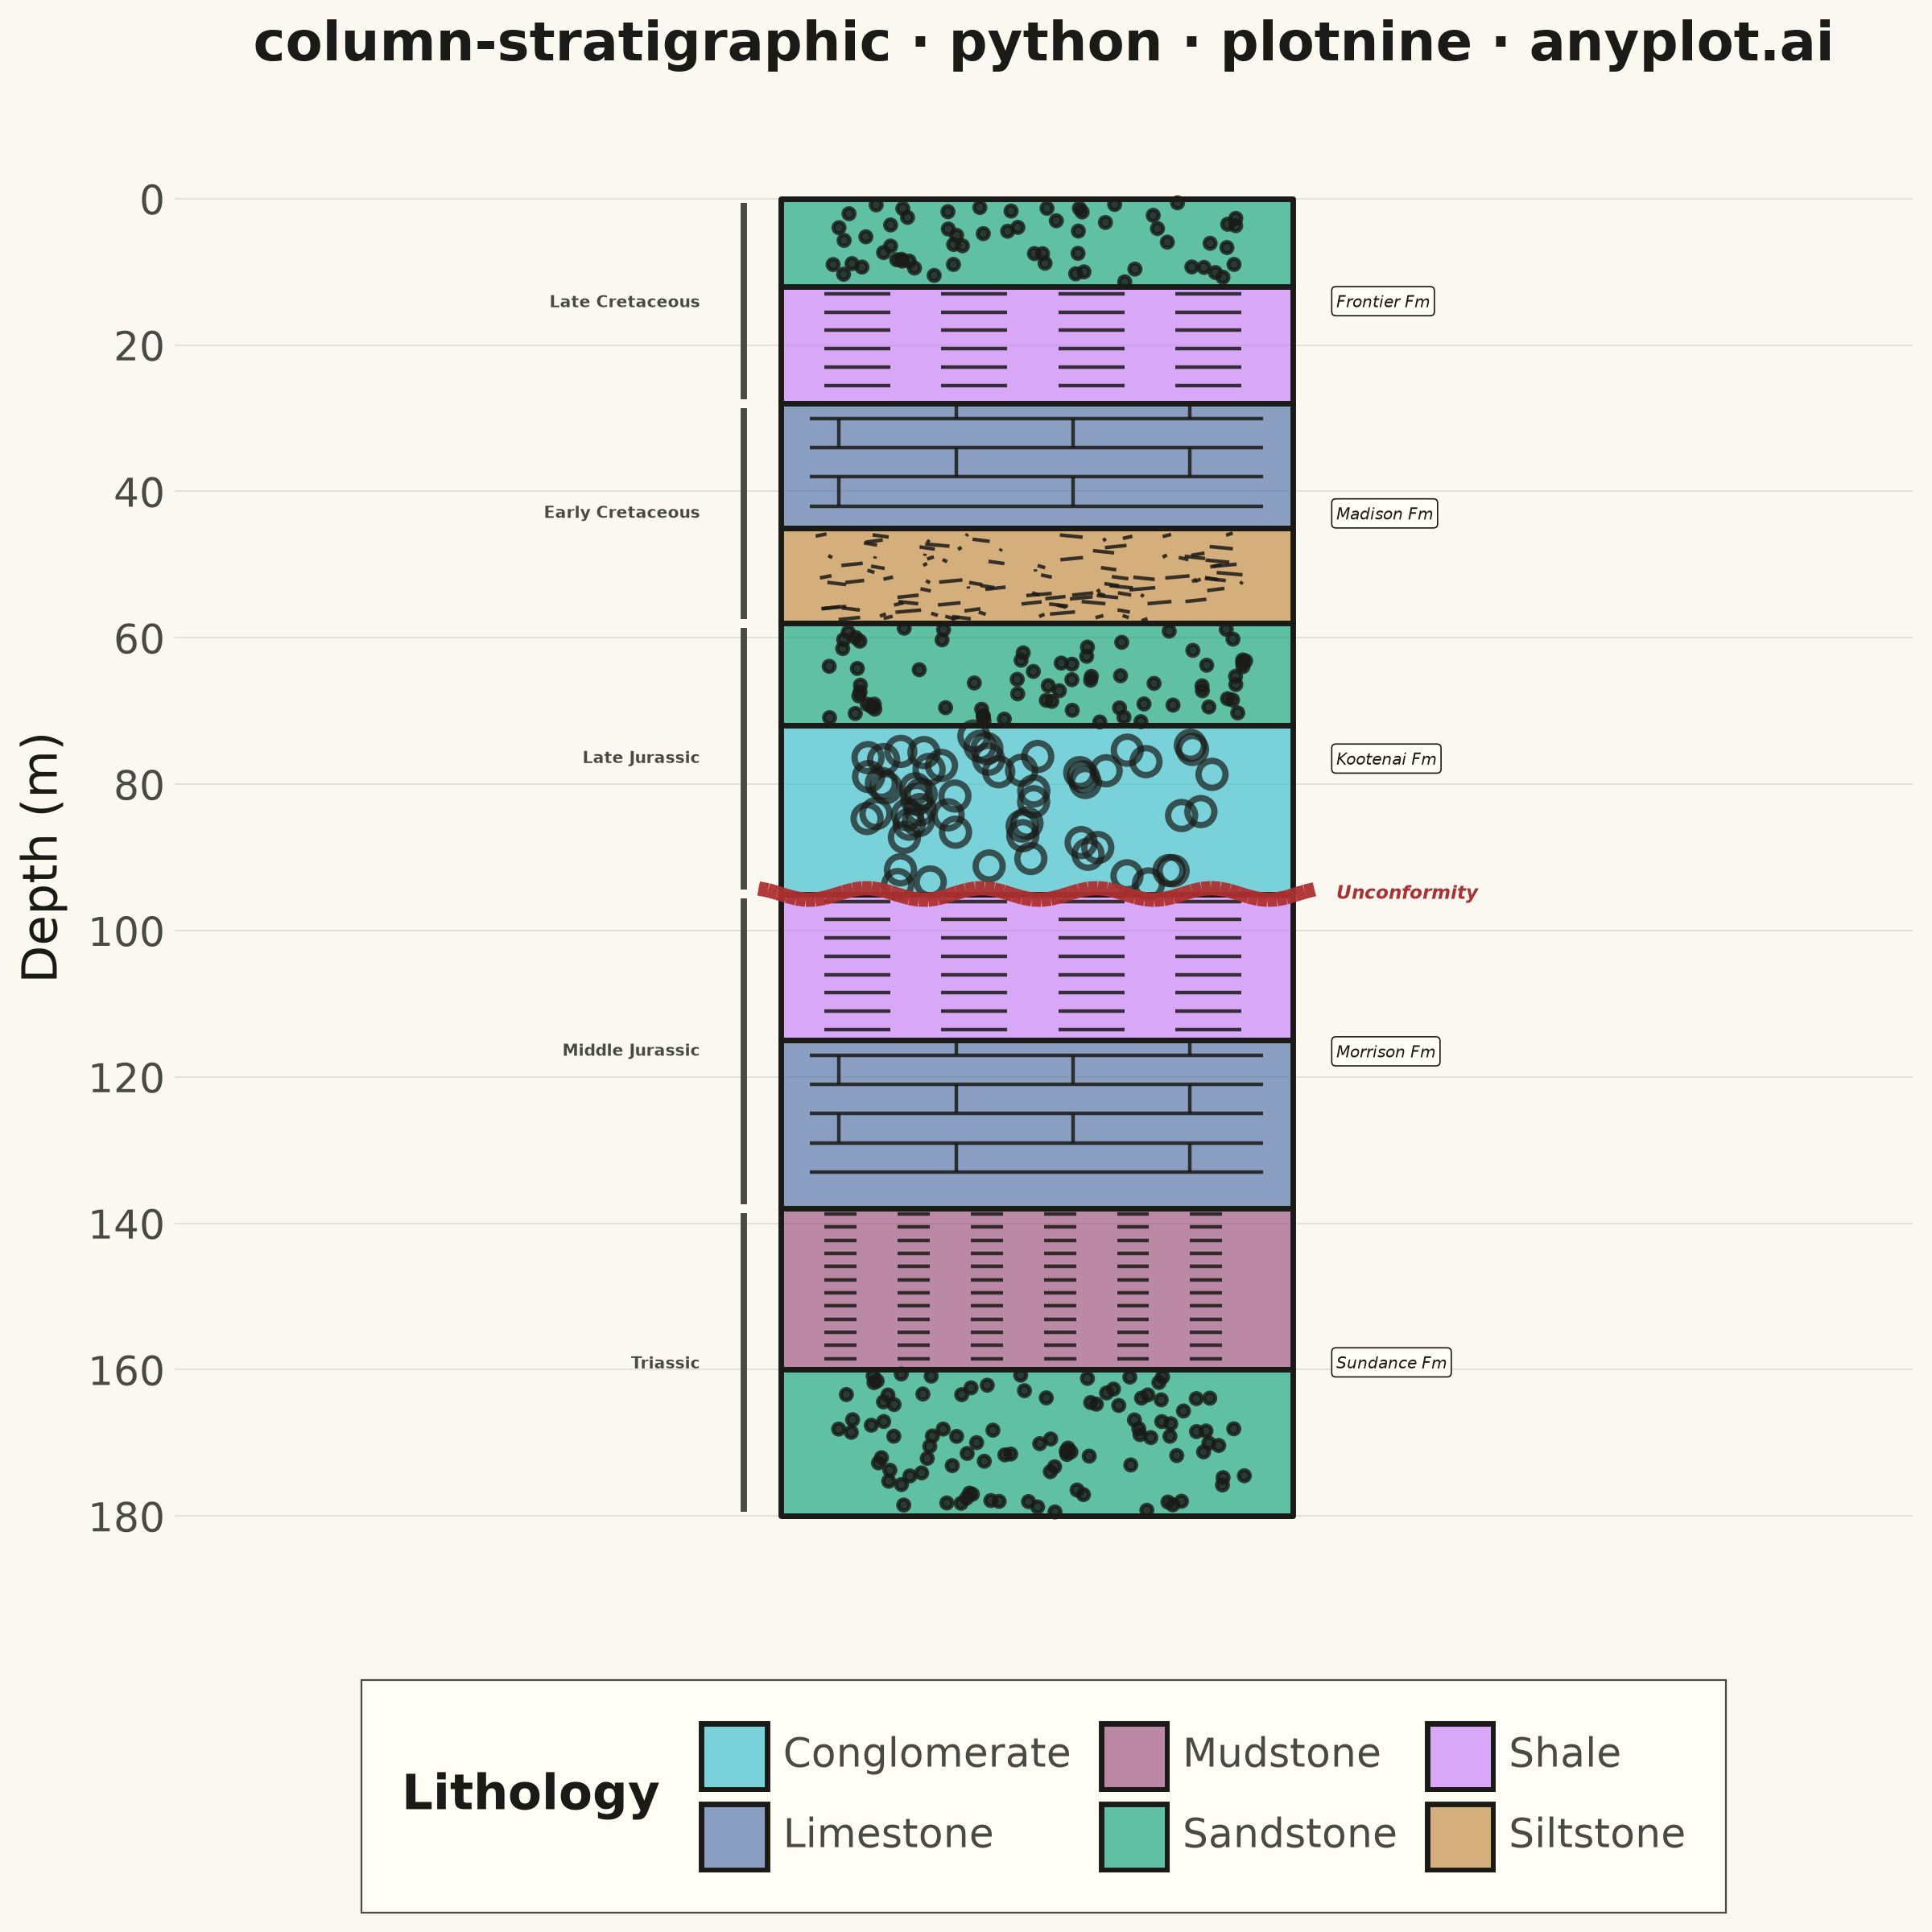
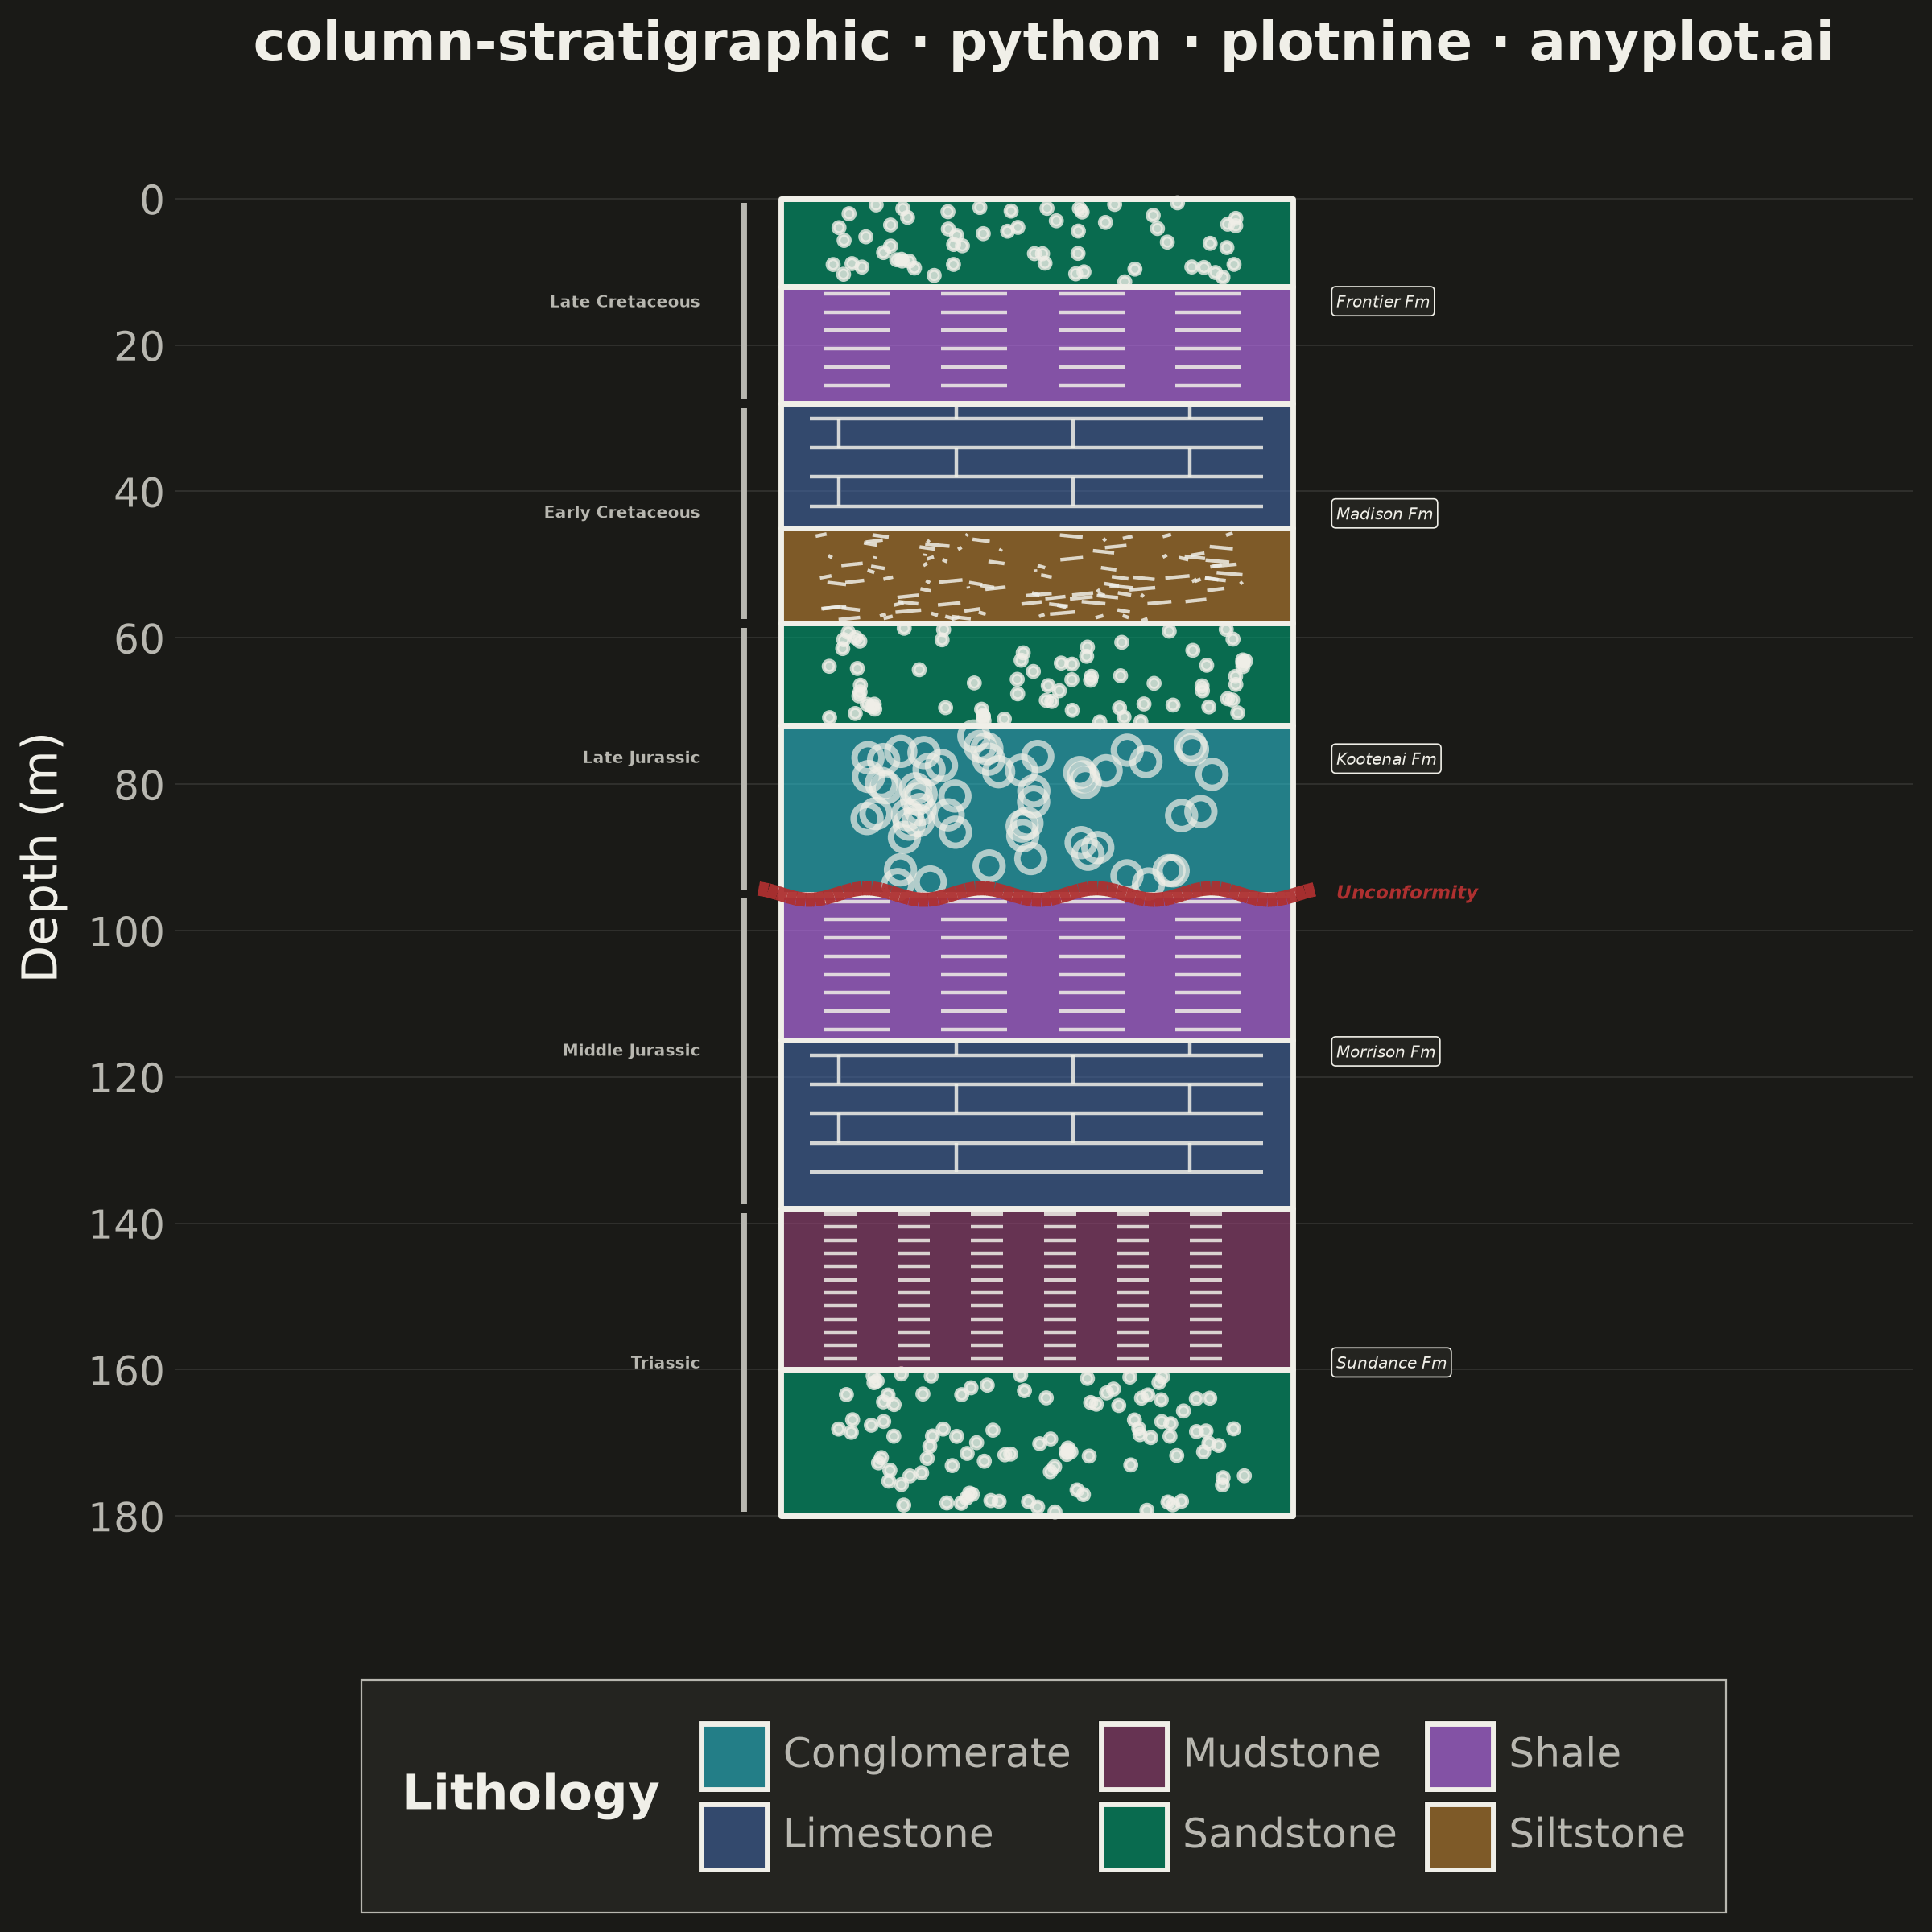
A vertical column visualization showing geological rock layers with standardized lithology patterns, formation names, ages, and thickness scales. Each layer is represented as a stacked rectangular block filled with a distinctive pattern (e.g., brick pattern for limestone, dots for sandstone, dashes for shale) following FGDC/USGS conventions. This plot is essential for communicating subsurface geology and sedimentary sequences in a compact, standardized format.
""" anyplot.ai
column-stratigraphic: Stratigraphic Column with Lithology Patterns
Library: plotnine 0.15.7 | Python 3.13.13
Quality: 94/100 | Updated: 2026-06-17
"""

import os

import numpy as np
import pandas as pd
from plotnine import (
    aes,
    annotate,
    coord_cartesian,
    element_blank,
    element_line,
    element_rect,
    element_text,
    geom_label,
    geom_linerange,
    geom_point,
    geom_segment,
    geom_text,
    geom_tile,
    ggplot,
    guide_legend,
    guides,
    labs,
    scale_fill_manual,
    scale_x_continuous,
    scale_y_continuous,
    theme,
    theme_minimal,
)


# Theme tokens (see prompts/default-style-guide.md "Theme-adaptive Chrome")
THEME = os.getenv("ANYPLOT_THEME", "light")
PAGE_BG = "#FAF8F1" if THEME == "light" else "#1A1A17"
ELEVATED_BG = "#FFFDF6" if THEME == "light" else "#242420"
INK = "#1A1A17" if THEME == "light" else "#F0EFE8"
INK_SOFT = "#4A4A44" if THEME == "light" else "#B8B7B0"

# Data - synthetic sedimentary borehole section (Western US)
layers = pd.DataFrame(
    {
        "top": [0, 12, 28, 45, 58, 72, 95, 115, 138, 160],
        "bottom": [12, 28, 45, 58, 72, 95, 115, 138, 160, 180],
        "lithology": [
            "Sandstone",
            "Shale",
            "Limestone",
            "Siltstone",
            "Sandstone",
            "Conglomerate",
            "Shale",
            "Limestone",
            "Mudstone",
            "Sandstone",
        ],
        "formation": [
            "Frontier Fm",
            "Frontier Fm",
            "Madison Fm",
            "Madison Fm",
            "Kootenai Fm",
            "Kootenai Fm",
            "Morrison Fm",
            "Morrison Fm",
            "Sundance Fm",
            "Sundance Fm",
        ],
        "age": [
            "Late Cretaceous",
            "Late Cretaceous",
            "Early Cretaceous",
            "Early Cretaceous",
            "Late Jurassic",
            "Late Jurassic",
            "Middle Jurassic",
            "Middle Jurassic",
            "Triassic",
            "Triassic",
        ],
    }
)

# Derived columns for grammar-of-graphics mapping
layers["mid"] = (layers["top"] + layers["bottom"]) / 2
layers["thickness"] = layers["bottom"] - layers["top"]

# Column geometry
col_left = 0.0
col_right = 3.5
layers["x_center"] = (col_left + col_right) / 2

# Lithology fills - Imprint palette (Sandstone = brand green, position 1).
# Position 5 (matte red #AE3030) is reserved for the unconformity focal point.
lith_colors = {
    "Sandstone": "#009E73",
    "Shale": "#C475FD",
    "Limestone": "#4467A3",
    "Siltstone": "#BD8233",
    "Conglomerate": "#2ABCCD",
    "Mudstone": "#954477",
}

# Unconformity depth (J/K boundary between Kootenai Fm and Morrison Fm)
unconformity_depth = 95.0

# Generate FGDC/USGS-style pattern overlays inline (flat KISS structure)
np.random.seed(42)
dot_rows = []
circle_rows = []
seg_rows = []

for _, row in layers.iterrows():
    top_val, bot_val, lith = row["top"], row["bottom"], row["lithology"]
    thickness = bot_val - top_val

    if lith == "Sandstone":  # stipple dots
        n = int(thickness * 5)
        xs = np.random.uniform(col_left + 0.3, col_right - 0.3, n)
        ys = np.random.uniform(top_val + 0.5, bot_val - 0.5, n)
        for px, py in zip(xs, ys, strict=True):
            dot_rows.append({"x": px, "y": py})

    elif lith == "Shale":  # horizontal dashes
        y_pos = top_val + 1.0
        while y_pos < bot_val - 0.3:
            for x_start in np.arange(col_left + 0.3, col_right - 0.3, 0.8):
                seg_rows.append({"x": x_start, "y": y_pos, "xend": x_start + 0.45, "yend": y_pos})
            y_pos += 2.5

    elif lith == "Limestone":  # brick (staggered horizontal + vertical lines)
        y_pos = top_val + 2.0
        ridx = 0
        while y_pos < bot_val - 1.0:
            seg_rows.append({"x": col_left + 0.2, "y": y_pos, "xend": col_right - 0.2, "yend": y_pos})
            offset = 0.8 if ridx % 2 == 0 else 0.0
            for vx in np.arange(col_left + 0.4 + offset, col_right - 0.3, 1.6):
                seg_rows.append({"x": vx, "y": max(y_pos - 4.0, top_val + 0.2), "xend": vx, "yend": y_pos})
            y_pos += 4.0
            ridx += 1

    elif lith == "Siltstone":  # short random dashes
        n = int(thickness * 8)
        xs = np.random.uniform(col_left + 0.3, col_right - 0.3, n)
        ys = np.random.uniform(top_val + 0.5, bot_val - 0.5, n)
        dxs = np.random.uniform(-0.18, 0.18, n)
        for px, py, dx in zip(xs, ys, dxs, strict=True):
            seg_rows.append({"x": px, "y": py, "xend": px + dx, "yend": py + 0.3})

    elif lith == "Conglomerate":  # open clasts
        n = int(thickness * 2.5)
        xs = np.random.uniform(col_left + 0.5, col_right - 0.5, n)
        ys = np.random.uniform(top_val + 1.0, bot_val - 1.0, n)
        for px, py in zip(xs, ys, strict=True):
            circle_rows.append({"x": px, "y": py})

    elif lith == "Mudstone":  # fine horizontal dashes
        y_pos = top_val + 0.7
        while y_pos < bot_val - 0.3:
            for x_start in np.arange(col_left + 0.3, col_right - 0.3, 0.5):
                seg_rows.append({"x": x_start, "y": y_pos, "xend": x_start + 0.22, "yend": y_pos})
            y_pos += 1.8

dots_df = pd.DataFrame(dot_rows)
circles_df = pd.DataFrame(circle_rows)
lines_df = pd.DataFrame(seg_rows)

# Formation labels (one per formation, at its midpoint) on the right flank
form_groups = layers.groupby("formation", sort=False).agg({"top": "min", "bottom": "max"}).reset_index()
form_groups["mid"] = (form_groups["top"] + form_groups["bottom"]) / 2
form_groups["x"] = col_right + 0.3

# Age labels (one per age, at its midpoint) on the left flank with bracket lines
age_groups = layers.groupby("age", sort=False).agg({"top": "min", "bottom": "max"}).reset_index()
age_groups["mid"] = (age_groups["top"] + age_groups["bottom"]) / 2
age_groups["x"] = col_left - 0.55
age_groups["ymin"] = age_groups["top"] + 0.6
age_groups["ymax"] = age_groups["bottom"] - 0.6
age_groups["bracket_x"] = col_left - 0.25

# Layer boundary lines
boundaries = sorted(set(layers["top"].tolist() + layers["bottom"].tolist()))
boundary_df = pd.DataFrame(
    {"x": [col_left] * len(boundaries), "xend": [col_right] * len(boundaries), "y": boundaries, "yend": boundaries}
)

# Unconformity wavy line
wavy_x = np.linspace(col_left - 0.15, col_right + 0.15, 60)
wavy_y = unconformity_depth + np.sin(wavy_x * 8) * 0.8
wavy_df = pd.DataFrame({"x": wavy_x[:-1], "y": wavy_y[:-1], "xend": wavy_x[1:], "yend": wavy_y[1:]})

# Build plot using plotnine grammar of graphics
plot = (
    ggplot()
    # Layer fills - grammar-driven aesthetic mapping
    + geom_tile(
        data=layers,
        mapping=aes(x="x_center", y="mid", width=col_right - col_left, height="thickness", fill="lithology"),
        color=INK,
        size=0.7,
        alpha=0.62,
    )
    # Pattern overlays - line segments (dashes, brick, siltstone, mudstone)
    + geom_segment(data=lines_df, mapping=aes(x="x", y="y", xend="xend", yend="yend"), color=INK, size=0.45, alpha=0.85)
    # Pattern overlays - stipple dots (sandstone)
    + geom_point(data=dots_df, mapping=aes(x="x", y="y"), color=INK, size=0.9, alpha=0.8)
    # Pattern overlays - open clasts (conglomerate)
    + geom_point(
        data=circles_df, mapping=aes(x="x", y="y"), color=INK, size=2.6, alpha=0.7, shape="o", fill="none", stroke=0.8
    )
    # Layer boundary lines
    + geom_segment(data=boundary_df, mapping=aes(x="x", y="y", xend="xend", yend="yend"), color=INK, size=0.7)
    # Unconformity wavy line - Imprint matte red (#AE3030), the storytelling focal point
    + geom_segment(
        data=wavy_df, mapping=aes(x="x", y="y", xend="xend", yend="yend"), color="#AE3030", size=1.8, alpha=0.95
    )
    + annotate(
        "text",
        x=col_right + 0.3,
        y=unconformity_depth,
        label="Unconformity",
        ha="left",
        size=4.2,
        color="#AE3030",
        fontstyle="italic",
        fontweight="bold",
    )
    # Age bracket lines (idiomatic plotnine vertical ranges)
    + geom_linerange(data=age_groups, mapping=aes(x="bracket_x", ymin="ymin", ymax="ymax"), color=INK_SOFT, size=0.8)
    # Formation labels (plotnine-native styled text with elevated background)
    + geom_label(
        data=form_groups,
        mapping=aes(x="x", y="mid", label="formation"),
        ha="left",
        size=3.7,
        fontstyle="italic",
        color=INK,
        fill=ELEVATED_BG,
        label_padding=0.28,
        label_size=0.3,
    )
    # Age labels on the left flank
    + geom_text(
        data=age_groups,
        mapping=aes(x="x", y="mid", label="age"),
        ha="right",
        size=3.6,
        fontweight="bold",
        color=INK_SOFT,
    )
    # Scales - grammar-driven fill mapping
    + scale_fill_manual(values=lith_colors, name="Lithology")
    + scale_x_continuous(limits=(-3.6, 7.2), breaks=[])
    + scale_y_continuous(trans="reverse", name="Depth (m)", breaks=list(range(0, 200, 20)))
    + coord_cartesian(xlim=(-3.6, 7.2), ylim=(185, -5))
    + labs(title="column-stratigraphic · python · plotnine · anyplot.ai", x="")
    + guides(fill=guide_legend(nrow=2))
    # Theme - theme-adaptive chrome over a 2400×2400 square canvas
    + theme_minimal()
    + theme(
        figure_size=(6, 6),
        plot_title=element_text(size=12, face="bold", ha="center", color=INK),
        axis_title_y=element_text(size=11, color=INK),
        axis_title_x=element_blank(),
        axis_text_y=element_text(size=9, color=INK_SOFT),
        axis_text_x=element_blank(),
        axis_ticks_major_x=element_blank(),
        legend_title=element_text(size=11, face="bold", color=INK),
        legend_text=element_text(size=9, color=INK_SOFT),
        legend_position="bottom",
        legend_direction="horizontal",
        legend_key_size=16,
        legend_background=element_rect(fill=ELEVATED_BG, color=INK_SOFT, size=0.4),
        legend_margin=8,
        panel_grid_major_x=element_blank(),
        panel_grid_minor_x=element_blank(),
        panel_grid_major_y=element_line(color=INK, size=0.3, alpha=0.12),
        panel_grid_minor_y=element_blank(),
        panel_background=element_rect(fill=PAGE_BG, color="none"),
        plot_background=element_rect(fill=PAGE_BG, color=PAGE_BG),
    )
)

# Save (square 2400×2400)
plot.save(f"plot-{THEME}.png", dpi=400, width=6, height=6, units="in")
Runnable source as JSON, for any HTTP client: https://api.anyplot.ai/specs/column-stratigraphic/plotnine/code. Any spec id and library id listed in llms-full.txt fit the same URL shape; every URL below is complete and callable.
{
  "spec_id": "column-stratigraphic",
  "language": "python",
  "library": "plotnine",
  "page": "https://anyplot.ai/column-stratigraphic/python/plotnine",
  "hub": "https://anyplot.ai/column-stratigraphic",
  "code_json": "https://api.anyplot.ai/specs/column-stratigraphic/plotnine/code",
  "spec_json": "https://api.anyplot.ai/specs/column-stratigraphic",
  "render_light_png": "https://storage.googleapis.com/anyplot-images/plots/column-stratigraphic/python/plotnine/plot-light.png",
  "render_dark_png": "https://storage.googleapis.com/anyplot-images/plots/column-stratigraphic/python/plotnine/plot-dark.png",
  "quality_score": 94.0,
  "license": "MIT",
  "guide": "https://anyplot.ai/llms.txt"
}
Part of Stratigraphic Column with Lithology Patterns on anyplot.ai.