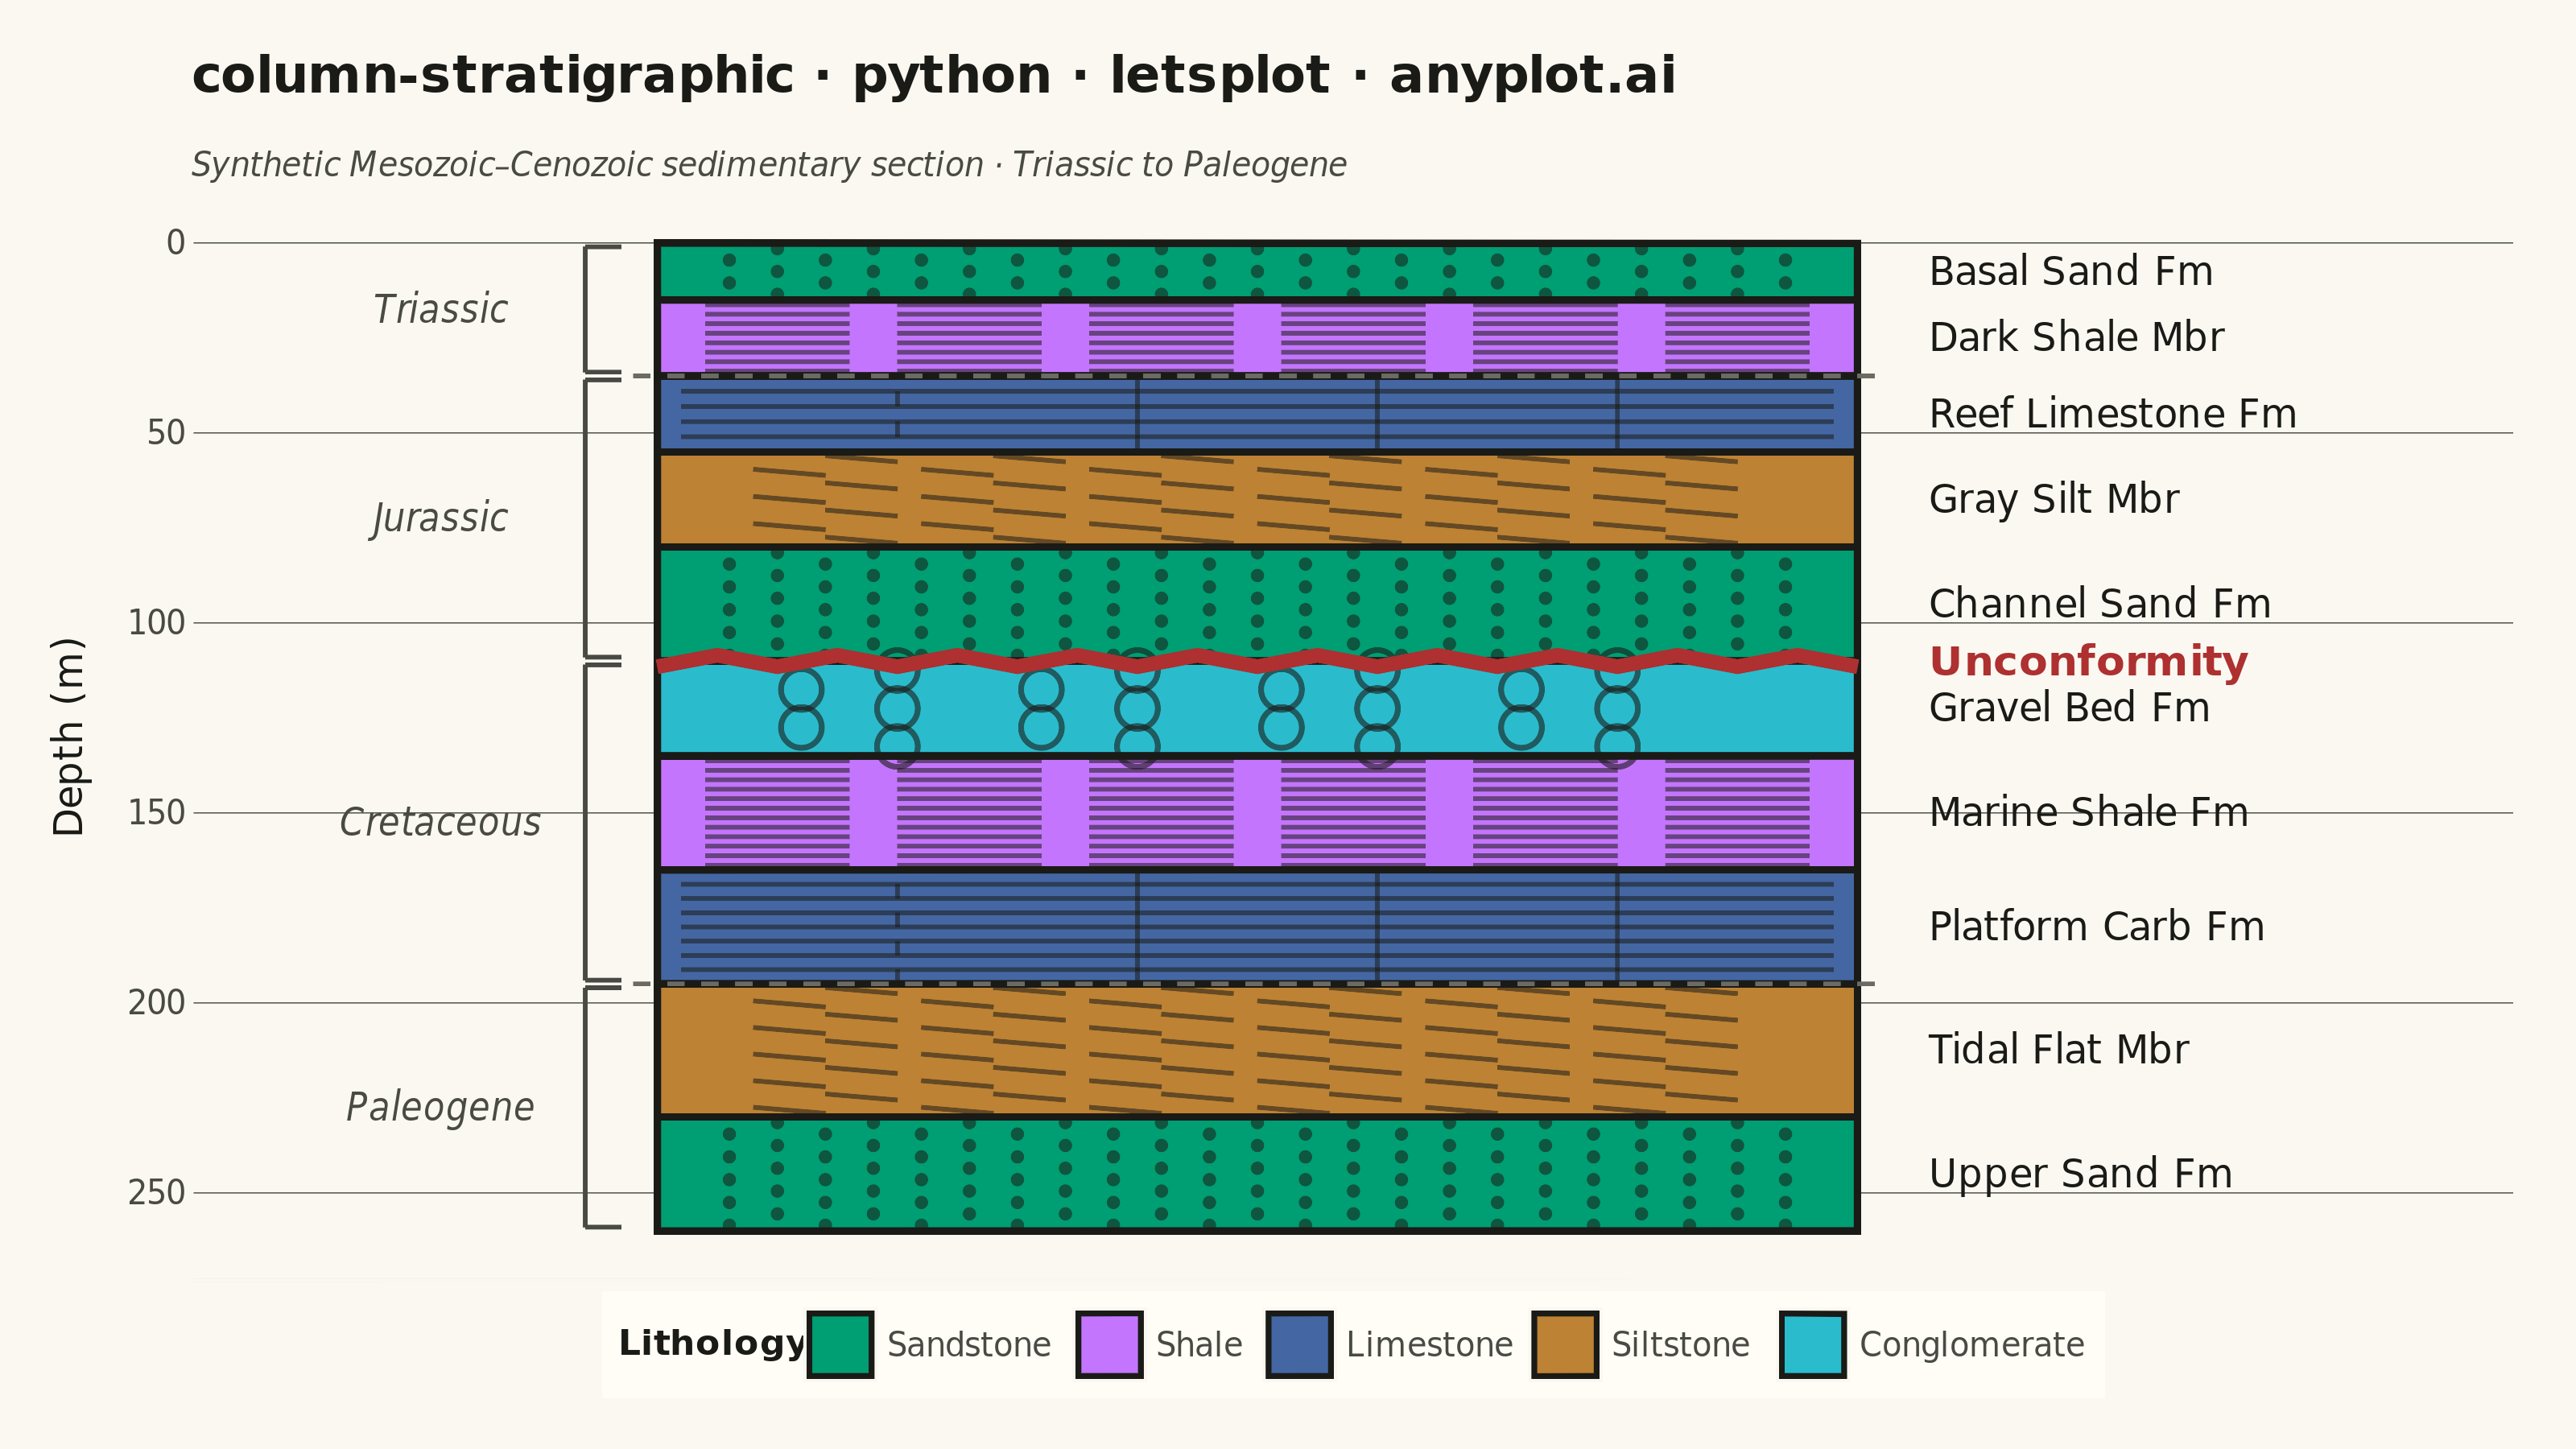
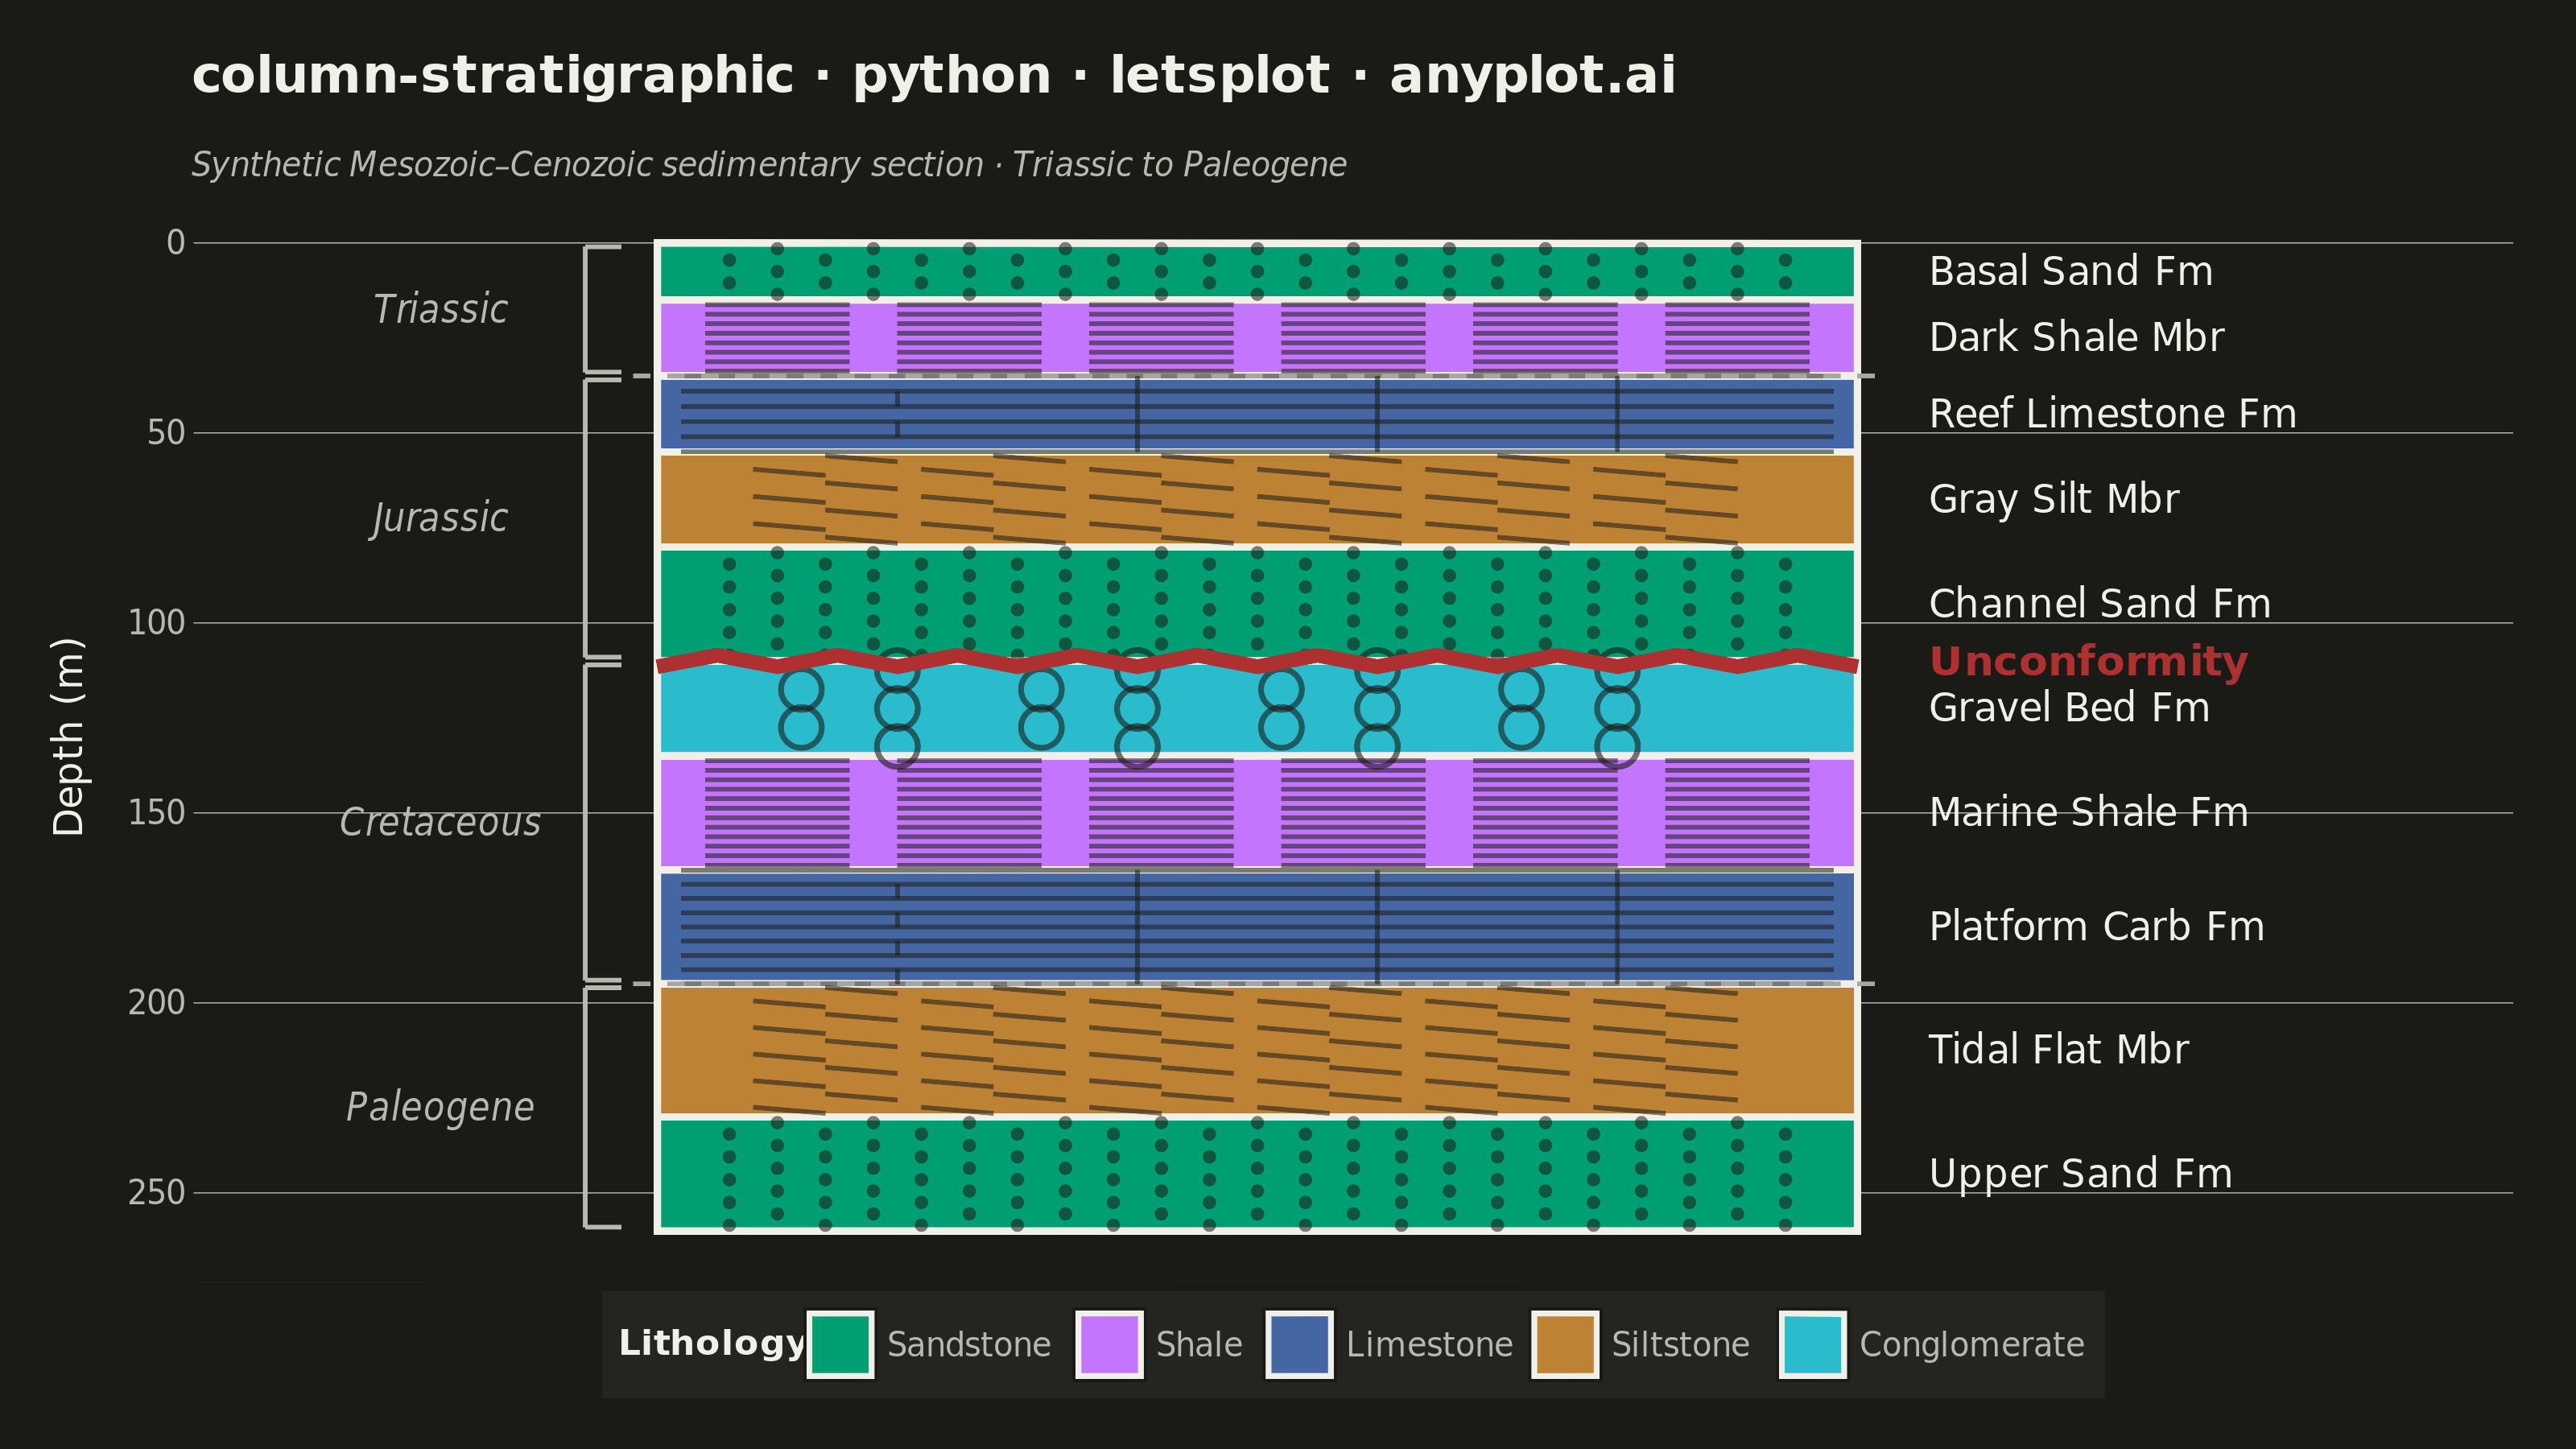
A vertical column visualization showing geological rock layers with standardized lithology patterns, formation names, ages, and thickness scales. Each layer is represented as a stacked rectangular block filled with a distinctive pattern (e.g., brick pattern for limestone, dots for sandstone, dashes for shale) following FGDC/USGS conventions. This plot is essential for communicating subsurface geology and sedimentary sequences in a compact, standardized format.
""" anyplot.ai
column-stratigraphic: Stratigraphic Column with Lithology Patterns
Library: letsplot 4.10.1 | Python 3.13.14
Quality: 94/100 | Updated: 2026-06-17
"""
# ruff: noqa: F405

import os
import shutil

import pandas as pd
from lets_plot import *


LetsPlot.setup_html()

# Theme tokens (see prompts/default-style-guide.md "Theme-adaptive Chrome")
THEME = os.getenv("ANYPLOT_THEME", "light")
PAGE_BG = "#FAF8F1" if THEME == "light" else "#1A1A17"
ELEVATED_BG = "#FFFDF6" if THEME == "light" else "#242420"
INK = "#1A1A17" if THEME == "light" else "#F0EFE8"
INK_SOFT = "#4A4A44" if THEME == "light" else "#B8B7B0"
INK_MUTED = "#6B6A63" if THEME == "light" else "#A8A79F"

# Imprint palette — matte red (#AE3030) reserved as the unconformity anchor
ACCENT = "#AE3030"  # Imprint semantic anchor — erosional discontinuity

# Pattern ink overlays the saturated fills (constant in both themes)
PATTERN_INK = "#1A1A17"

# Data - synthetic sedimentary section with 10 layers (depth increasing downward)
layers = pd.DataFrame(
    {
        "top": [0, 15, 35, 55, 80, 110, 135, 165, 195, 230],
        "bottom": [15, 35, 55, 80, 110, 135, 165, 195, 230, 260],
        "lithology": [
            "Sandstone",
            "Shale",
            "Limestone",
            "Siltstone",
            "Sandstone",
            "Conglomerate",
            "Shale",
            "Limestone",
            "Siltstone",
            "Sandstone",
        ],
        "formation": [
            "Basal Sand Fm",
            "Dark Shale Mbr",
            "Reef Limestone Fm",
            "Gray Silt Mbr",
            "Channel Sand Fm",
            "Gravel Bed Fm",
            "Marine Shale Fm",
            "Platform Carb Fm",
            "Tidal Flat Mbr",
            "Upper Sand Fm",
        ],
        "age": [
            "Triassic",
            "Triassic",
            "Jurassic",
            "Jurassic",
            "Jurassic",
            "Cretaceous",
            "Cretaceous",
            "Cretaceous",
            "Paleogene",
            "Paleogene",
        ],
    }
)

layers["thickness"] = layers["bottom"] - layers["top"]
layers["xmin"] = 0.0
layers["xmax"] = 1.0

# Lithology fills — Imprint palette (CVD-safe), red withheld for the unconformity.
# Sandstone is the first categorical series → brand green #009E73.
lithology_colors = {
    "Sandstone": "#009E73",  # Imprint 1 — brand green (first series)
    "Shale": "#C475FD",  # Imprint 2 — lavender
    "Limestone": "#4467A3",  # Imprint 3 — blue
    "Siltstone": "#BD8233",  # Imprint 4 — ochre (earth)
    "Conglomerate": "#2ABCCD",  # Imprint 6 — cyan
}
lithology_order = ["Sandstone", "Shale", "Limestone", "Siltstone", "Conglomerate"]

# Generate lithology pattern overlay data (FGDC/USGS-style textures)
pattern_segments = []  # For line-based patterns (shale dashes, limestone bricks)
pattern_points = []  # For dot-based patterns (sandstone stipple, conglomerate circles)

for _, row in layers.iterrows():
    top, bottom, lith = row["top"], row["bottom"], row["lithology"]
    thickness = bottom - top
    margin = 0.03

    if lith == "Shale":
        # Horizontal dashes - denser pattern
        spacing = 2.5
        n_lines = max(1, int(thickness / spacing))
        for i in range(n_lines):
            y = top + (i + 0.5) * thickness / n_lines
            for x_start in [0.04, 0.20, 0.36, 0.52, 0.68, 0.84]:
                pattern_segments.append({"x": x_start, "y": y, "xend": x_start + 0.12, "yend": y})

    elif lith == "Limestone":
        # Brick pattern: horizontal lines + offset vertical lines - denser
        spacing = 3.5
        n_rows = max(1, int(thickness / spacing))
        for i in range(n_rows + 1):
            y = top + margin + i * (thickness - 2 * margin) / max(n_rows, 1)
            if top + margin <= y <= bottom - margin:
                pattern_segments.append({"x": 0.02, "y": y, "xend": 0.98, "yend": y})
        for i in range(n_rows):
            y_top = top + margin + i * (thickness - 2 * margin) / max(n_rows, 1)
            y_bot = top + margin + (i + 1) * (thickness - 2 * margin) / max(n_rows, 1)
            offset = 0.2 if i % 2 == 0 else 0.0
            for vx in [0.2 + offset, 0.4 + offset, 0.6 + offset, 0.8 + offset]:
                if 0.02 < vx < 0.98:
                    pattern_segments.append({"x": vx, "y": y_top, "xend": vx, "yend": y_bot})

    elif lith == "Sandstone":
        # Stipple dots - denser grid
        spacing_y = 2.8
        spacing_x = 0.08
        n_rows = max(1, int(thickness / spacing_y))
        for i in range(n_rows):
            y = top + (i + 0.5) * thickness / n_rows
            offset = 0.04 if i % 2 == 0 else 0.0
            x = 0.06 + offset
            while x < 0.96:
                pattern_points.append({"x": x, "y": y, "shape": "dot"})
                x += spacing_x

    elif lith == "Siltstone":
        # Short tilted dashes - denser
        spacing_y = 3.5
        n_rows = max(1, int(thickness / spacing_y))
        for i in range(n_rows):
            y = top + (i + 0.5) * thickness / n_rows
            offset = 0.06 if i % 2 == 0 else 0.0
            for x in [0.08 + offset, 0.22 + offset, 0.36 + offset, 0.50 + offset, 0.64 + offset, 0.78 + offset]:
                if x < 0.95:
                    pattern_segments.append({"x": x, "y": y - 0.8, "xend": x + 0.06, "yend": y + 0.8})

    elif lith == "Conglomerate":
        # Circles (larger dots) - denser
        spacing_y = 4.5
        n_rows = max(1, int(thickness / spacing_y))
        for i in range(n_rows):
            y = top + (i + 0.5) * thickness / n_rows
            offset = 0.08 if i % 2 == 0 else 0.0
            for x in [0.12 + offset, 0.32 + offset, 0.52 + offset, 0.72 + offset]:
                if x < 0.95:
                    pattern_points.append({"x": x, "y": y, "shape": "circle"})

pattern_seg_df = pd.DataFrame(pattern_segments) if pattern_segments else None
pattern_dot_df = pd.DataFrame([p for p in pattern_points if p["shape"] == "dot"]) if pattern_points else None
pattern_circle_df = pd.DataFrame([p for p in pattern_points if p["shape"] == "circle"]) if pattern_points else None

# Formation labels (right side)
form_labels = []
for _, row in layers.iterrows():
    mid_depth = (row["top"] + row["bottom"]) / 2
    form_labels.append({"x": 1.06, "y": mid_depth, "label": row["formation"]})
form_df = pd.DataFrame(form_labels)

# Age labels (left side) with bracket indicators
age_spans = {"Triassic": (0, 35), "Jurassic": (35, 110), "Cretaceous": (110, 195), "Paleogene": (195, 260)}
age_labels = []
age_brackets = []
for age_name, (age_top, age_bottom) in age_spans.items():
    age_labels.append({"x": -0.18, "y": (age_top + age_bottom) / 2, "label": age_name})
    # Bracket lines on left
    age_brackets.append({"x": -0.06, "y": age_top + 1, "xend": -0.06, "yend": age_bottom - 1})
    age_brackets.append({"x": -0.06, "y": age_top + 1, "xend": -0.03, "yend": age_top + 1})
    age_brackets.append({"x": -0.06, "y": age_bottom - 1, "xend": -0.03, "yend": age_bottom - 1})
age_df = pd.DataFrame(age_labels)
bracket_df = pd.DataFrame(age_brackets)

# Unconformity wavy line at Jurassic/Cretaceous boundary (110m)
wavy_x = []
wavy_y = []
n_waves = 20
for i in range(n_waves + 1):
    xi = i / n_waves
    yi = 110 + 1.5 * (1 if (i % 2 == 0) else -1)
    wavy_x.append(xi)
    wavy_y.append(yi)
wavy_df = pd.DataFrame({"x": wavy_x, "y": wavy_y})

# Plot assembly
plot = (
    ggplot()
    # Layer rectangles with interactive tooltips
    + geom_rect(
        aes(xmin="xmin", xmax="xmax", ymin="top", ymax="bottom", fill="lithology"),
        data=layers,
        color=INK,
        size=1.0,
        tooltips=layer_tooltips()
        .format("@top", ".0f")
        .format("@bottom", ".0f")
        .format("@thickness", ".0f")
        .title("@formation")
        .line("@lithology | @age")
        .line("Depth: @top–@bottom m")
        .line("Thickness: @thickness m"),
    )
)

# Add pattern overlays
if pattern_seg_df is not None and len(pattern_seg_df) > 0:
    plot = plot + geom_segment(
        aes(x="x", y="y", xend="xend", yend="yend"),
        data=pattern_seg_df,
        color=PATTERN_INK,
        size=0.6,
        alpha=0.55,
        show_legend=False,
    )

if pattern_dot_df is not None and len(pattern_dot_df) > 0:
    plot = plot + geom_point(
        aes(x="x", y="y"), data=pattern_dot_df, color=PATTERN_INK, size=1.8, alpha=0.55, shape=16, show_legend=False
    )

if pattern_circle_df is not None and len(pattern_circle_df) > 0:
    plot = plot + geom_point(
        aes(x="x", y="y"), data=pattern_circle_df, color=PATTERN_INK, size=5.0, alpha=0.6, shape=1, show_legend=False
    )

# Unconformity wavy line at 110m with label (Imprint matte-red anchor)
plot = plot + geom_line(aes(x="x", y="y"), data=wavy_df, color=ACCENT, size=2.0, show_legend=False)
unconformity_label = pd.DataFrame({"x": [1.06], "y": [110], "label": ["Unconformity"]})
plot = plot + geom_text(
    aes(x="x", y="y", label="label"),
    data=unconformity_label,
    color=ACCENT,
    size=6.5,
    fontface="bold",
    hjust=0,
    show_legend=False,
)

# Age boundary dashed lines (non-unconformity)
non_unconformity_boundaries = pd.DataFrame(
    {"x": [-0.02, -0.02], "y": [35, 195], "xend": [1.02, 1.02], "yend": [35, 195]}
)
plot = plot + geom_segment(
    aes(x="x", y="y", xend="xend", yend="yend"),
    data=non_unconformity_boundaries,
    linetype="dashed",
    color=INK_MUTED,
    size=0.6,
    show_legend=False,
)

# Age brackets (left side)
plot = plot + geom_segment(
    aes(x="x", y="y", xend="xend", yend="yend"), data=bracket_df, color=INK_SOFT, size=0.6, show_legend=False
)

# Formation labels (right side)
plot = plot + geom_text(aes(x="x", y="y", label="label"), data=form_df, size=6, color=INK, hjust=0)

# Age labels (left side)
plot = plot + geom_text(aes(x="x", y="y", label="label"), data=age_df, size=6, color=INK_SOFT, fontface="italic")

# Theme flavor follows the active theme
flavor = flavor_high_contrast_light() if THEME == "light" else flavor_high_contrast_dark()

# Scales and theme
plot = (
    plot
    + scale_fill_manual(values=lithology_colors, name="Lithology", limits=lithology_order)
    + scale_y_reverse()
    + labs(
        title="column-stratigraphic · python · letsplot · anyplot.ai",
        subtitle="Synthetic Mesozoic–Cenozoic sedimentary section · Triassic to Paleogene",
        y="Depth (m)",
        x="",
    )
    + scale_x_continuous(limits=[-0.30, 1.46])
    + flavor
    + theme(
        plot_title=element_text(size=16, face="bold", color=INK, margin=[0, 0, 10, 0]),
        plot_subtitle=element_text(size=11, color=INK_SOFT, face="italic"),
        axis_title_y=element_text(size=12, color=INK, margin=[0, 8, 0, 0]),
        axis_title_x=element_blank(),
        axis_text_y=element_text(size=10, color=INK_SOFT),
        axis_text_x=element_blank(),
        axis_ticks_x=element_blank(),
        axis_line_y=element_line(size=0.8, color=INK_SOFT),
        legend_title=element_text(size=11, face="bold", color=INK),
        legend_text=element_text(size=10, color=INK_SOFT),
        legend_position="bottom",
        legend_background=element_rect(fill=ELEVATED_BG, color=INK_SOFT),
        panel_grid_major_x=element_blank(),
        panel_grid_minor_x=element_blank(),
        panel_grid_major_y=element_line(size=0.3, color=INK_SOFT),
        panel_grid_minor_y=element_blank(),
        panel_background=element_rect(fill=PAGE_BG, color=PAGE_BG),
        plot_background=element_rect(color=PAGE_BG, fill=PAGE_BG),
        plot_margin=[16, 16, 16, 16],
    )
    + ggsize(800, 450)
)

# Save (PNG + interactive HTML), theme-suffixed
ggsave(plot, f"plot-{THEME}.png", scale=4)
ggsave(plot, f"plot-{THEME}.html")

# Move files from lets-plot-images to current directory
for ext in ("png", "html"):
    src = f"lets-plot-images/plot-{THEME}.{ext}"
    if os.path.exists(src):
        shutil.move(src, f"plot-{THEME}.{ext}")
if os.path.exists("lets-plot-images") and not os.listdir("lets-plot-images"):
    os.rmdir("lets-plot-images")
Runnable source as JSON, for any HTTP client: https://api.anyplot.ai/specs/column-stratigraphic/letsplot/code. Any spec id and library id listed in llms-full.txt fit the same URL shape; every URL below is complete and callable.
{
  "spec_id": "column-stratigraphic",
  "language": "python",
  "library": "letsplot",
  "page": "https://anyplot.ai/column-stratigraphic/python/letsplot",
  "hub": "https://anyplot.ai/column-stratigraphic",
  "code_json": "https://api.anyplot.ai/specs/column-stratigraphic/letsplot/code",
  "spec_json": "https://api.anyplot.ai/specs/column-stratigraphic",
  "render_light_png": "https://storage.googleapis.com/anyplot-images/plots/column-stratigraphic/python/letsplot/plot-light.png",
  "render_dark_png": "https://storage.googleapis.com/anyplot-images/plots/column-stratigraphic/python/letsplot/plot-dark.png",
  "interactive_light_html": "https://storage.googleapis.com/anyplot-images/plots/column-stratigraphic/python/letsplot/plot-light.html",
  "interactive_dark_html": "https://storage.googleapis.com/anyplot-images/plots/column-stratigraphic/python/letsplot/plot-dark.html",
  "quality_score": 94.0,
  "license": "MIT",
  "guide": "https://anyplot.ai/llms.txt"
}
Part of Stratigraphic Column with Lithology Patterns on anyplot.ai.