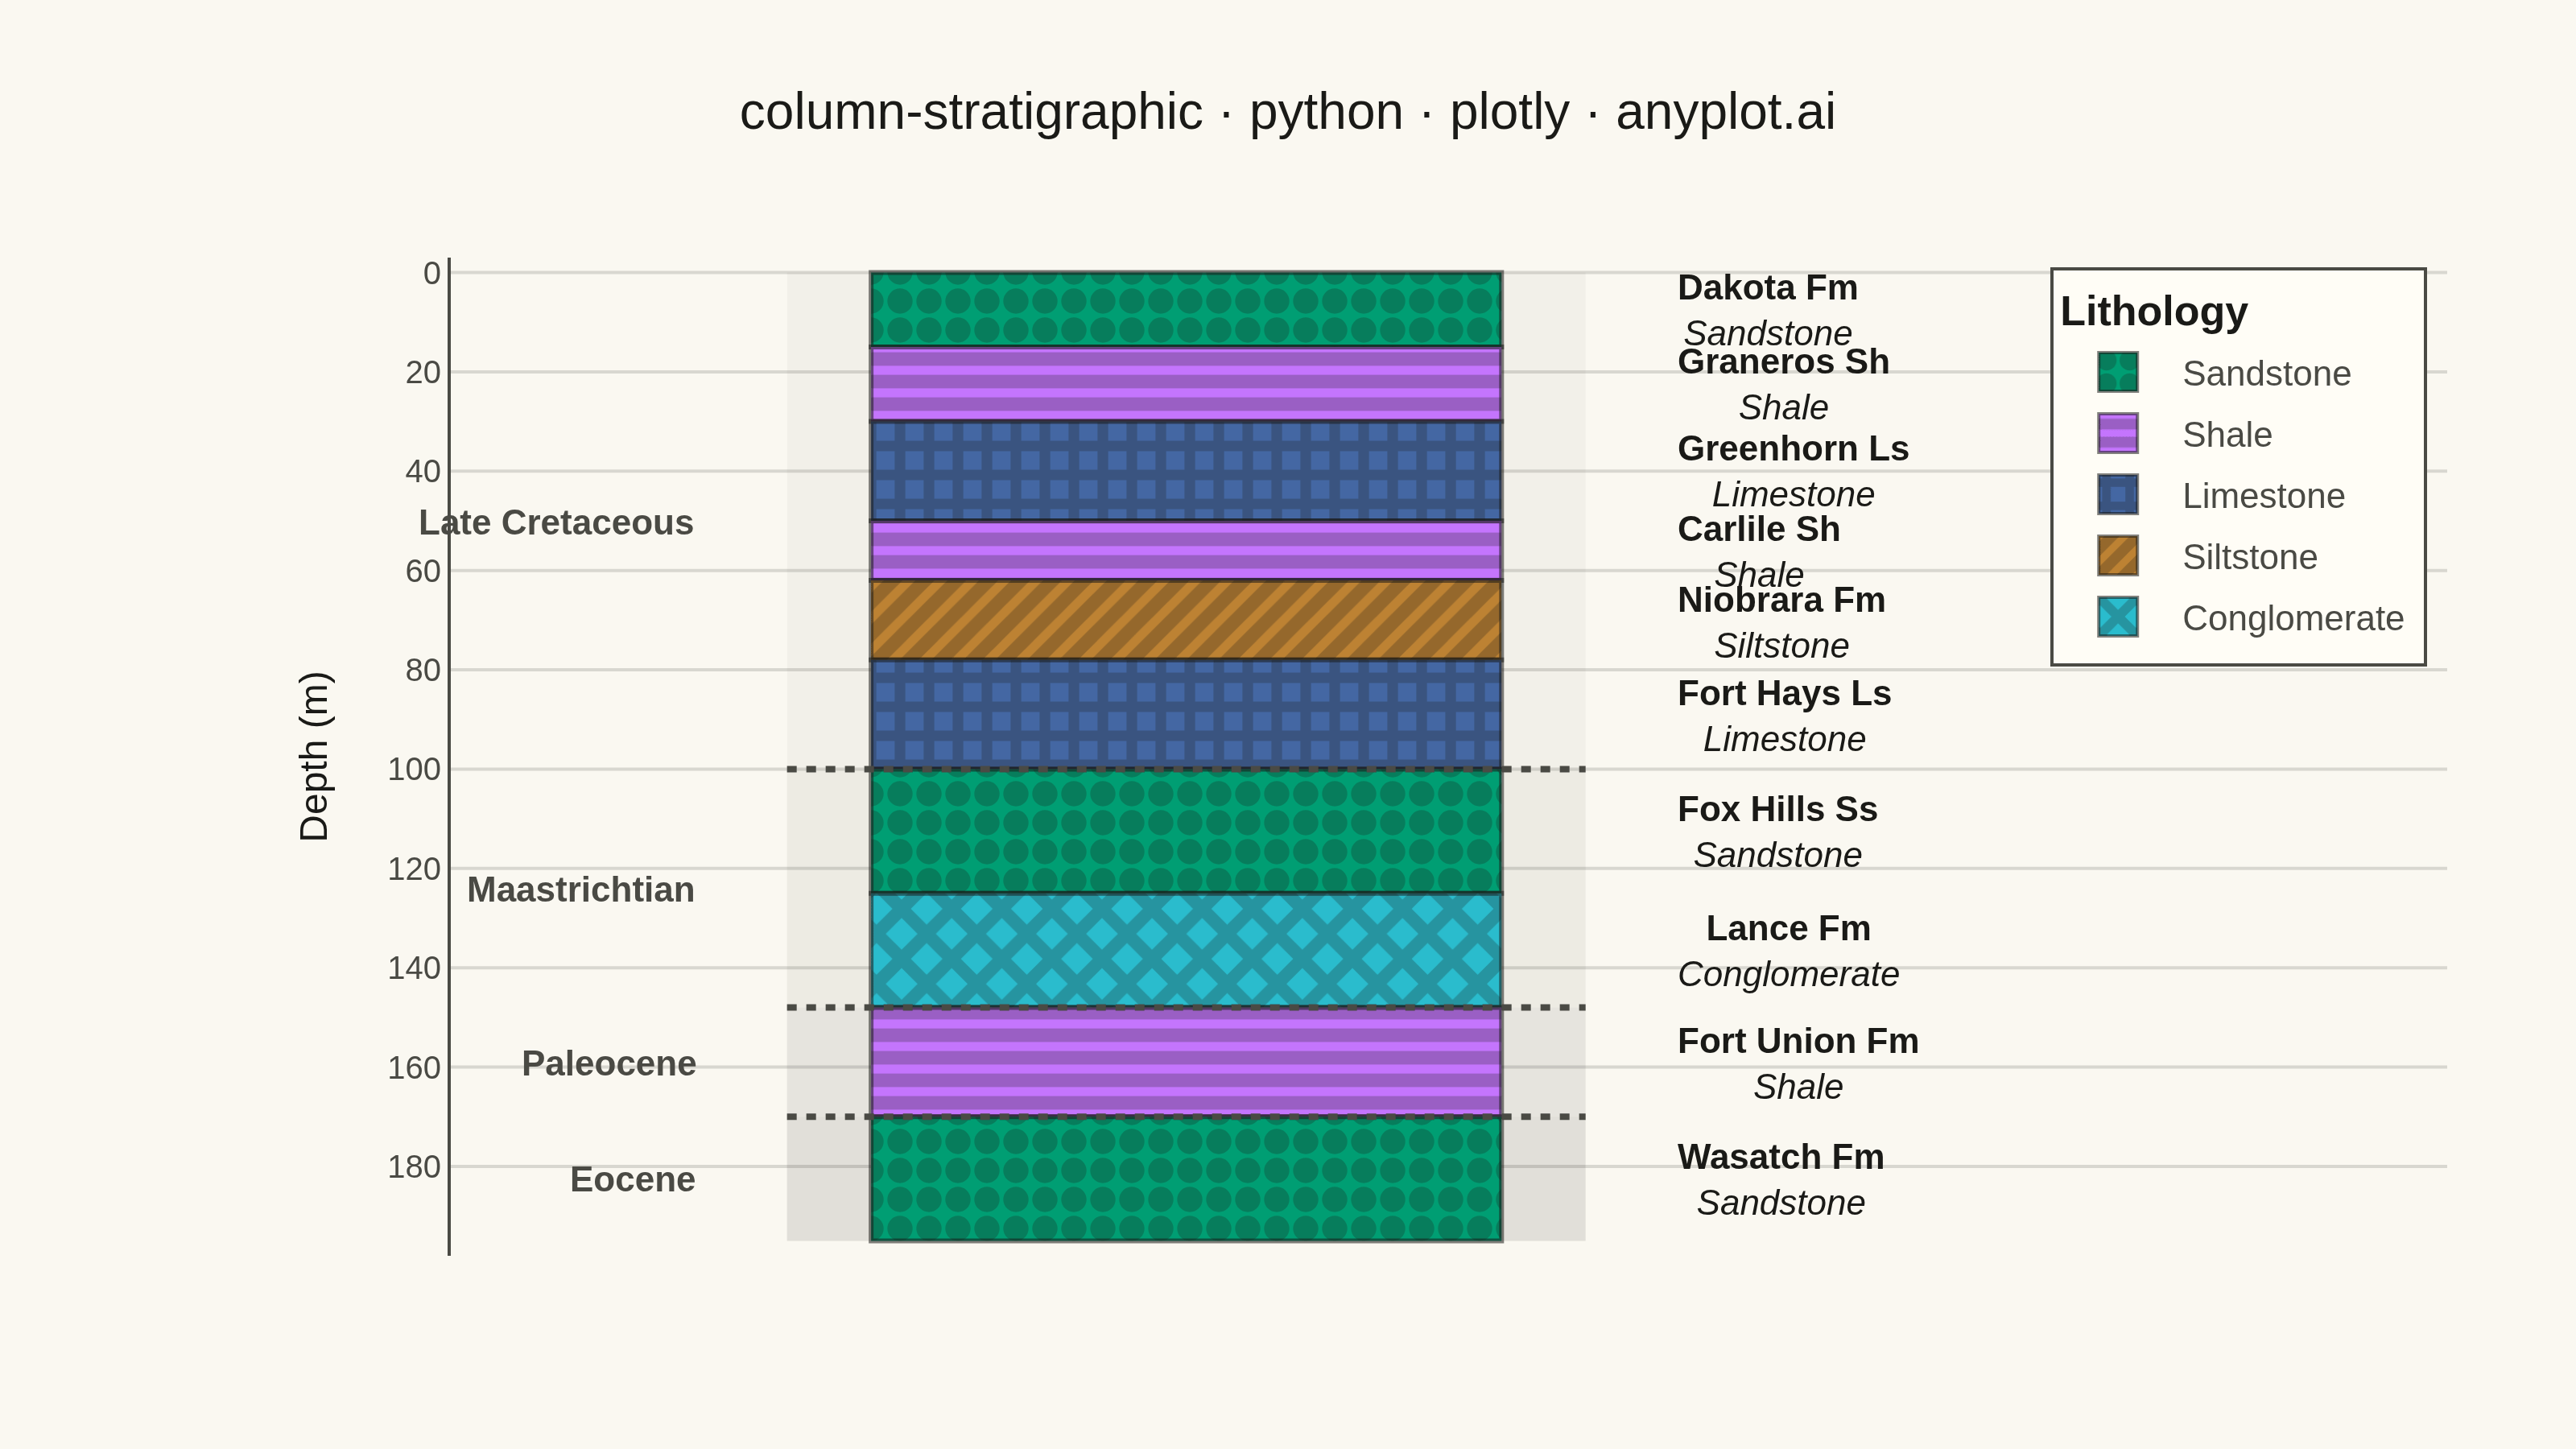
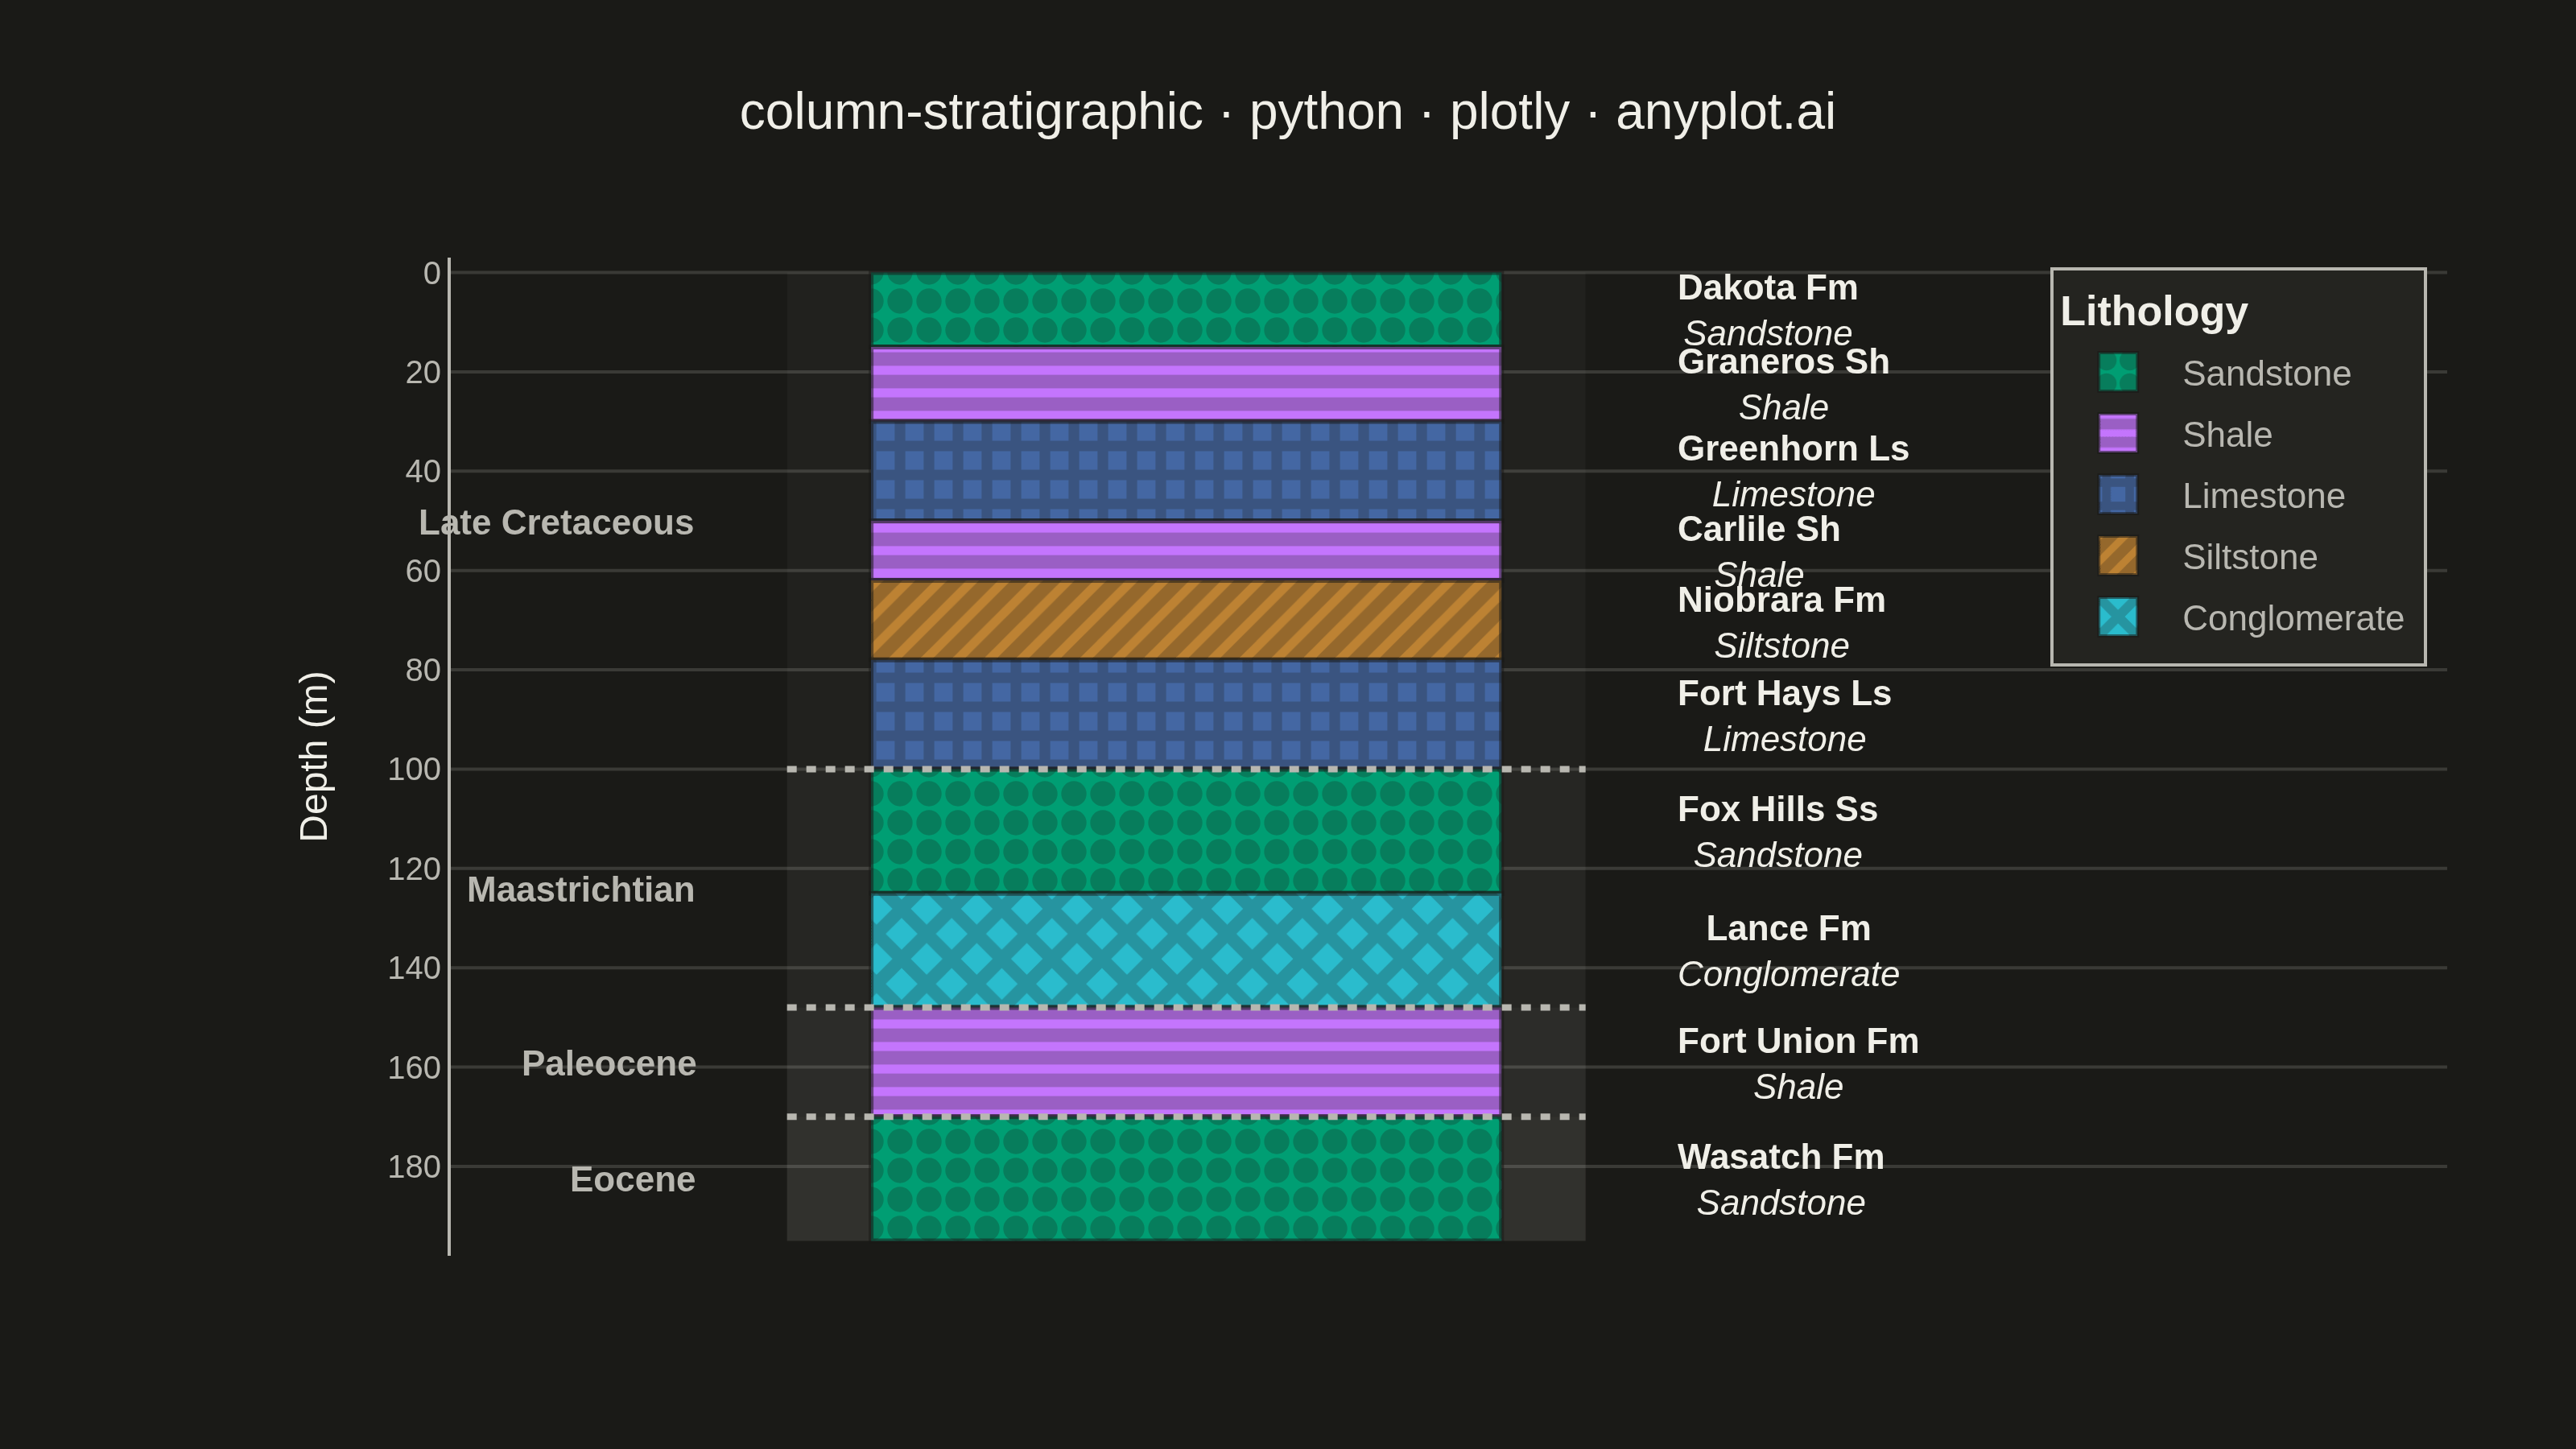
A vertical column visualization showing geological rock layers with standardized lithology patterns, formation names, ages, and thickness scales. Each layer is represented as a stacked rectangular block filled with a distinctive pattern (e.g., brick pattern for limestone, dots for sandstone, dashes for shale) following FGDC/USGS conventions. This plot is essential for communicating subsurface geology and sedimentary sequences in a compact, standardized format.
""" anyplot.ai
column-stratigraphic: Stratigraphic Column with Lithology Patterns
Library: plotly 6.8.0 | Python 3.13.14
Quality: 91/100 | Updated: 2026-06-17
"""

import os

import plotly.graph_objects as go


# Theme tokens (see prompts/default-style-guide.md "Theme-adaptive Chrome")
THEME = os.getenv("ANYPLOT_THEME", "light")
PAGE_BG = "#FAF8F1" if THEME == "light" else "#1A1A17"
ELEVATED_BG = "#FFFDF6" if THEME == "light" else "#242420"
INK = "#1A1A17" if THEME == "light" else "#F0EFE8"
INK_SOFT = "#4A4A44" if THEME == "light" else "#B8B7B0"
GRID = "rgba(26,26,23,0.15)" if THEME == "light" else "rgba(240,239,232,0.15)"
INK_RGB = "26,26,23" if THEME == "light" else "240,239,232"

# Constant data-mark styling (kept identical across themes so the column reads the same)
PATTERN_FG = "rgba(26,26,23,0.5)"
BAR_EDGE = "rgba(26,26,23,0.55)"

# Data - synthetic sedimentary section based on Western Interior Seaway formations
layers = [
    {"top": 0, "bottom": 15, "lithology": "Sandstone", "formation": "Dakota Fm", "age": "Late Cretaceous"},
    {"top": 15, "bottom": 30, "lithology": "Shale", "formation": "Graneros Sh", "age": "Late Cretaceous"},
    {"top": 30, "bottom": 50, "lithology": "Limestone", "formation": "Greenhorn Ls", "age": "Late Cretaceous"},
    {"top": 50, "bottom": 62, "lithology": "Shale", "formation": "Carlile Sh", "age": "Late Cretaceous"},
    {"top": 62, "bottom": 78, "lithology": "Siltstone", "formation": "Niobrara Fm", "age": "Late Cretaceous"},
    {"top": 78, "bottom": 100, "lithology": "Limestone", "formation": "Fort Hays Ls", "age": "Late Cretaceous"},
    {"top": 100, "bottom": 125, "lithology": "Sandstone", "formation": "Fox Hills Ss", "age": "Maastrichtian"},
    {"top": 125, "bottom": 148, "lithology": "Conglomerate", "formation": "Lance Fm", "age": "Maastrichtian"},
    {"top": 148, "bottom": 170, "lithology": "Shale", "formation": "Fort Union Fm", "age": "Paleocene"},
    {"top": 170, "bottom": 195, "lithology": "Sandstone", "formation": "Wasatch Fm", "age": "Eocene"},
]

# Lithology fills from the Imprint palette (canonical order, brand green first),
# each paired with a distinct fill pattern approximating FGDC/USGS map symbols.
lithology_styles = {
    "Sandstone": {"color": "#009E73", "pattern_shape": ".", "pattern_size": 9},
    "Shale": {"color": "#C475FD", "pattern_shape": "-", "pattern_size": 7},
    "Limestone": {"color": "#4467A3", "pattern_shape": "+", "pattern_size": 9},
    "Siltstone": {"color": "#BD8233", "pattern_shape": "/", "pattern_size": 7},
    "Conglomerate": {"color": "#2ABCCD", "pattern_shape": "x", "pattern_size": 11},
}

# Subtle theme-adaptive shading deepens with each younger period (top -> bottom)
age_alpha = {"Late Cretaceous": 0.035, "Maastrichtian": 0.06, "Paleocene": 0.085, "Eocene": 0.11}

# Plot
fig = go.Figure()

# Group consecutive layers by age for boundary markers and left-side labels
age_groups = []
current_age = layers[0]["age"]
current_top = layers[0]["top"]
prev_bottom = layers[0]["bottom"]
for layer in layers:
    if layer["age"] != current_age:
        age_groups.append({"age": current_age, "top": current_top, "bottom": prev_bottom})
        current_age = layer["age"]
        current_top = layer["top"]
    prev_bottom = layer["bottom"]
age_groups.append({"age": current_age, "top": current_top, "bottom": prev_bottom})

# Subtle age-period background shading
for group in age_groups:
    fig.add_shape(
        type="rect",
        x0=0.62,
        x1=1.38,
        y0=group["top"],
        y1=group["bottom"],
        fillcolor=f"rgba({INK_RGB},{age_alpha.get(group['age'], 0.04)})",
        line={"width": 0},
        layer="below",
    )

# Age boundary lines (heavier dotted lines at period transitions)
for i in range(1, len(age_groups)):
    boundary_depth = age_groups[i]["top"]
    fig.add_shape(
        type="line",
        x0=0.62,
        x1=1.38,
        y0=boundary_depth,
        y1=boundary_depth,
        line={"color": INK_SOFT, "width": 2, "dash": "dot"},
        layer="above",
    )

# Layer bars
for layer in layers:
    style = lithology_styles[layer["lithology"]]
    thickness = layer["bottom"] - layer["top"]
    mid_depth = (layer["top"] + layer["bottom"]) / 2

    fig.add_trace(
        go.Bar(
            x=[1],
            y=[thickness],
            base=layer["top"],
            orientation="v",
            marker={
                "color": style["color"],
                "pattern": {
                    "shape": style["pattern_shape"],
                    "size": style["pattern_size"],
                    "solidity": 0.6,
                    "fgcolor": PATTERN_FG,
                },
                "line": {"color": BAR_EDGE, "width": 1.5},
            },
            width=0.6,
            showlegend=False,
            hovertemplate=(
                f"<b>{layer['formation']}</b><br>"
                f"Lithology: {layer['lithology']}<br>"
                f"Depth: {layer['top']}-{layer['bottom']} m<br>"
                f"Thickness: {thickness} m<br>"
                f"Age: {layer['age']}"
                "<extra></extra>"
            ),
        )
    )

    # Formation name + lithology label (right of the column)
    fig.add_annotation(
        x=1.46,
        y=mid_depth,
        text=f"<b>{layer['formation']}</b><br><i>{layer['lithology']}</i>",
        showarrow=False,
        font={"size": 11, "color": INK},
        xanchor="left",
        yanchor="middle",
    )

# Age period labels on the left side
for group in age_groups:
    mid = (group["top"] + group["bottom"]) / 2
    fig.add_annotation(
        x=0.54,
        y=mid,
        text=f"<b>{group['age']}</b>",
        showarrow=False,
        font={"size": 11, "color": INK_SOFT},
        xanchor="right",
        yanchor="middle",
    )

# Legend for lithology types with pattern swatches
for lithology, style in lithology_styles.items():
    fig.add_trace(
        go.Bar(
            x=[None],
            y=[None],
            marker={
                "color": style["color"],
                "pattern": {
                    "shape": style["pattern_shape"],
                    "size": style["pattern_size"],
                    "solidity": 0.6,
                    "fgcolor": PATTERN_FG,
                },
                "line": {"color": BAR_EDGE, "width": 1},
            },
            name=lithology,
            showlegend=True,
        )
    )

# Style
fig.update_layout(
    autosize=False,
    title={
        "text": "column-stratigraphic · python · plotly · anyplot.ai",
        "font": {"size": 16, "color": INK},
        "x": 0.5,
        "xanchor": "center",
    },
    yaxis={
        "title": {"text": "Depth (m)", "font": {"size": 12, "color": INK}},
        "tickfont": {"size": 10, "color": INK_SOFT},
        "range": [198, -3],
        "dtick": 20,
        "gridcolor": GRID,
        "gridwidth": 1,
        "zeroline": False,
        "linecolor": INK_SOFT,
        "side": "left",
    },
    xaxis={"showticklabels": False, "showgrid": False, "zeroline": False, "range": [0.3, 2.2], "fixedrange": True},
    plot_bgcolor=PAGE_BG,
    paper_bgcolor=PAGE_BG,
    font={"color": INK},
    barmode="overlay",
    bargap=0,
    legend={
        "title": {"text": "<b>Lithology</b>", "font": {"size": 13, "color": INK}},
        "font": {"size": 11, "color": INK_SOFT},
        "x": 0.99,
        "y": 0.99,
        "xanchor": "right",
        "yanchor": "top",
        "bgcolor": ELEVATED_BG,
        "bordercolor": INK_SOFT,
        "borderwidth": 1,
    },
    margin={"l": 140, "r": 40, "t": 80, "b": 60},
)

# Save
fig.write_image(f"plot-{THEME}.png", width=800, height=450, scale=4)
fig.write_html(f"plot-{THEME}.html", include_plotlyjs="cdn")
Runnable source as JSON, for any HTTP client: https://api.anyplot.ai/specs/column-stratigraphic/plotly/code. Any spec id and library id listed in llms-full.txt fit the same URL shape; every URL below is complete and callable.
{
  "spec_id": "column-stratigraphic",
  "language": "python",
  "library": "plotly",
  "page": "https://anyplot.ai/column-stratigraphic/python/plotly",
  "hub": "https://anyplot.ai/column-stratigraphic",
  "code_json": "https://api.anyplot.ai/specs/column-stratigraphic/plotly/code",
  "spec_json": "https://api.anyplot.ai/specs/column-stratigraphic",
  "render_light_png": "https://storage.googleapis.com/anyplot-images/plots/column-stratigraphic/python/plotly/plot-light.png",
  "render_dark_png": "https://storage.googleapis.com/anyplot-images/plots/column-stratigraphic/python/plotly/plot-dark.png",
  "interactive_light_html": "https://storage.googleapis.com/anyplot-images/plots/column-stratigraphic/python/plotly/plot-light.html",
  "interactive_dark_html": "https://storage.googleapis.com/anyplot-images/plots/column-stratigraphic/python/plotly/plot-dark.html",
  "quality_score": 91.0,
  "license": "MIT",
  "guide": "https://anyplot.ai/llms.txt"
}
Part of Stratigraphic Column with Lithology Patterns on anyplot.ai.