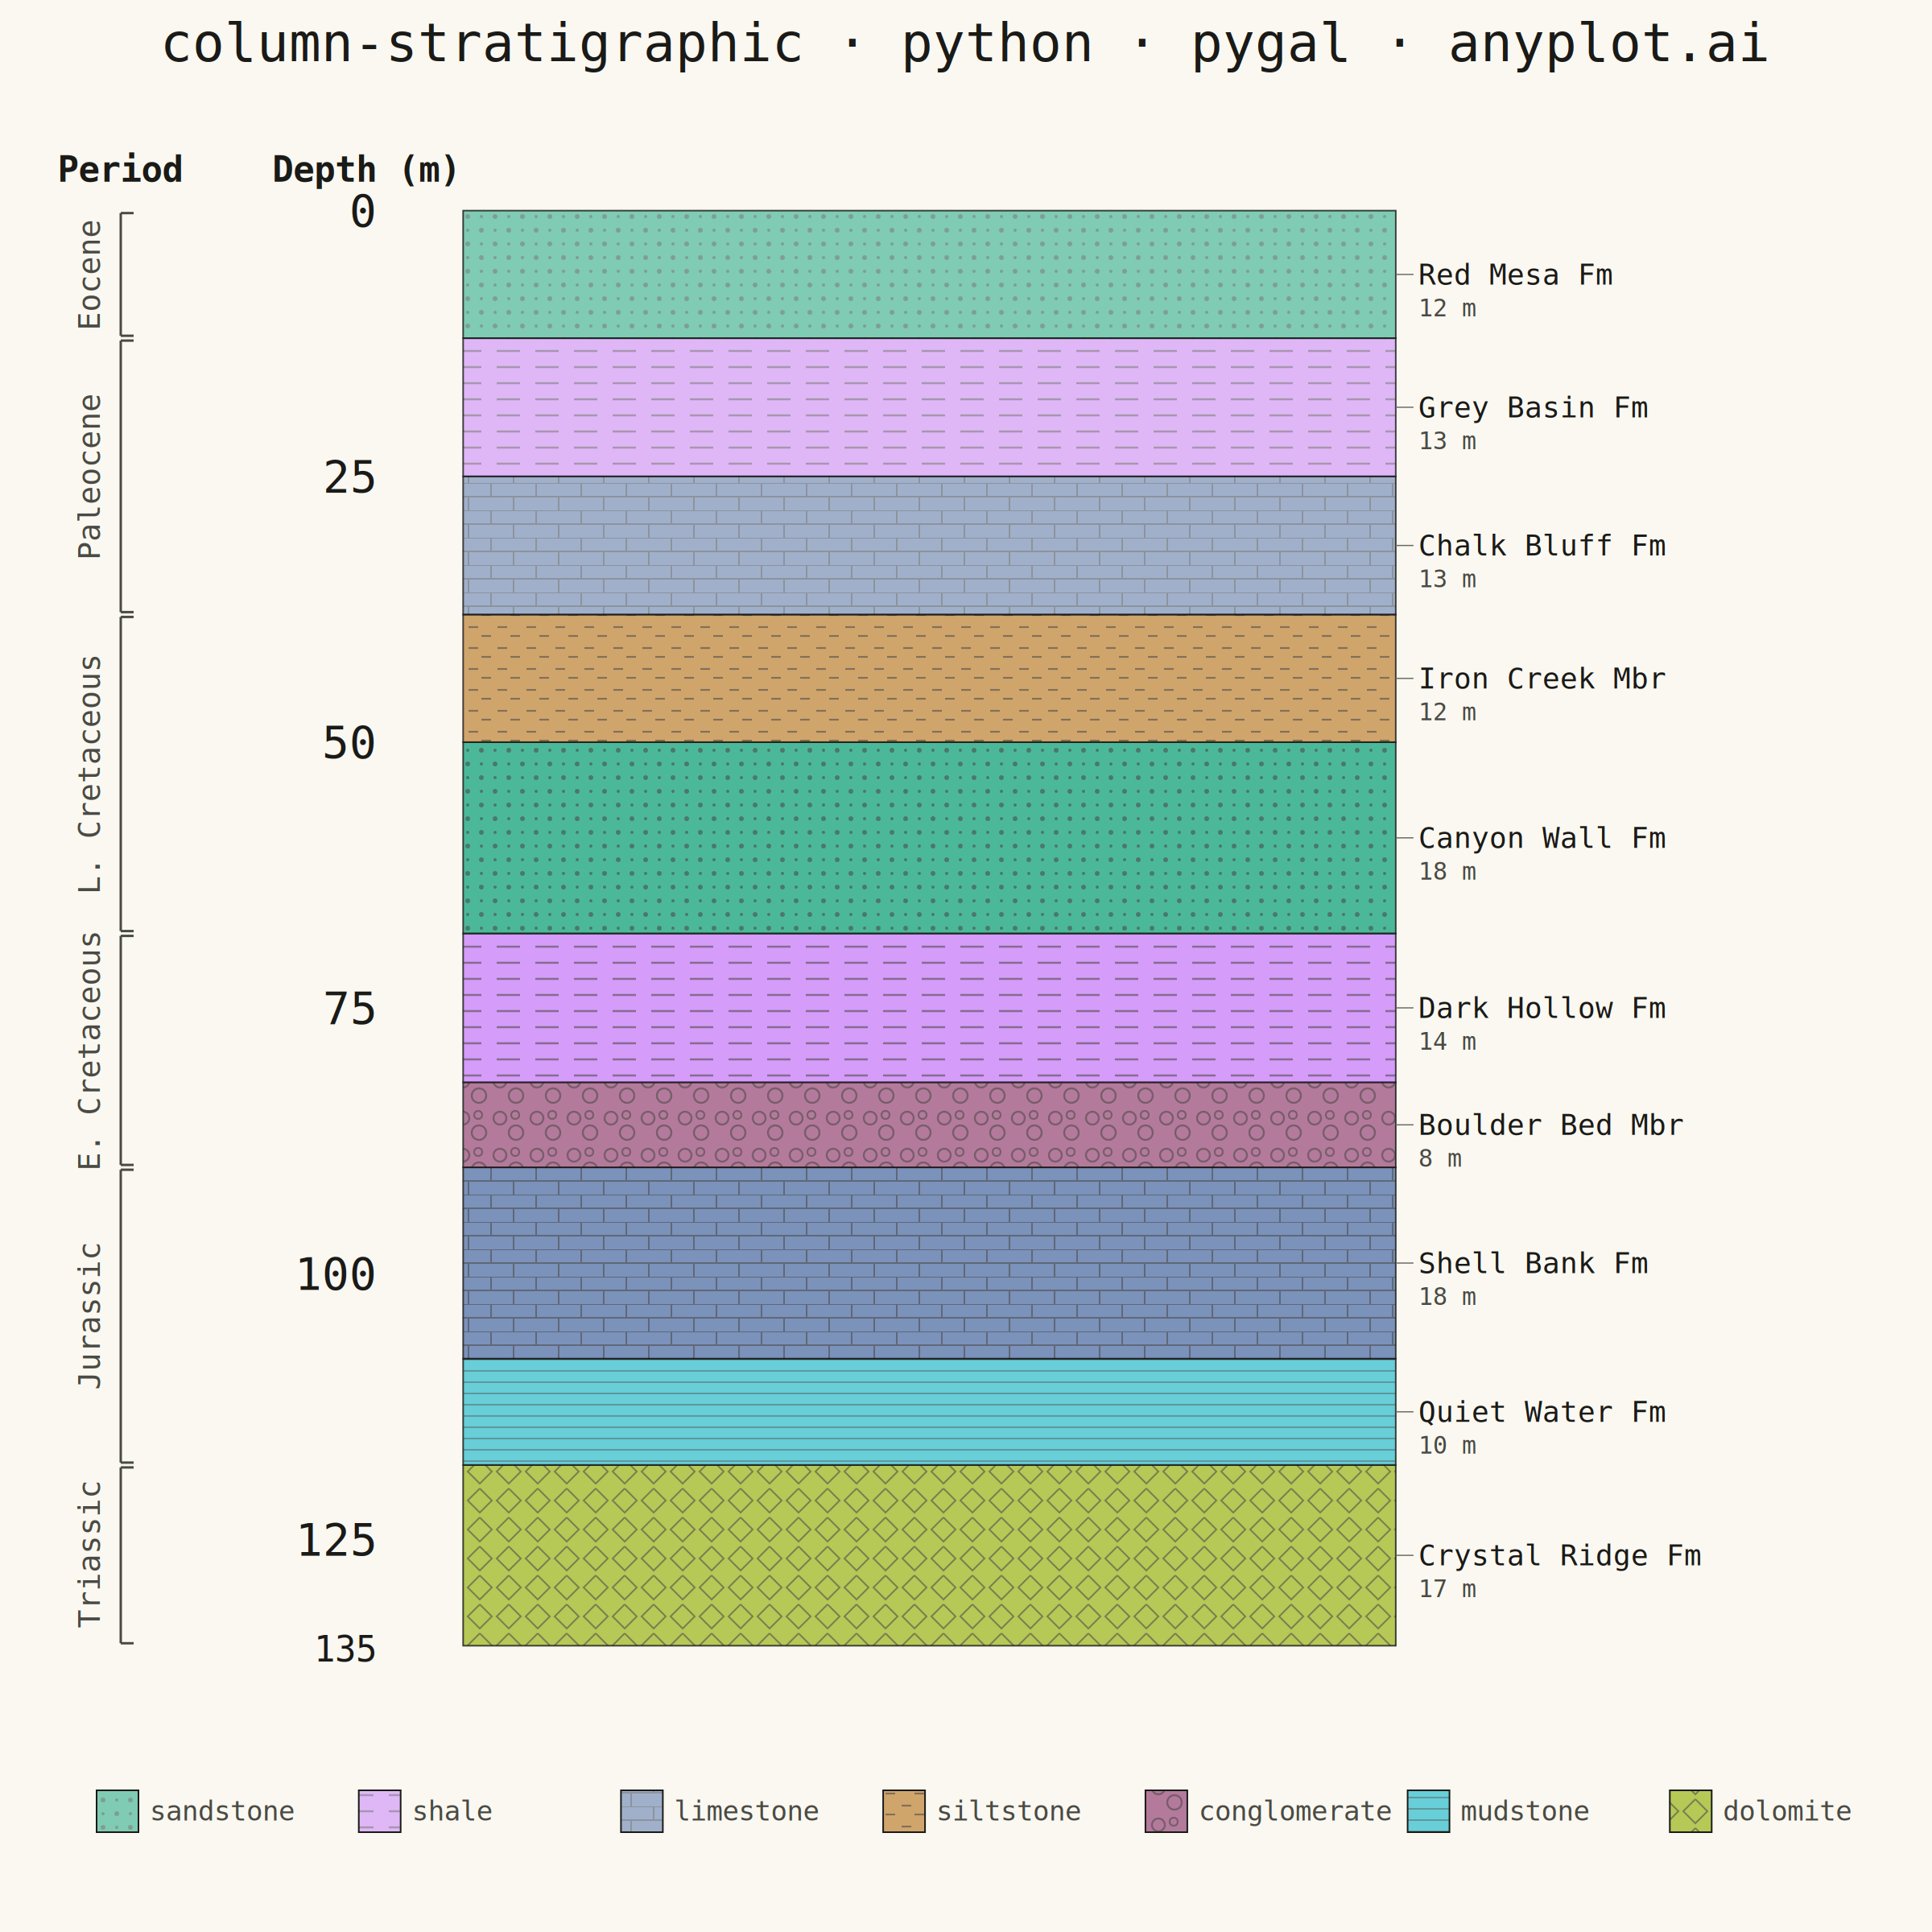
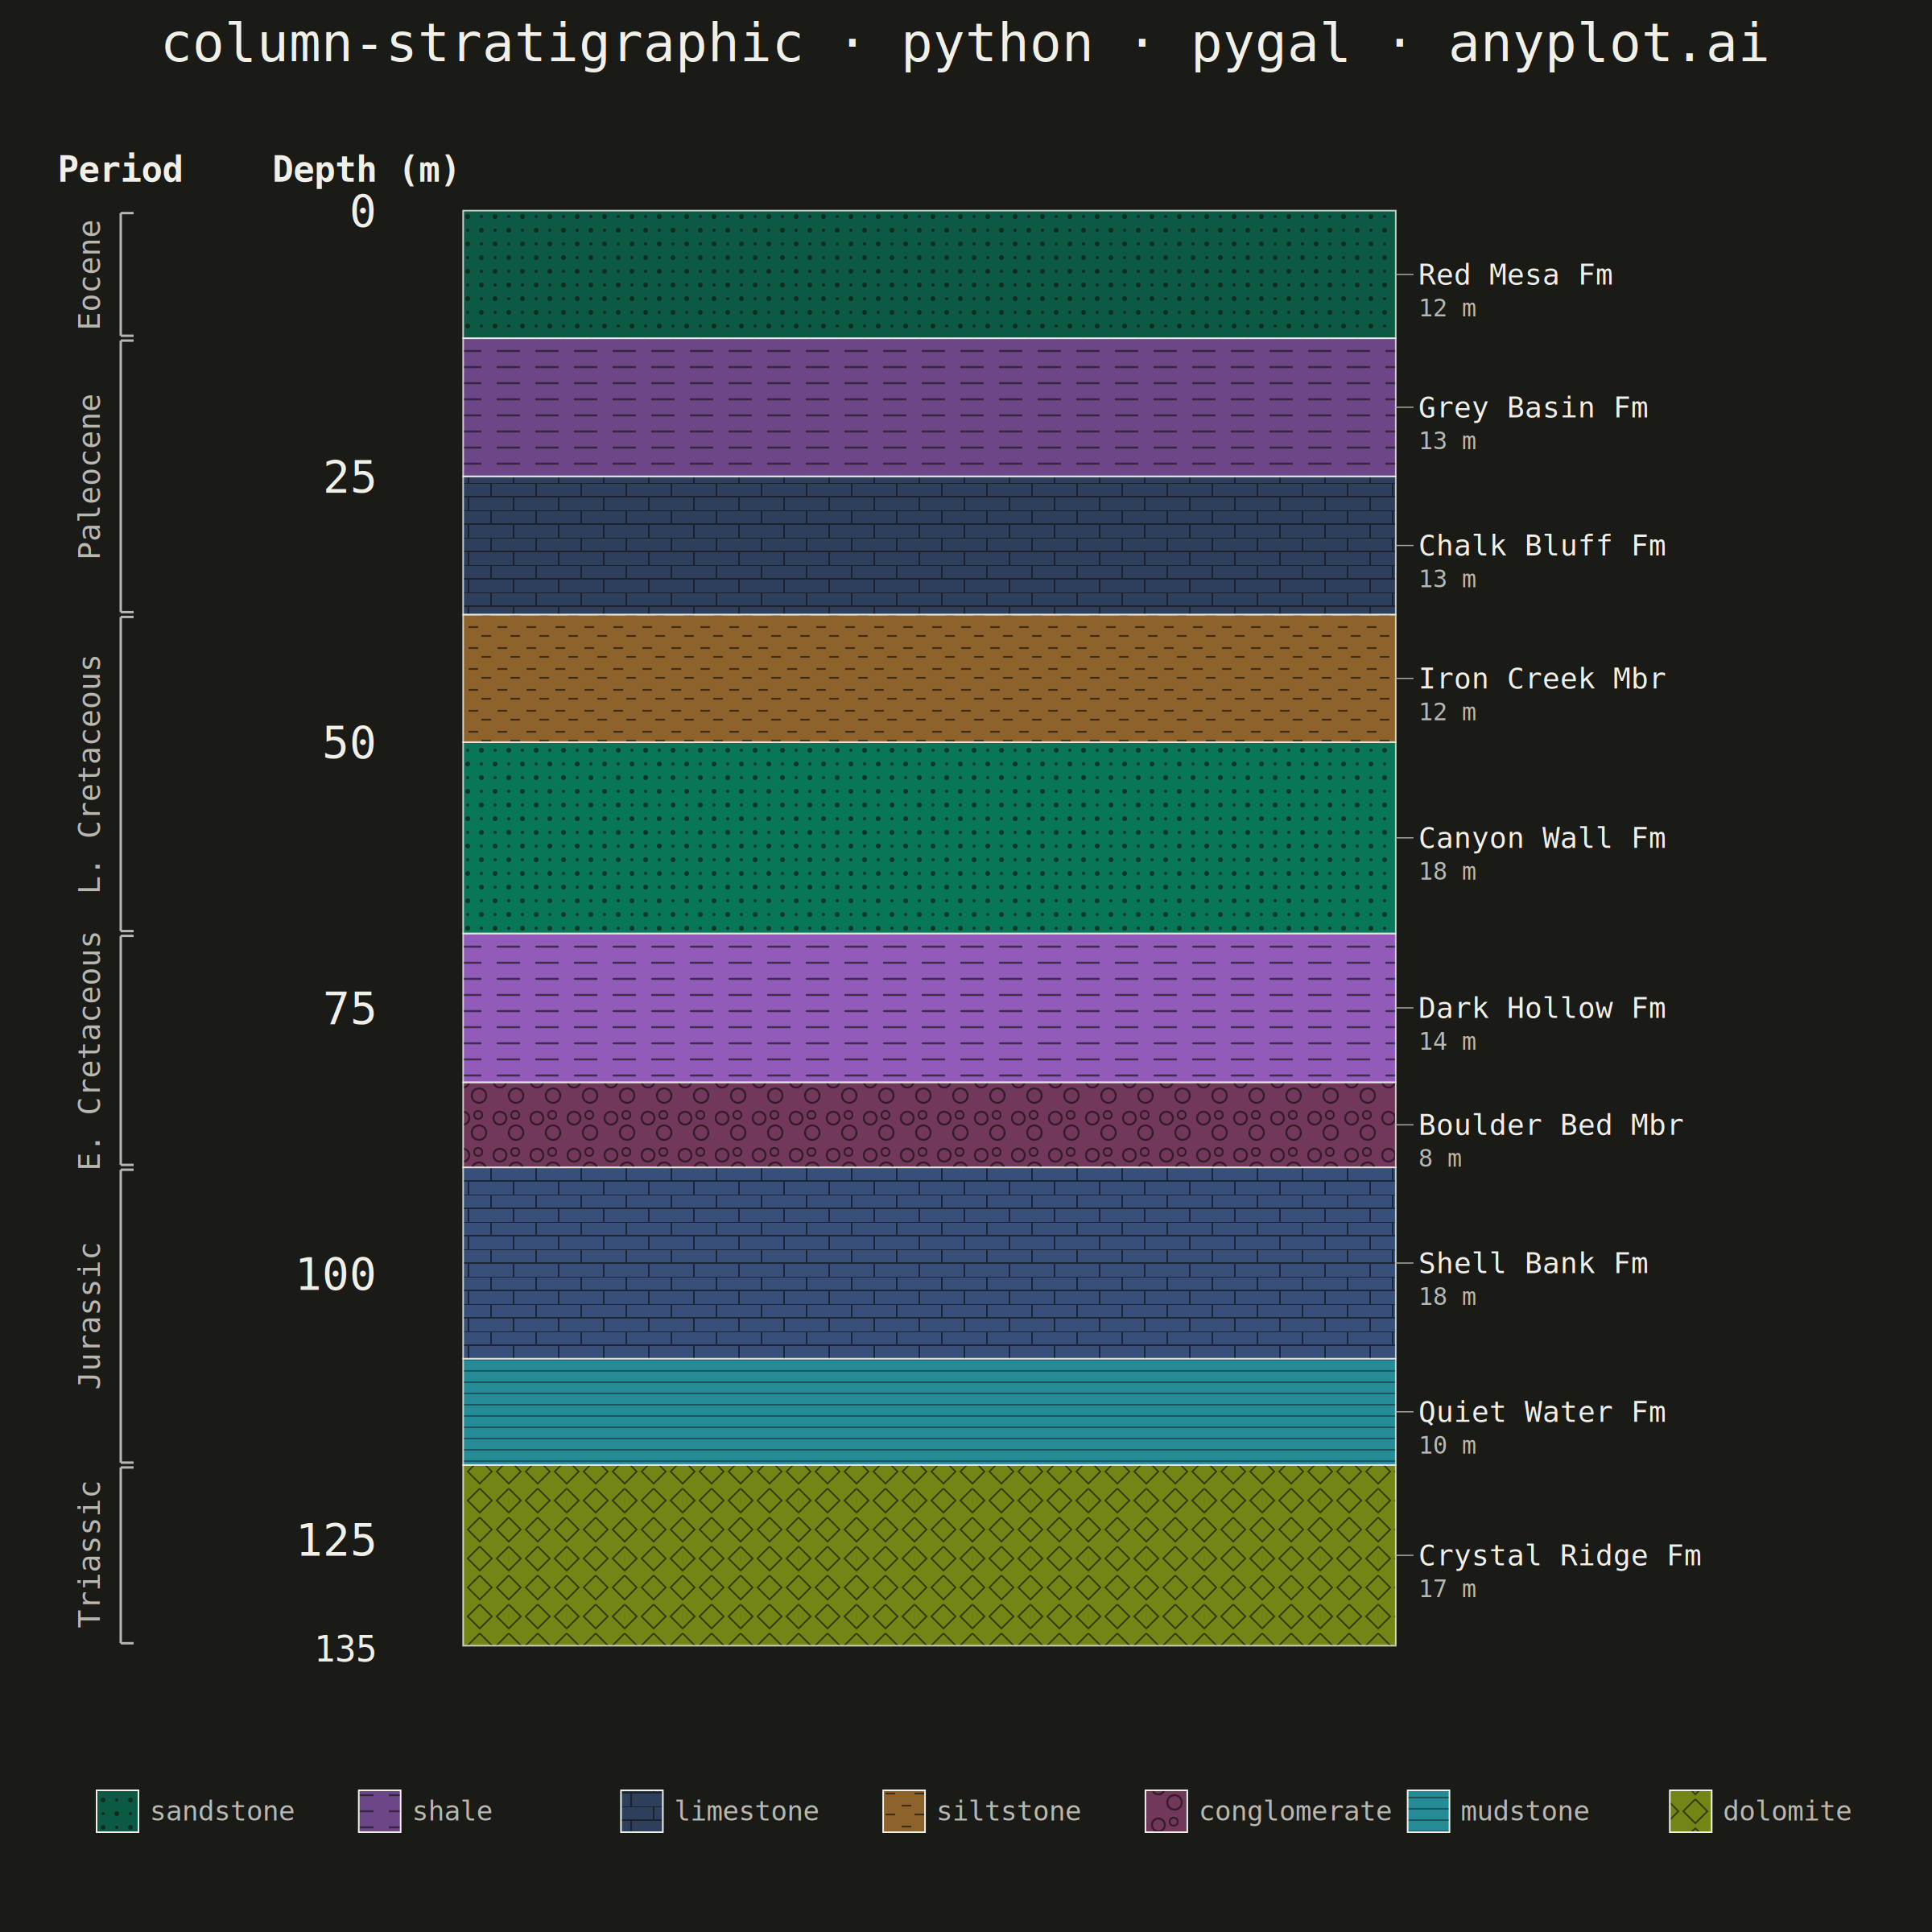
A vertical column visualization showing geological rock layers with standardized lithology patterns, formation names, ages, and thickness scales. Each layer is represented as a stacked rectangular block filled with a distinctive pattern (e.g., brick pattern for limestone, dots for sandstone, dashes for shale) following FGDC/USGS conventions. This plot is essential for communicating subsurface geology and sedimentary sequences in a compact, standardized format.
""" anyplot.ai
column-stratigraphic: Stratigraphic Column with Lithology Patterns
Library: pygal 3.1.0 | Python 3.13.13
Quality: 93/100 | Updated: 2026-06-17
"""

import os
import re
import sys


# This file is named pygal.py, so `import pygal` would resolve to it; drop the
# script's own directory from sys.path so the installed pygal package wins.
sys.path = [p for p in sys.path if os.path.abspath(p or ".") != os.path.dirname(os.path.abspath(__file__))]

import cairosvg
import pygal
from pygal.style import Style


# Theme-adaptive chrome (see prompts/default-style-guide.md "Theme-adaptive Chrome")
THEME = os.getenv("ANYPLOT_THEME", "light")
PAGE_BG = "#FAF8F1" if THEME == "light" else "#1A1A17"
INK = "#1A1A17" if THEME == "light" else "#F0EFE8"
INK_SOFT = "#4A4A44" if THEME == "light" else "#B8B7B0"
INK_MUTED = "#6B6A63" if THEME == "light" else "#A8A79F"

# Data: synthetic sedimentary section, depth increasing downward (surface = 0 m)
layers = [
    {"top": 0, "bottom": 12, "lithology": "sandstone", "formation": "Red Mesa Fm", "age": "Eocene"},
    {"top": 12, "bottom": 25, "lithology": "shale", "formation": "Grey Basin Fm", "age": "Paleocene"},
    {"top": 25, "bottom": 38, "lithology": "limestone", "formation": "Chalk Bluff Fm", "age": "Paleocene"},
    {"top": 38, "bottom": 50, "lithology": "siltstone", "formation": "Iron Creek Mbr", "age": "L. Cretaceous"},
    {"top": 50, "bottom": 68, "lithology": "sandstone", "formation": "Canyon Wall Fm", "age": "L. Cretaceous"},
    {"top": 68, "bottom": 82, "lithology": "shale", "formation": "Dark Hollow Fm", "age": "E. Cretaceous"},
    {"top": 82, "bottom": 90, "lithology": "conglomerate", "formation": "Boulder Bed Mbr", "age": "E. Cretaceous"},
    {"top": 90, "bottom": 108, "lithology": "limestone", "formation": "Shell Bank Fm", "age": "Jurassic"},
    {"top": 108, "bottom": 118, "lithology": "mudstone", "formation": "Quiet Water Fm", "age": "Jurassic"},
    {"top": 118, "bottom": 135, "lithology": "dolomite", "formation": "Crystal Ridge Fm", "age": "Triassic"},
]
total_depth = layers[-1]["bottom"]

# Lithology -> Imprint palette (first lithology = brand green #009E73). Patterns,
# not hue, carry the geological meaning; distinct hues keep the 7 rock types apart.
LITH_COLOR = {
    "sandstone": "#009E73",
    "shale": "#C475FD",
    "limestone": "#4467A3",
    "siltstone": "#BD8233",
    "conglomerate": "#954477",
    "mudstone": "#2ABCCD",
    "dolomite": "#99B314",
}
# Darkened tone for each pattern's hatch marks (theme-independent, like the fill)
LITH_MARK = {
    lith: "#%02X%02X%02X" % tuple(int(c[i : i + 2], 16) * 42 // 100 for i in (1, 3, 5))
    for lith, c in LITH_COLOR.items()
}

# Title fontsize scales with title length off the 67-char baseline
title = "column-stratigraphic · python · pygal · anyplot.ai"
title_fs = max(44, round(66 * min(1.0, 67 / len(title))))

custom_style = Style(
    background=PAGE_BG,
    plot_background=PAGE_BG,
    foreground=INK,
    foreground_strong=INK,
    foreground_subtle=INK_MUTED,
    colors=tuple(LITH_COLOR[layer["lithology"]] for layer in reversed(layers)),
    title_font_size=title_fs,
    label_font_size=56,
    major_label_font_size=44,
    legend_font_size=44,
    value_font_size=36,
    font_family="'DejaVu Sans Mono', 'Courier New', monospace",
    title_font_family="'DejaVu Sans Mono', 'Courier New', monospace",
    label_font_family="'DejaVu Sans Mono', 'Courier New', monospace",
    stroke_width=2,
)

# Depth axis: bars stack upward from the base, but ticks read as depth-down
depth_ticks = [0, 25, 50, 75, 100, 125, total_depth]

chart = pygal.StackedBar(
    width=2400,
    height=2400,
    style=custom_style,
    title=title,
    show_legend=False,
    show_x_labels=False,
    show_y_labels=True,
    print_values=False,
    show_y_guides=False,
    show_x_guides=False,
    range=(0, total_depth),
    margin_top=150,
    margin_left=360,
    margin_right=560,
    margin_bottom=320,
    explicit_size=True,
)
chart.y_labels = [{"value": total_depth - d, "label": str(d)} for d in depth_ticks]

# Oldest layer first -> sits at the base; youngest ends up on top (surface)
for layer in reversed(layers):
    thickness = layer["bottom"] - layer["top"]
    chart.add(layer["formation"], [{"value": thickness, "label": layer["lithology"].title()}])

svg = chart.render().decode("utf-8")

# --- Lithology fill patterns (FGDC-style), injected into the SVG <defs> ---
patterns_svg = ""
for lith, base in LITH_COLOR.items():
    mark = LITH_MARK[lith]
    head = f'<pattern id="pat-{lith}" patternUnits="userSpaceOnUse"'
    if lith == "sandstone":  # stipple dots
        patterns_svg += (
            f'{head} width="34" height="34"><rect width="34" height="34" fill="{base}"/>'
            f'<circle cx="9" cy="9" r="3" fill="{mark}"/><circle cx="26" cy="26" r="3" fill="{mark}"/>'
            f'<circle cx="26" cy="9" r="2" fill="{mark}"/><circle cx="9" cy="26" r="2" fill="{mark}"/></pattern>'
        )
    elif lith == "shale":  # horizontal dashes
        patterns_svg += (
            f'{head} width="48" height="20"><rect width="48" height="20" fill="{base}"/>'
            f'<line x1="3" y1="10" x2="32" y2="10" stroke="{mark}" stroke-width="2.5"/></pattern>'
        )
    elif lith == "limestone":  # brick / blocky carbonate
        patterns_svg += (
            f'{head} width="56" height="34"><rect width="56" height="34" fill="{base}"/>'
            f'<line x1="0" y1="0" x2="56" y2="0" stroke="{mark}" stroke-width="2"/>'
            f'<line x1="0" y1="17" x2="56" y2="17" stroke="{mark}" stroke-width="2"/>'
            f'<line x1="28" y1="0" x2="28" y2="17" stroke="{mark}" stroke-width="2"/>'
            f'<line x1="0" y1="17" x2="0" y2="34" stroke="{mark}" stroke-width="2"/>'
            f'<line x1="56" y1="17" x2="56" y2="34" stroke="{mark}" stroke-width="2"/></pattern>'
        )
    elif lith == "siltstone":  # short broken dashes
        patterns_svg += (
            f'{head} width="36" height="26"><rect width="36" height="26" fill="{base}"/>'
            f'<line x1="4" y1="7" x2="16" y2="7" stroke="{mark}" stroke-width="2.2"/>'
            f'<line x1="20" y1="18" x2="32" y2="18" stroke="{mark}" stroke-width="2.2"/></pattern>'
        )
    elif lith == "conglomerate":  # pebble outlines
        patterns_svg += (
            f'{head} width="46" height="46"><rect width="46" height="46" fill="{base}"/>'
            f'<circle cx="13" cy="13" r="8" fill="none" stroke="{mark}" stroke-width="2.4"/>'
            f'<circle cx="33" cy="31" r="9" fill="none" stroke="{mark}" stroke-width="2.4"/>'
            f'<circle cx="32" cy="9" r="5" fill="none" stroke="{mark}" stroke-width="2.2"/></pattern>'
        )
    elif lith == "mudstone":  # fine horizontal laminations
        patterns_svg += (
            f'{head} width="30" height="14"><rect width="30" height="14" fill="{base}"/>'
            f'<line x1="0" y1="7" x2="30" y2="7" stroke="{mark}" stroke-width="1.4"/></pattern>'
        )
    else:  # dolomite -> rhombs
        patterns_svg += (
            f'{head} width="36" height="36"><rect width="36" height="36" fill="{base}"/>'
            f'<polyline points="18,3 33,18 18,33 3,18 18,3" fill="none" '
            f'stroke="{mark}" stroke-width="2"/></pattern>'
        )

svg = svg.replace("<defs>", "<defs>" + patterns_svg, 1)

# Swap each lithology's flat CSS fill for its pattern; recolor bar edges to ink
for lith, color in LITH_COLOR.items():
    svg = svg.replace(f"fill:{color}", f"fill:url(#pat-{lith})")
svg = svg.replace("</style>", f".rect.reactive{{stroke:{INK};stroke-width:2.5}}</style>", 1)

# --- Locate the plot group offset and parse the stacked bar rectangles ---
tx, ty = 0.0, 0.0
plot_m = re.search(r'<g transform="translate\(([\d.]+),\s*([\d.]+)\)" class="plot">', svg)
if plot_m:
    tx, ty = float(plot_m.group(1)), float(plot_m.group(2))

bars = []
for m in re.finditer(r'<rect ([^>]*?)class="rect reactive[^>]*>', svg):
    a = m.group(1)
    xm = re.search(r'x="([\d.]+)"', a)
    ym = re.search(r'y="([\d.]+)"', a)
    wm = re.search(r'width="([\d.]+)"', a)
    hm = re.search(r'height="([\d.]+)"', a)
    if xm and ym and wm and hm:
        bars.append(
            {
                "x": float(xm.group(1)) + tx,
                "y": float(ym.group(1)) + ty,
                "w": float(wm.group(1)),
                "h": float(hm.group(1)),
            }
        )

# Top (smallest y) = youngest = layers[0]; order matches `layers` directly
bars.sort(key=lambda b: b["y"])
overlay = []

if bars:
    bar_left = bars[0]["x"]
    bar_right = bars[0]["x"] + bars[0]["w"]
    form_x = bar_right + 28
    age_x = 150.0

    # Depth axis caption (units) at the top of the left margin
    overlay.append(
        f'<text x="{bar_left - 10:.1f}" y="{bars[0]["y"] - 36:.1f}" '
        f'font-family="DejaVu Sans Mono, monospace" font-size="44" fill="{INK}" '
        f'text-anchor="end" font-weight="bold">Depth (m)</text>'
    )

    # Formation labels to the right of each layer, with a short leader line
    for layer, bar in zip(layers, bars, strict=False):
        cy = bar["y"] + bar["h"] / 2
        thickness = layer["bottom"] - layer["top"]
        overlay.append(
            f'<line x1="{bar_right:.1f}" y1="{cy:.1f}" x2="{form_x - 6:.1f}" y2="{cy:.1f}" '
            f'stroke="{INK_MUTED}" stroke-width="1.5"/>'
        )
        overlay.append(
            f'<text x="{form_x:.1f}" y="{cy:.1f}" '
            f'font-family="DejaVu Sans Mono, monospace" font-size="36" fill="{INK}" '
            f'text-anchor="start" dominant-baseline="central">{layer["formation"]}</text>'
        )
        overlay.append(
            f'<text x="{form_x:.1f}" y="{cy + 42:.1f}" '
            f'font-family="DejaVu Sans Mono, monospace" font-size="30" fill="{INK_SOFT}" '
            f'text-anchor="start" dominant-baseline="central">{thickness} m</text>'
        )

    # Age-period brackets on the far left, grouping consecutive same-age layers
    groups = []
    cur = layers[0]["age"]
    grp = [bars[0]]
    for layer, bar in list(zip(layers, bars, strict=False))[1:]:
        if layer["age"] != cur:
            groups.append({"age": cur, "bars": grp})
            cur, grp = layer["age"], [bar]
        else:
            grp.append(bar)
    groups.append({"age": cur, "bars": grp})

    overlay.append(
        f'<text x="{age_x:.1f}" y="{bars[0]["y"] - 36:.1f}" '
        f'font-family="DejaVu Sans Mono, monospace" font-size="44" fill="{INK}" '
        f'text-anchor="middle" font-weight="bold">Period</text>'
    )
    for g in groups:
        ys = [b["y"] for b in g["bars"]] + [b["y"] + b["h"] for b in g["bars"]]
        y_top, y_bot = min(ys) + 3, max(ys) - 3
        y_mid = (y_top + y_bot) / 2
        overlay.append(
            f'<line x1="{age_x:.1f}" y1="{y_top:.1f}" x2="{age_x:.1f}" y2="{y_bot:.1f}" '
            f'stroke="{INK_SOFT}" stroke-width="3"/>'
            f'<line x1="{age_x:.1f}" y1="{y_top:.1f}" x2="{age_x + 16:.1f}" y2="{y_top:.1f}" '
            f'stroke="{INK_SOFT}" stroke-width="3"/>'
            f'<line x1="{age_x:.1f}" y1="{y_bot:.1f}" x2="{age_x + 16:.1f}" y2="{y_bot:.1f}" '
            f'stroke="{INK_SOFT}" stroke-width="3"/>'
        )
        overlay.append(
            f'<text x="{age_x - 26:.1f}" y="{y_mid:.1f}" '
            f'transform="rotate(-90 {age_x - 26:.1f} {y_mid:.1f})" '
            f'font-family="DejaVu Sans Mono, monospace" font-size="38" fill="{INK_SOFT}" '
            f'text-anchor="middle">{g["age"]}</text>'
        )

    # Bottom legend: one swatch per unique lithology, in first-appearance order
    seen = []
    for layer in layers:
        if layer["lithology"] not in seen:
            seen.append(layer["lithology"])
    sw = 52
    gap = (2400 - 120) / len(seen)
    leg_y = 2400 - 150
    for i, lith in enumerate(seen):
        lx = 120 + i * gap
        overlay.append(
            f'<rect x="{lx:.1f}" y="{leg_y - sw / 2:.1f}" width="{sw}" height="{sw}" '
            f'fill="url(#pat-{lith})" stroke="{INK}" stroke-width="2"/>'
        )
        overlay.append(
            f'<text x="{lx + sw + 14:.1f}" y="{leg_y:.1f}" '
            f'font-family="DejaVu Sans Mono, monospace" font-size="34" fill="{INK_SOFT}" '
            f'text-anchor="start" dominant-baseline="central">{lith}</text>'
        )

svg = svg.replace("</svg>", "\n".join(overlay) + "\n</svg>")
svg = svg.replace(">No data<", "><")

# Save interactive HTML (pygal's SVG keeps tooltips) and rasterised PNG
with open(f"plot-{THEME}.html", "w") as f:
    f.write(svg)
cairosvg.svg2png(bytestring=svg.encode(), write_to=f"plot-{THEME}.png", output_width=2400, output_height=2400)
Runnable source as JSON, for any HTTP client: https://api.anyplot.ai/specs/column-stratigraphic/pygal/code. Any spec id and library id listed in llms-full.txt fit the same URL shape; every URL below is complete and callable.
{
  "spec_id": "column-stratigraphic",
  "language": "python",
  "library": "pygal",
  "page": "https://anyplot.ai/column-stratigraphic/python/pygal",
  "hub": "https://anyplot.ai/column-stratigraphic",
  "code_json": "https://api.anyplot.ai/specs/column-stratigraphic/pygal/code",
  "spec_json": "https://api.anyplot.ai/specs/column-stratigraphic",
  "render_light_png": "https://storage.googleapis.com/anyplot-images/plots/column-stratigraphic/python/pygal/plot-light.png",
  "render_dark_png": "https://storage.googleapis.com/anyplot-images/plots/column-stratigraphic/python/pygal/plot-dark.png",
  "interactive_light_html": "https://storage.googleapis.com/anyplot-images/plots/column-stratigraphic/python/pygal/plot-light.html",
  "interactive_dark_html": "https://storage.googleapis.com/anyplot-images/plots/column-stratigraphic/python/pygal/plot-dark.html",
  "quality_score": 93.0,
  "license": "MIT",
  "guide": "https://anyplot.ai/llms.txt"
}
Part of Stratigraphic Column with Lithology Patterns on anyplot.ai.