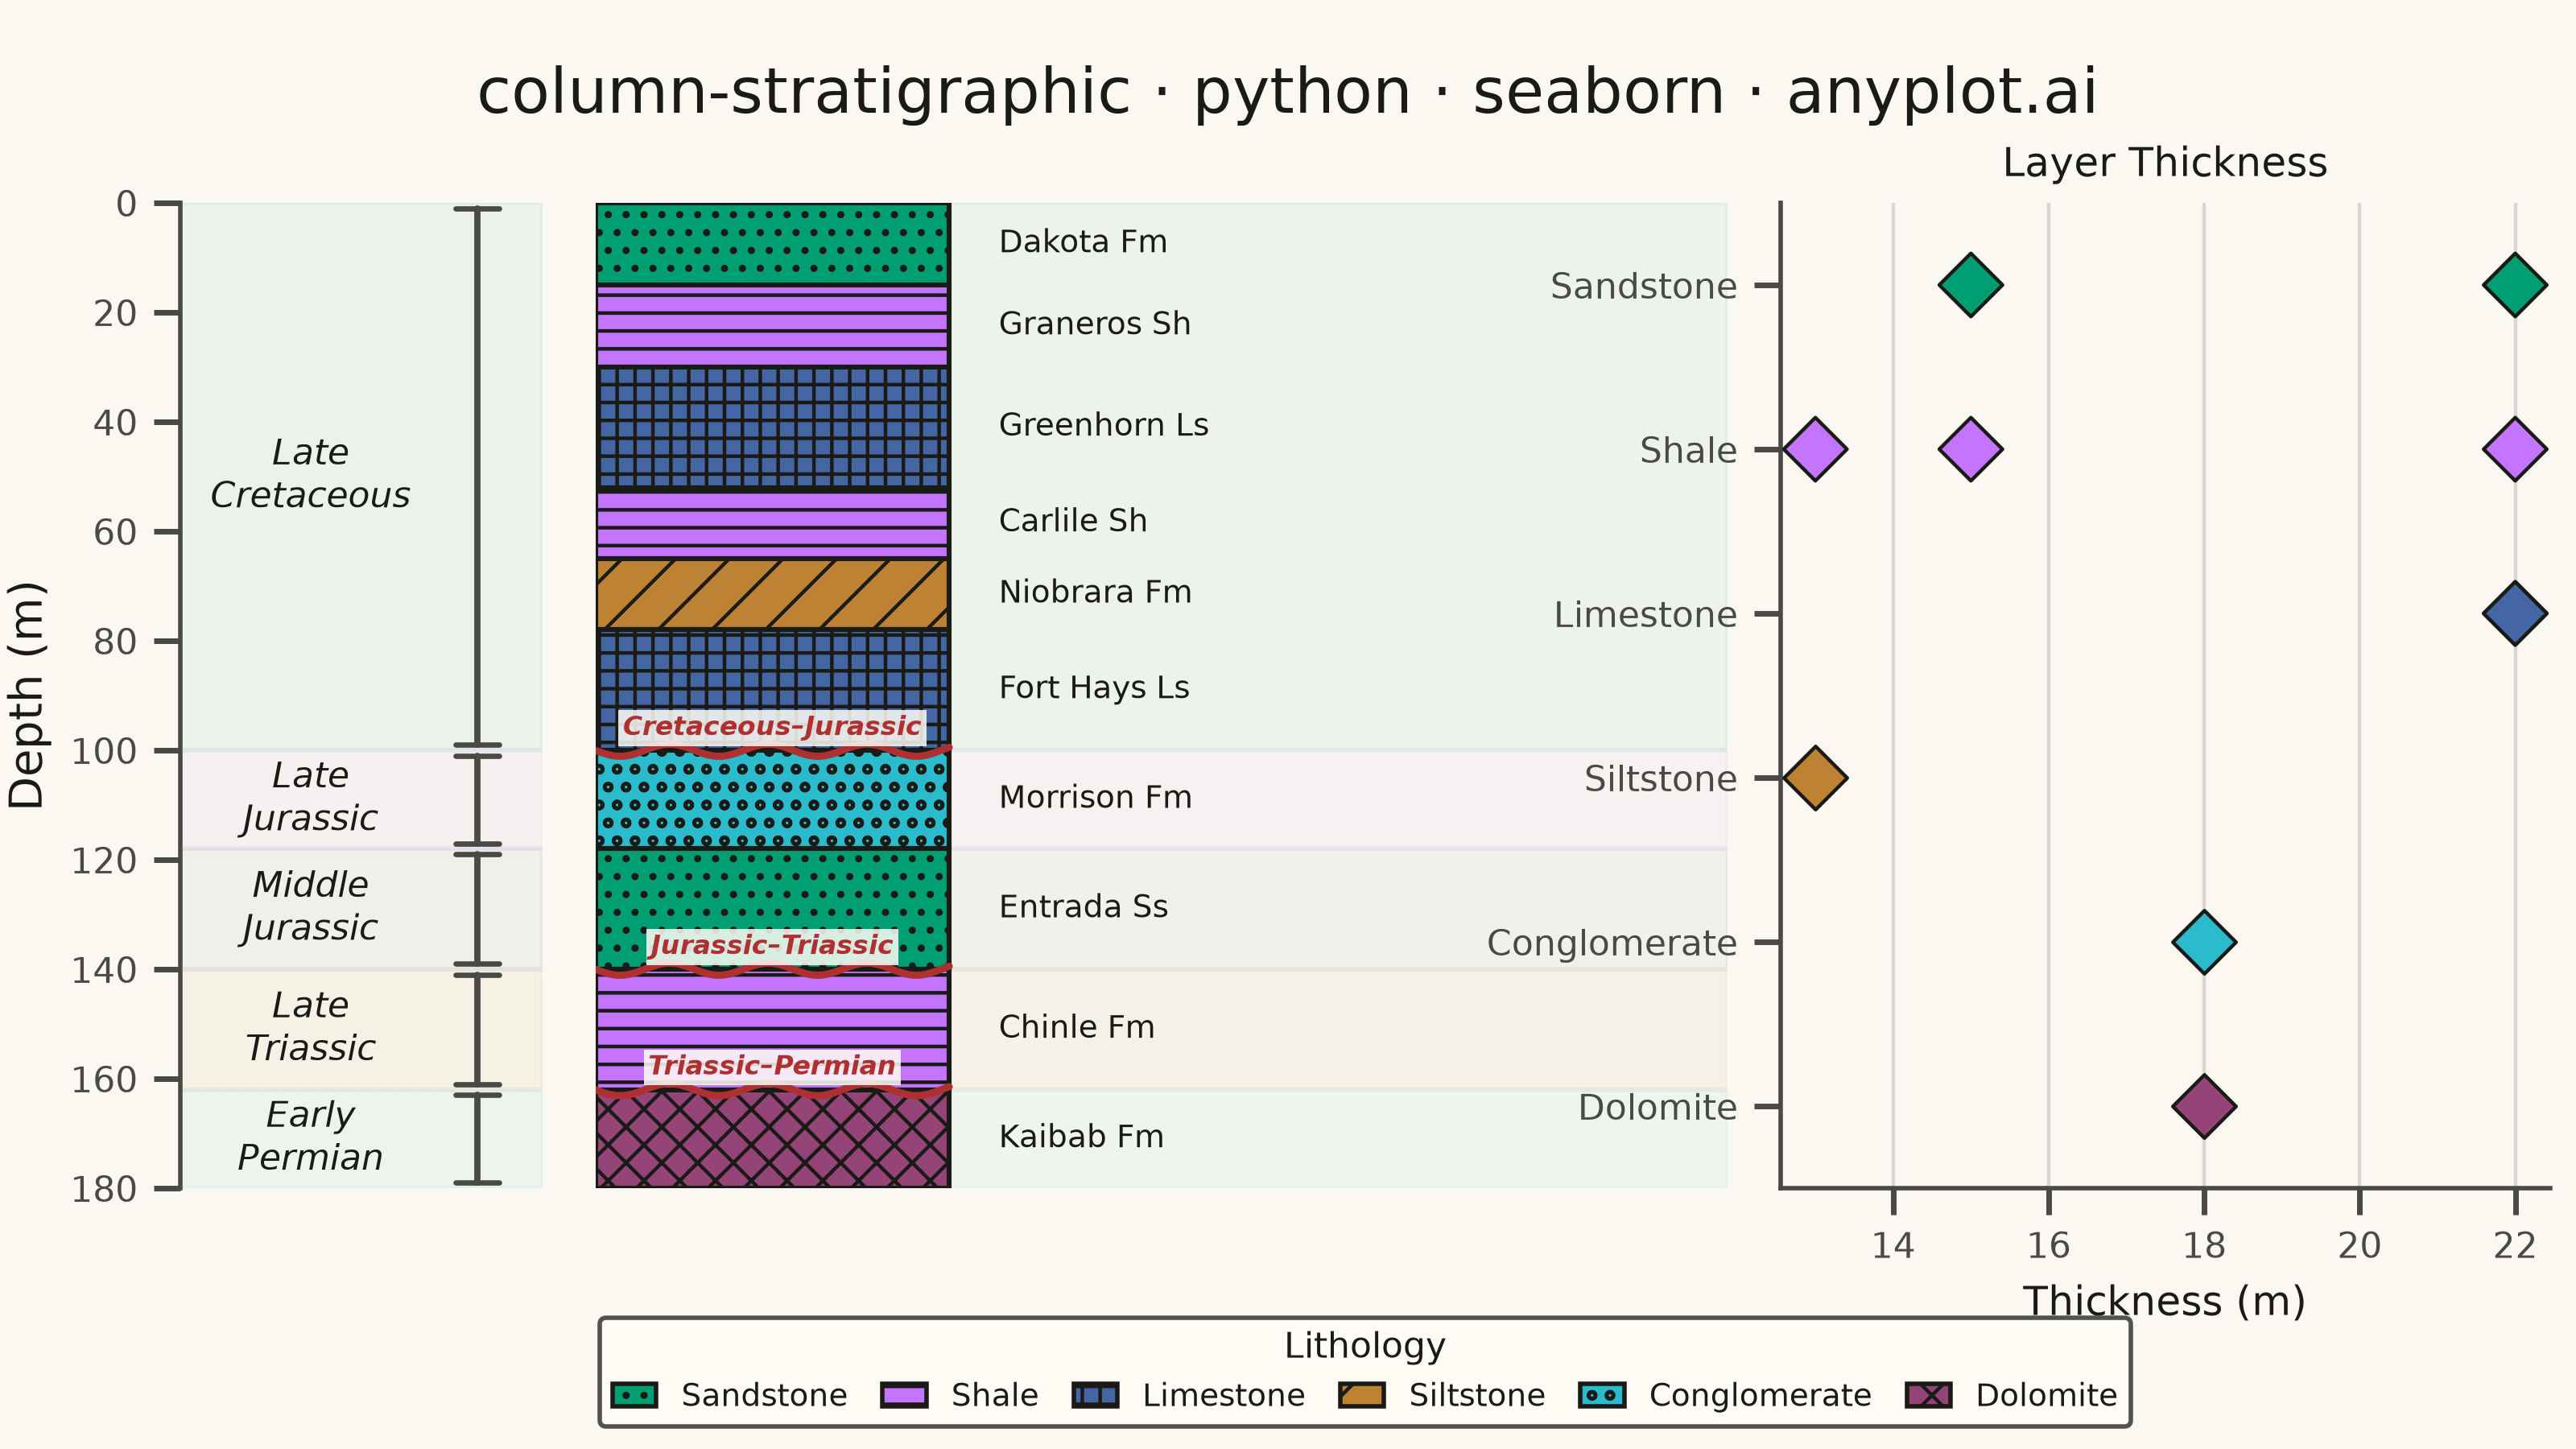
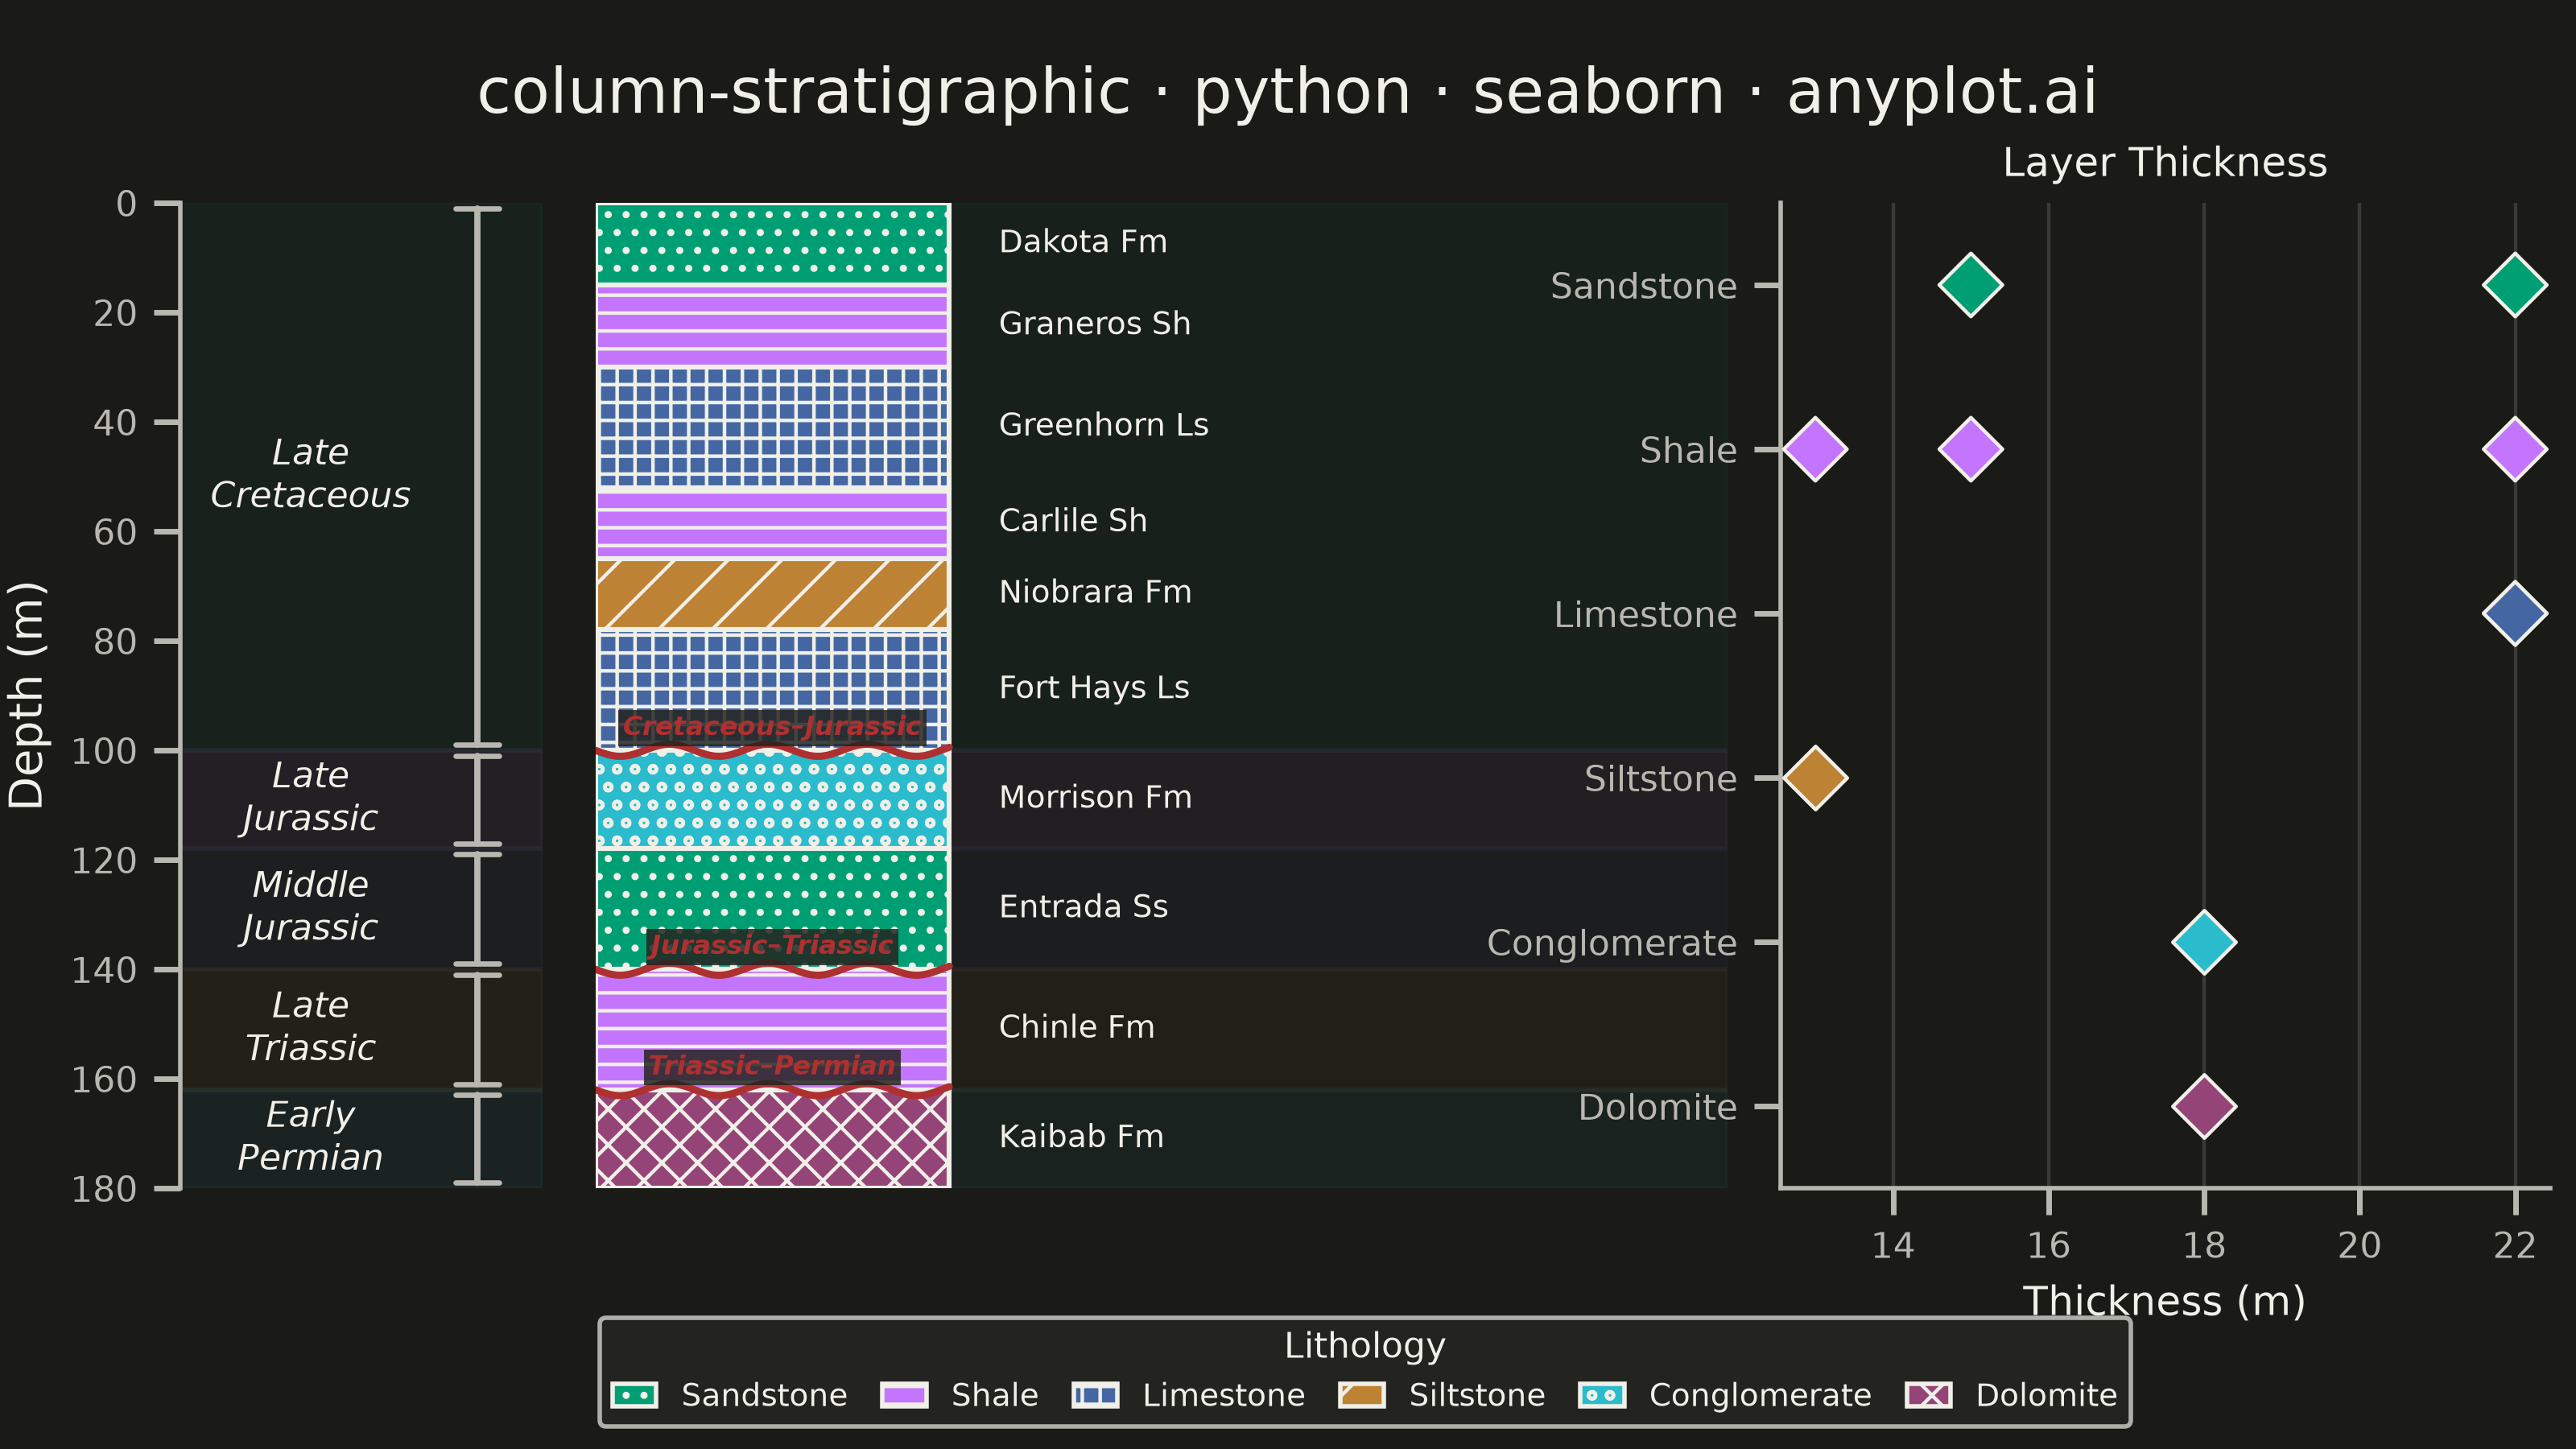
A vertical column visualization showing geological rock layers with standardized lithology patterns, formation names, ages, and thickness scales. Each layer is represented as a stacked rectangular block filled with a distinctive pattern (e.g., brick pattern for limestone, dots for sandstone, dashes for shale) following FGDC/USGS conventions. This plot is essential for communicating subsurface geology and sedimentary sequences in a compact, standardized format.
""" anyplot.ai
column-stratigraphic: Stratigraphic Column with Lithology Patterns
Library: seaborn 0.13.2 | Python 3.13.13
Quality: 92/100 | Updated: 2026-06-17
"""

import os

import matplotlib.patches as mpatches
import matplotlib.pyplot as plt
import numpy as np
import pandas as pd
import seaborn as sns


# Theme tokens (see prompts/default-style-guide.md "Theme-adaptive Chrome")
THEME = os.getenv("ANYPLOT_THEME", "light")
PAGE_BG = "#FAF8F1" if THEME == "light" else "#1A1A17"
ELEVATED_BG = "#FFFDF6" if THEME == "light" else "#242420"
INK = "#1A1A17" if THEME == "light" else "#F0EFE8"
INK_SOFT = "#4A4A44" if THEME == "light" else "#B8B7B0"

# Imprint palette — first lithology is always brand green; matte-red (#AE3030)
# is deliberately skipped here and reserved as the semantic boundary marker.
IMPRINT_PALETTE = ["#009E73", "#C475FD", "#4467A3", "#BD8233", "#2ABCCD", "#954477"]
UNCONF_RED = "#AE3030"  # Imprint matte-red — semantic unconformity anchor

sns.set_theme(
    style="ticks",
    rc={
        "figure.facecolor": PAGE_BG,
        "axes.facecolor": PAGE_BG,
        "axes.edgecolor": INK_SOFT,
        "axes.labelcolor": INK,
        "text.color": INK,
        "xtick.color": INK_SOFT,
        "ytick.color": INK_SOFT,
        "axes.linewidth": 1.0,
        "patch.linewidth": 1.0,
        "hatch.linewidth": 0.8,
    },
)

# Data — synthetic sedimentary section (Western Interior Seaway)
layers = [
    {"top": 0, "bottom": 15, "lithology": "sandstone", "formation": "Dakota Fm", "age": "Late Cretaceous"},
    {"top": 15, "bottom": 30, "lithology": "shale", "formation": "Graneros Sh", "age": "Late Cretaceous"},
    {"top": 30, "bottom": 52, "lithology": "limestone", "formation": "Greenhorn Ls", "age": "Late Cretaceous"},
    {"top": 52, "bottom": 65, "lithology": "shale", "formation": "Carlile Sh", "age": "Late Cretaceous"},
    {"top": 65, "bottom": 78, "lithology": "siltstone", "formation": "Niobrara Fm", "age": "Late Cretaceous"},
    {"top": 78, "bottom": 100, "lithology": "limestone", "formation": "Fort Hays Ls", "age": "Late Cretaceous"},
    {"top": 100, "bottom": 118, "lithology": "conglomerate", "formation": "Morrison Fm", "age": "Late Jurassic"},
    {"top": 118, "bottom": 140, "lithology": "sandstone", "formation": "Entrada Ss", "age": "Middle Jurassic"},
    {"top": 140, "bottom": 162, "lithology": "shale", "formation": "Chinle Fm", "age": "Late Triassic"},
    {"top": 162, "bottom": 180, "lithology": "dolomite", "formation": "Kaibab Fm", "age": "Early Permian"},
]

df = pd.DataFrame(layers)
df["thickness"] = df["bottom"] - df["top"]
df["mid_depth"] = (df["top"] + df["bottom"]) / 2

# Lithology styling — Imprint colors + hatch approximations of FGDC/USGS symbols
lith_order = ["sandstone", "shale", "limestone", "siltstone", "conglomerate", "dolomite"]
lith_hatch = {
    "sandstone": "...",  # stipple dots
    "shale": "---",  # horizontal dashes
    "limestone": "+++",  # brick / grid
    "siltstone": "//",  # diagonal dashes
    "conglomerate": "ooo",  # clasts / pebbles
    "dolomite": "xxx",  # rhombic
}
lith_label = {name: name.title() for name in lith_order}
lith_color = {name: IMPRINT_PALETTE[i] for i, name in enumerate(lith_order)}

total_depth = 180
col_width = 0.5

# Geological-age extents (min top → max bottom across that age's layers)
age_order = ["Late Cretaceous", "Late Jurassic", "Middle Jurassic", "Late Triassic", "Early Permian"]
age_spans = {age: (df[df["age"] == age]["top"].min(), df[df["age"] == age]["bottom"].max()) for age in age_order}
age_tint = dict(zip(age_order, IMPRINT_PALETTE[:5], strict=True))

# Plot — three panels: geological age | stratigraphic column | layer thickness
fig, (ax_age, ax, ax_thick) = plt.subplots(
    1, 3, figsize=(8, 4.5), dpi=400, width_ratios=[0.16, 0.50, 0.34], facecolor=PAGE_BG
)
for a in (ax_age, ax, ax_thick):
    a.set_facecolor(PAGE_BG)

# Stratigraphic column — bars drawn directly at true depth coordinates (no
# categorical-to-continuous repositioning). barh centers on mid_depth.
for _, row in df.iterrows():
    ax.barh(
        row["mid_depth"],
        col_width,
        height=row["thickness"],
        color=lith_color[row["lithology"]],
        hatch=lith_hatch[row["lithology"]],
        edgecolor=INK,
        linewidth=1.1,
        zorder=3,
    )

ax.set_ylim(total_depth, 0)  # depth increases downward (borehole convention)
ax.set_xlim(0, 1.6)

# Formation names to the right of each layer
for _, row in df.iterrows():
    ax.text(
        col_width + 0.07,
        row["mid_depth"],
        row["formation"],
        fontsize=7,
        fontweight="medium",
        va="center",
        ha="left",
        color=INK,
    )

# Major unconformities — wavy red boundary lines with labels
unconformities = [(100, "Cretaceous–Jurassic"), (140, "Jurassic–Triassic"), (162, "Triassic–Permian")]
for depth, label in unconformities:
    x_wave = np.linspace(0, col_width, 120)
    y_wave = depth + 1.1 * np.sin(x_wave * 45)
    ax.plot(x_wave, y_wave, color=UNCONF_RED, linewidth=1.6, zorder=5, solid_capstyle="round")
    ax.text(
        col_width / 2,
        depth - 1.6,
        label,
        fontsize=6,
        fontweight="bold",
        fontstyle="italic",
        va="bottom",
        ha="center",
        color=UNCONF_RED,
        zorder=6,
        bbox={"facecolor": ELEVATED_BG, "edgecolor": "none", "alpha": 0.85, "pad": 1.0},
    )

ax.set_xticks([])
ax.set_yticks([])
ax.set_xlabel("")
ax.set_ylabel("")
sns.despine(ax=ax, left=True, bottom=True, top=True, right=True)

# Age panel — depth scale, period brackets, age labels
ax_age.set_xlim(0, 1)
ax_age.set_ylim(total_depth, 0)
for age in age_order:
    top_d, bot_d = age_spans[age]
    mid_y = (top_d + bot_d) / 2
    # Faint Imprint tint groups each period across both panels
    ax_age.axhspan(top_d, bot_d, color=age_tint[age], alpha=0.06, zorder=0)
    ax.axhspan(top_d, bot_d, color=age_tint[age], alpha=0.05, zorder=0)
    # Period bracket
    ax_age.plot([0.82, 0.82], [top_d + 1, bot_d - 1], color=INK_SOFT, linewidth=1.4)
    ax_age.plot([0.76, 0.88], [top_d + 1, top_d + 1], color=INK_SOFT, linewidth=1.2)
    ax_age.plot([0.76, 0.88], [bot_d - 1, bot_d - 1], color=INK_SOFT, linewidth=1.2)
    ax_age.text(
        0.36,
        mid_y,
        age.replace(" ", "\n"),
        fontsize=8,
        fontweight="medium",
        fontstyle="italic",
        va="center",
        ha="center",
        color=INK,
    )

ax_age.set_ylabel("Depth (m)", fontsize=10, color=INK, labelpad=4)
ax_age.set_yticks(np.arange(0, total_depth + 1, 20))
ax_age.tick_params(axis="y", labelsize=8, colors=INK_SOFT)
ax_age.set_xticks([])
sns.despine(ax=ax_age, top=True, right=True, bottom=True)
ax_age.spines["left"].set_color(INK_SOFT)

# Thickness panel — seaborn strip plot of layer thickness by lithology
thickness_df = df[["lithology", "thickness"]].copy()
sns.stripplot(
    data=thickness_df,
    x="thickness",
    y="lithology",
    ax=ax_thick,
    hue="lithology",
    palette=lith_color,
    order=lith_order,
    hue_order=lith_order,
    size=10,
    marker="D",
    edgecolor=INK,
    linewidth=0.8,
    jitter=False,
    legend=False,
)
ax_thick.set_xlabel("Thickness (m)", fontsize=9, color=INK)
ax_thick.set_ylabel("")
ax_thick.set_yticks(range(len(lith_order)))
ax_thick.set_yticklabels([lith_label[name] for name in lith_order])
ax_thick.tick_params(axis="both", labelsize=8, colors=INK_SOFT)
ax_thick.set_title("Layer Thickness", fontsize=9, fontweight="medium", color=INK, pad=6)
ax_thick.set_axisbelow(True)
ax_thick.xaxis.grid(True, alpha=0.15, linewidth=0.8, color=INK)
sns.despine(ax=ax_thick, top=True, right=True)
ax_thick.spines["left"].set_color(INK_SOFT)
ax_thick.spines["bottom"].set_color(INK_SOFT)

# Lithology legend (decodes column hatching) — figure-level strip at the bottom
legend_handles = [
    mpatches.Patch(facecolor=lith_color[name], edgecolor=INK, hatch=lith_hatch[name], label=lith_label[name])
    for name in lith_order
]
legend = fig.legend(
    handles=legend_handles,
    loc="lower center",
    bbox_to_anchor=(0.53, 0.005),
    ncol=6,
    fontsize=7,
    title="Lithology",
    title_fontsize=8,
    frameon=True,
    facecolor=ELEVATED_BG,
    edgecolor=INK_SOFT,
    framealpha=0.95,
    columnspacing=1.1,
    handlelength=1.4,
)
legend.get_title().set_color(INK)
for text in legend.get_texts():
    text.set_color(INK)

# Title
fig.suptitle(
    "column-stratigraphic · python · seaborn · anyplot.ai", fontsize=14, fontweight="medium", color=INK, y=0.955
)

fig.subplots_adjust(left=0.07, right=0.99, top=0.86, bottom=0.18, wspace=0.07)

# Save
plt.savefig(f"plot-{THEME}.png", dpi=400, facecolor=PAGE_BG)
Runnable source as JSON, for any HTTP client: https://api.anyplot.ai/specs/column-stratigraphic/seaborn/code. Any spec id and library id listed in llms-full.txt fit the same URL shape; every URL below is complete and callable.
{
  "spec_id": "column-stratigraphic",
  "language": "python",
  "library": "seaborn",
  "page": "https://anyplot.ai/column-stratigraphic/python/seaborn",
  "hub": "https://anyplot.ai/column-stratigraphic",
  "code_json": "https://api.anyplot.ai/specs/column-stratigraphic/seaborn/code",
  "spec_json": "https://api.anyplot.ai/specs/column-stratigraphic",
  "render_light_png": "https://storage.googleapis.com/anyplot-images/plots/column-stratigraphic/python/seaborn/plot-light.png",
  "render_dark_png": "https://storage.googleapis.com/anyplot-images/plots/column-stratigraphic/python/seaborn/plot-dark.png",
  "quality_score": 92.0,
  "license": "MIT",
  "guide": "https://anyplot.ai/llms.txt"
}
Part of Stratigraphic Column with Lithology Patterns on anyplot.ai.