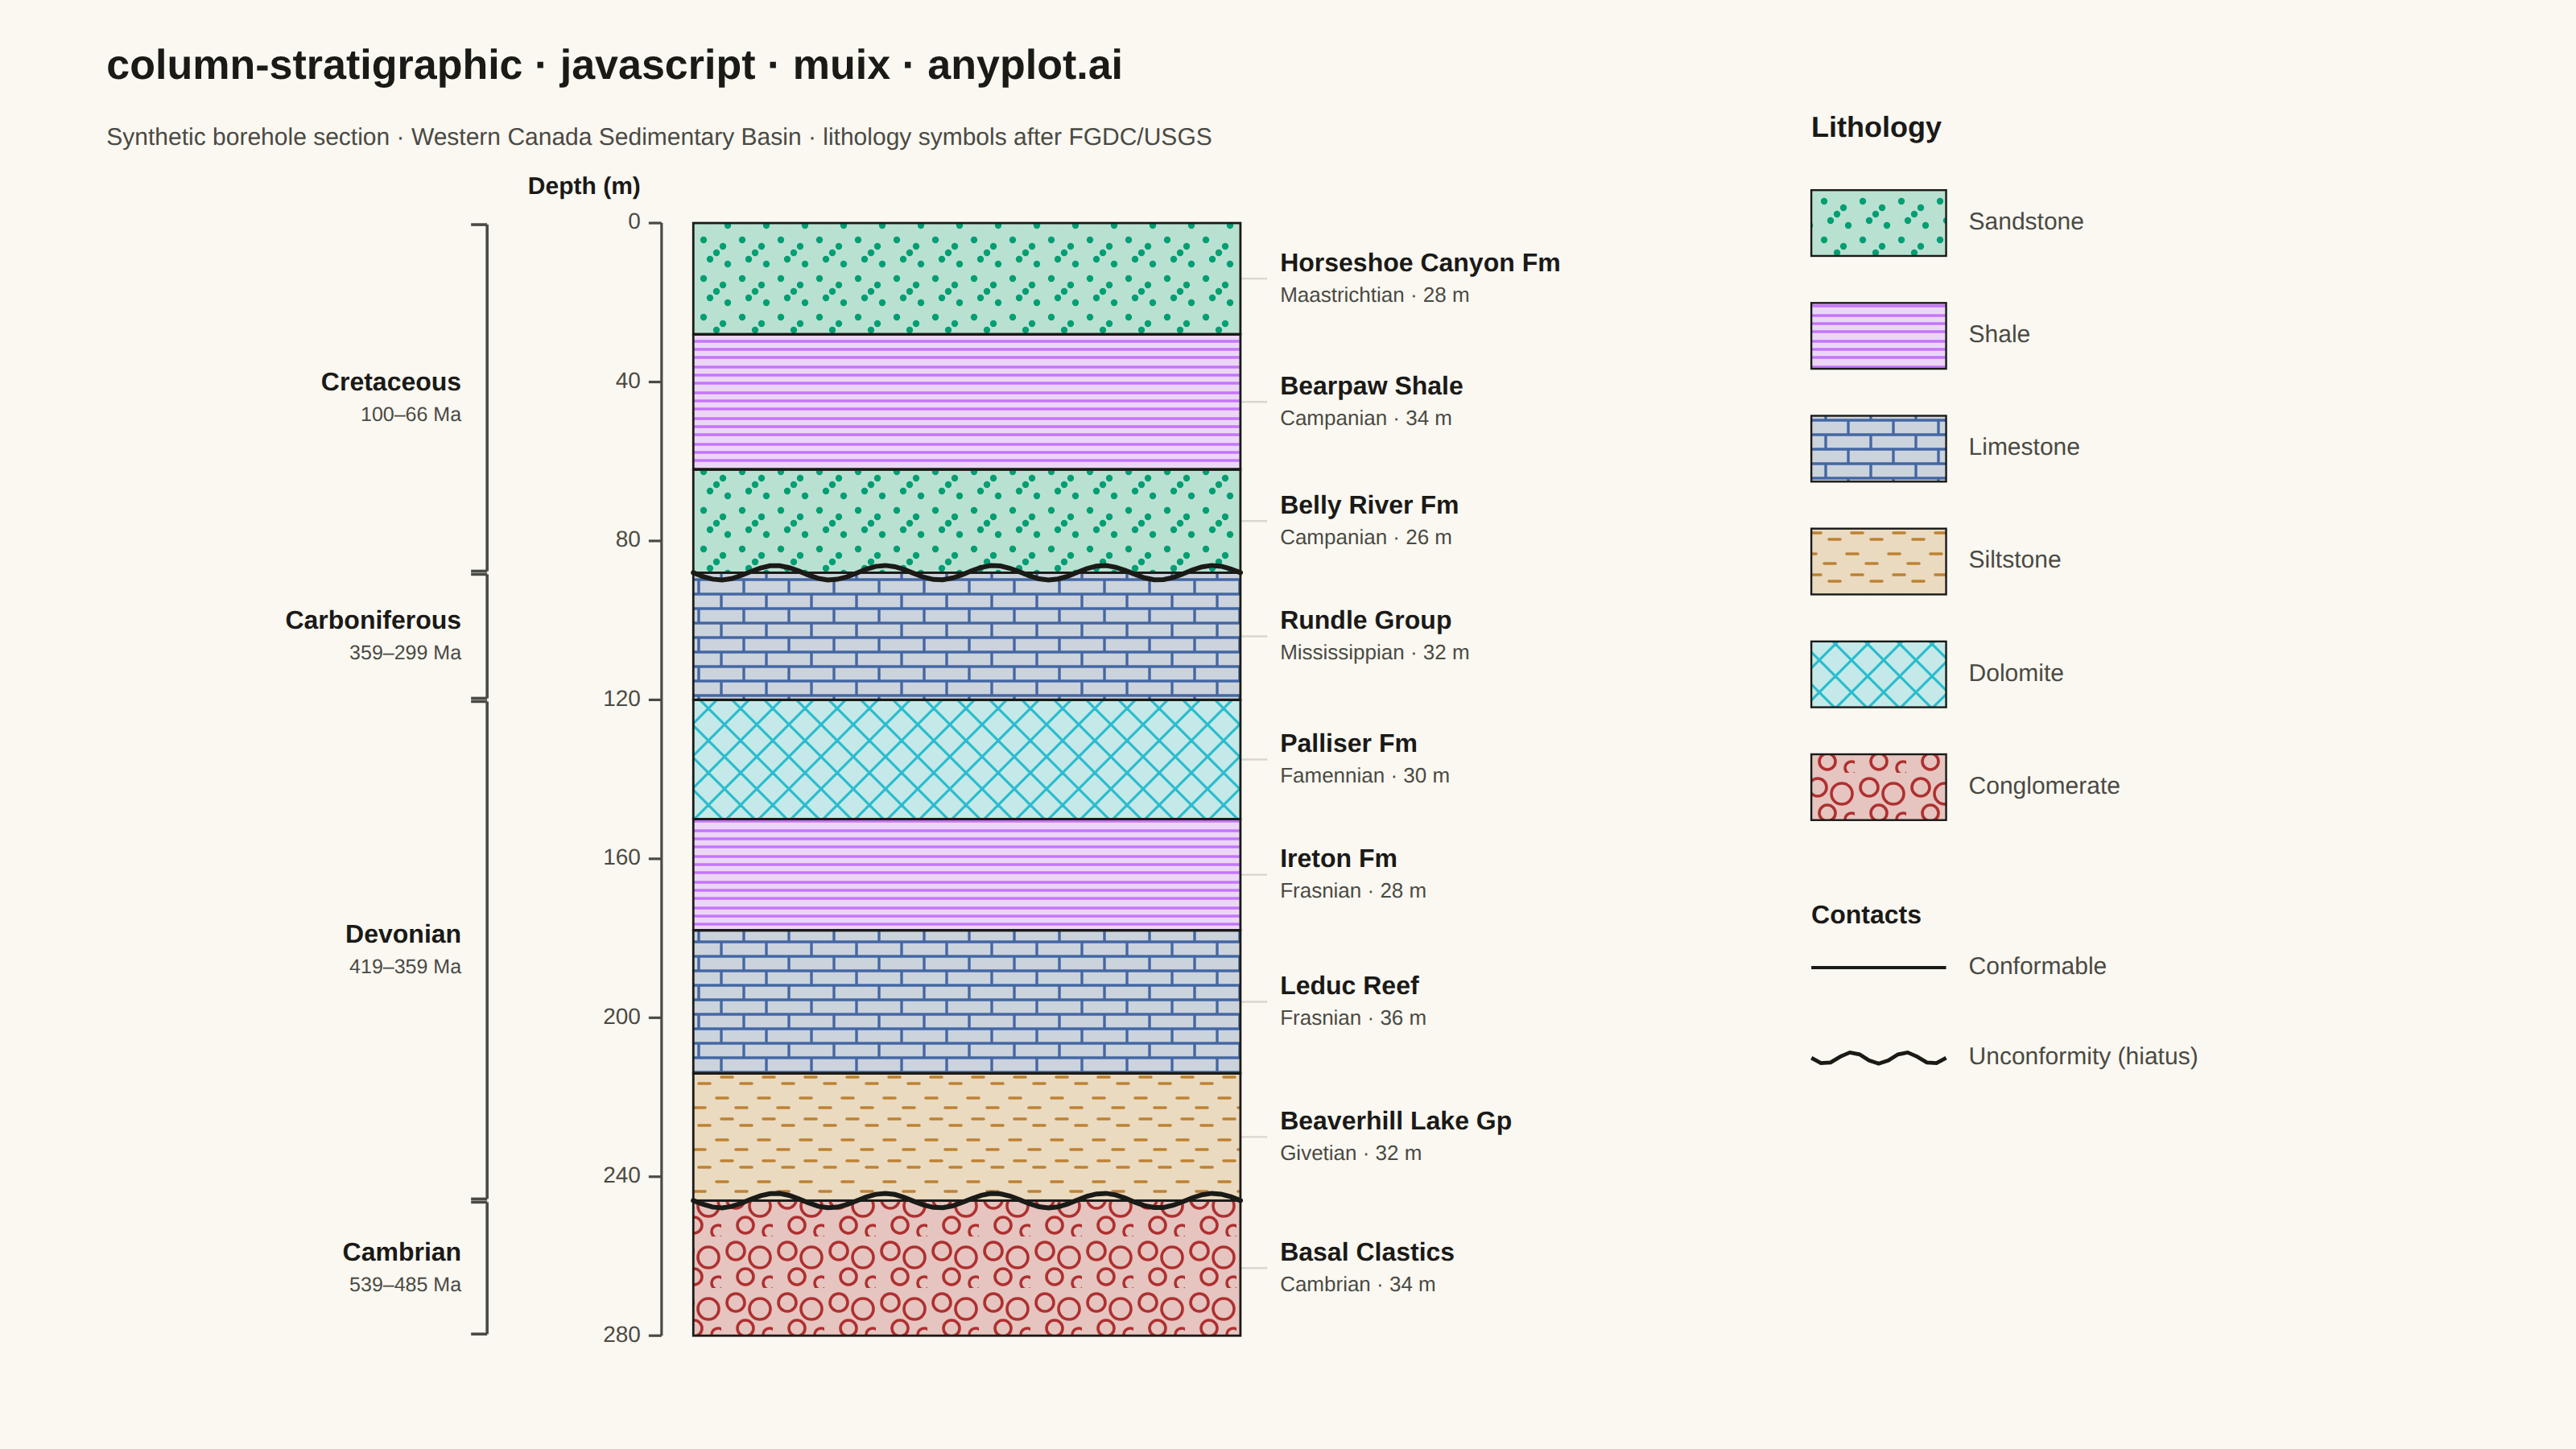
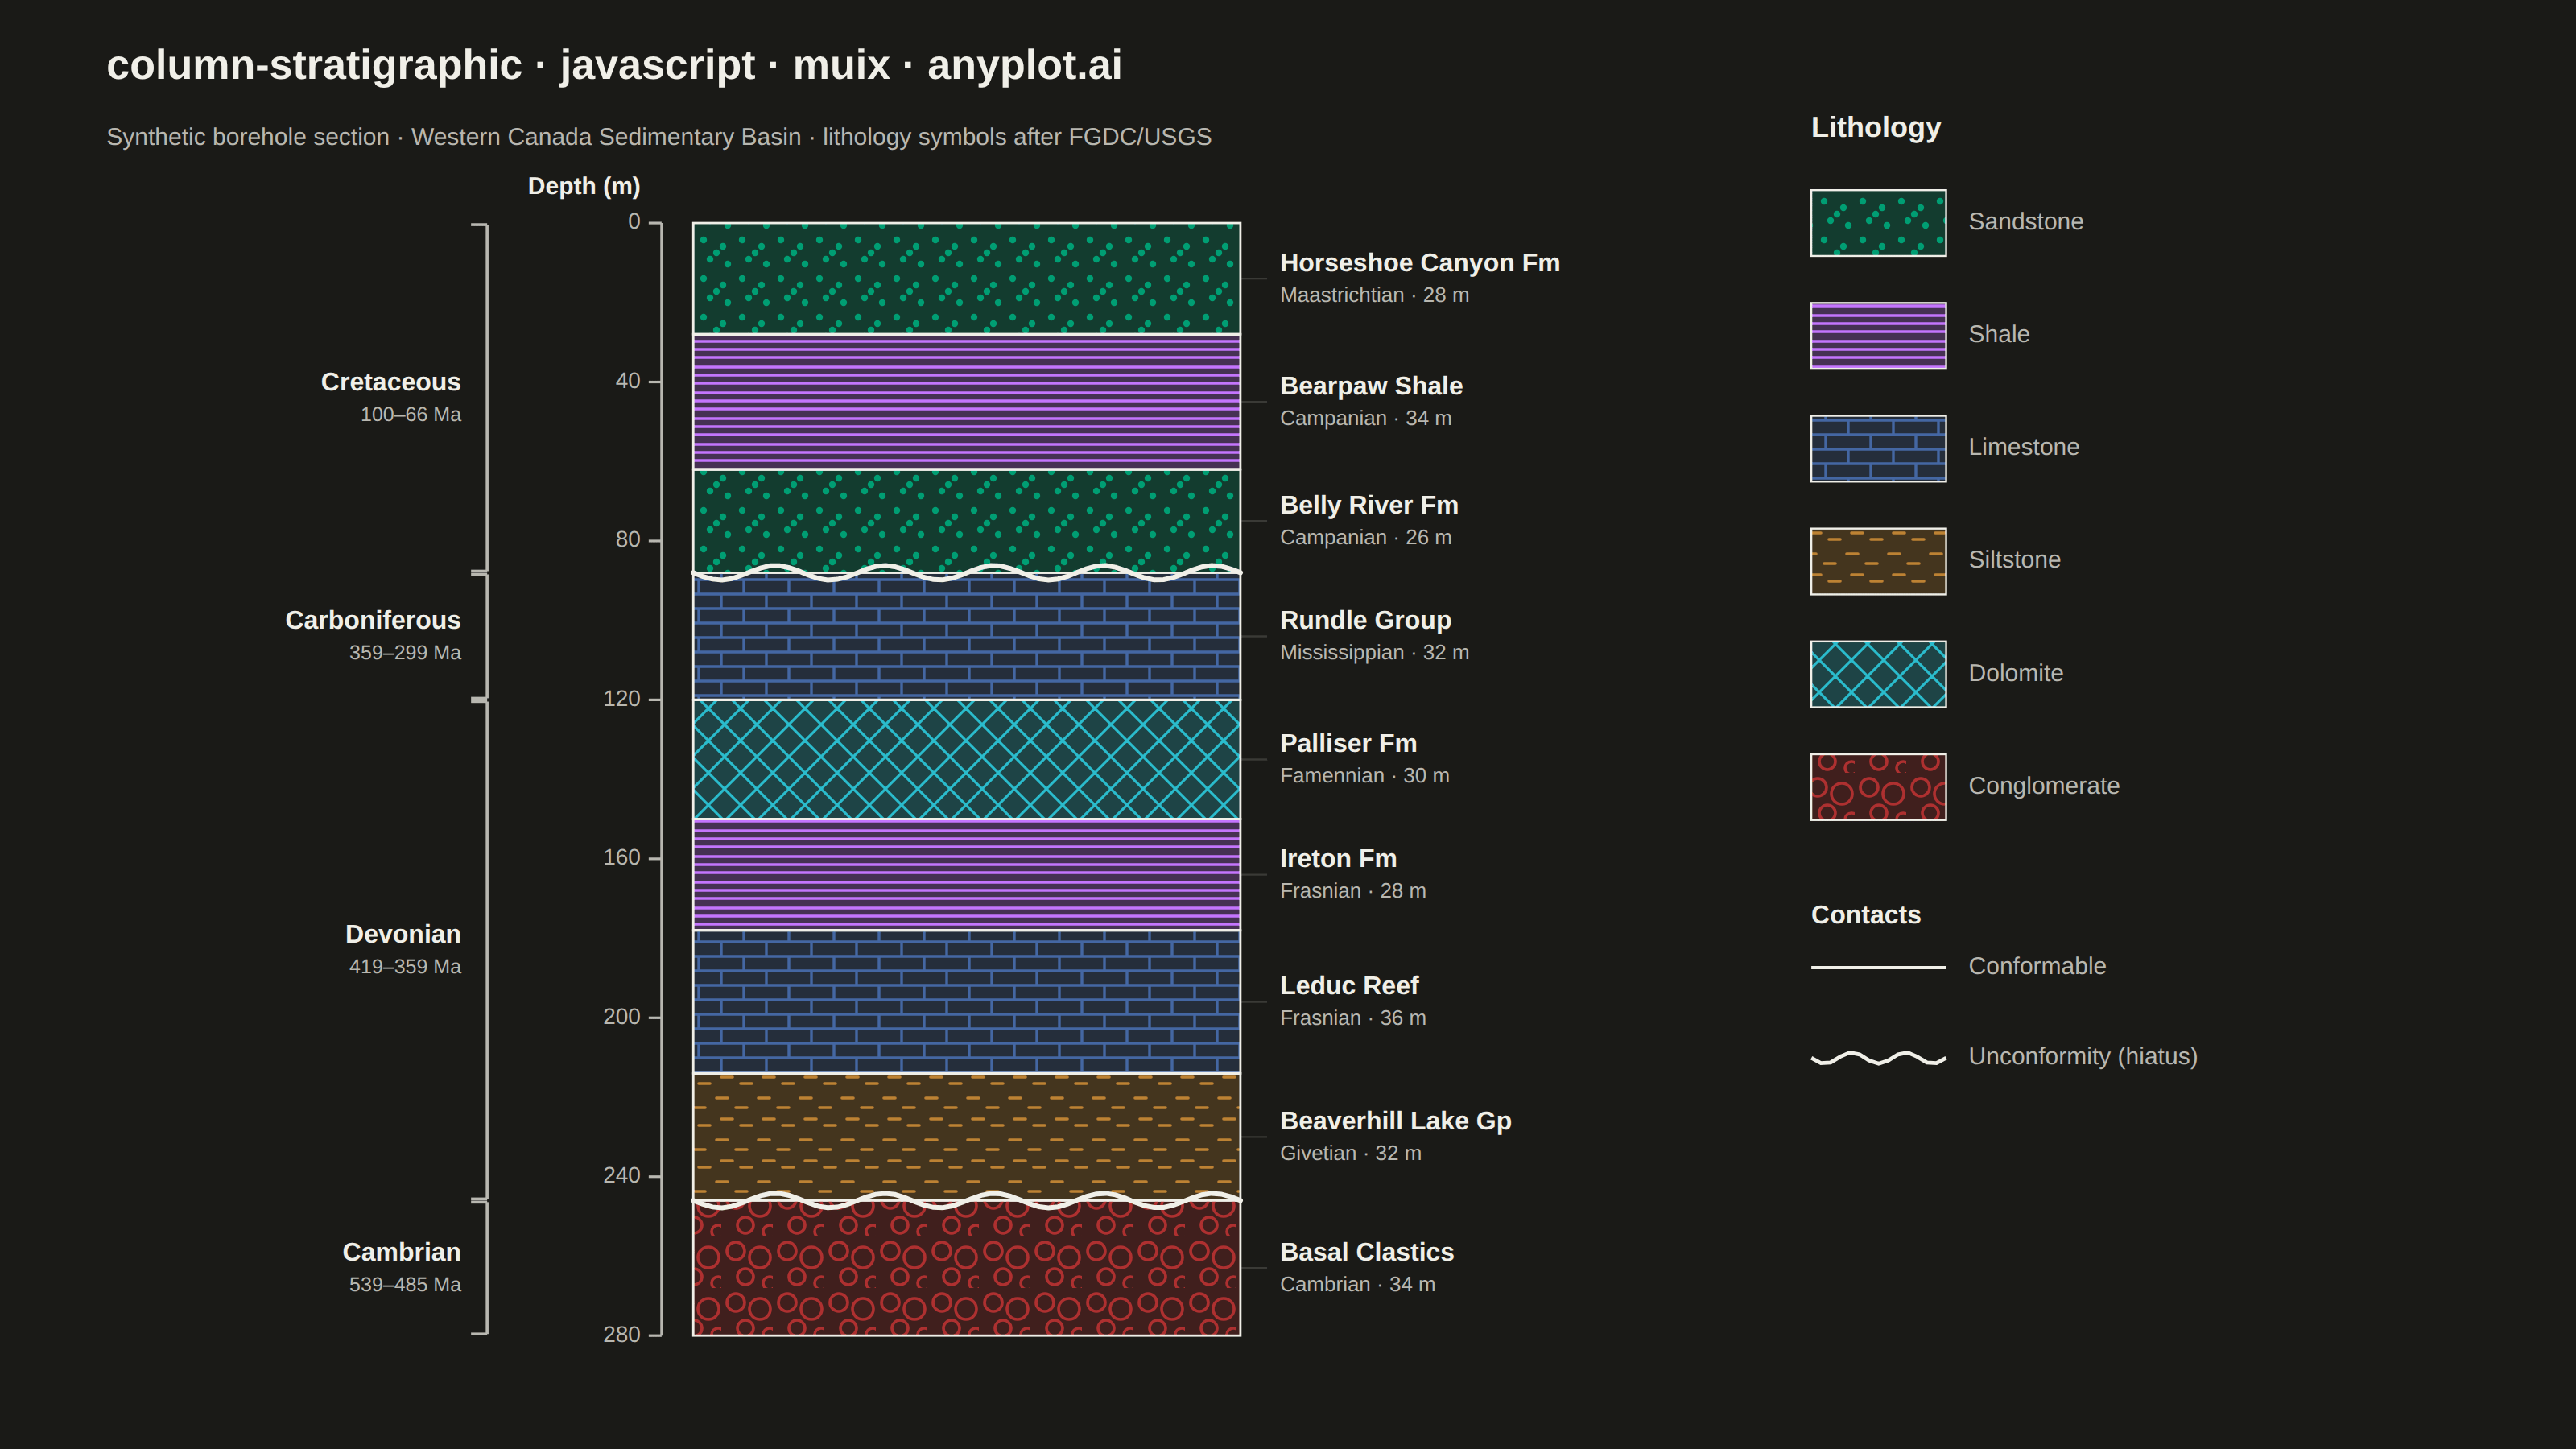
A vertical column visualization showing geological rock layers with standardized lithology patterns, formation names, ages, and thickness scales. Each layer is represented as a stacked rectangular block filled with a distinctive pattern (e.g., brick pattern for limestone, dots for sandstone, dashes for shale) following FGDC/USGS conventions. This plot is essential for communicating subsurface geology and sedimentary sequences in a compact, standardized format.
// anyplot.ai
// column-stratigraphic: Stratigraphic Column with Lithology Patterns
// Library: muix 7.29.1 | JavaScript 22.22.3
// Quality: 95/100 | Created: 2026-06-17
//# anyplot-orientation: landscape
// anyplot.ai
// column-stratigraphic: Stratigraphic Column with Lithology Patterns
// Library: MUI X Charts | React | Node 22
// License: @mui/x-charts — MIT (community). Pro/Premium are out of scope.
// Quality: pending | Created: 2026-06-17
import { ChartContainer } from "@mui/x-charts/ChartContainer";
import { useXScale, useYScale } from "@mui/x-charts/hooks";

const t = window.ANYPLOT_TOKENS;
const SIZE = window.ANYPLOT_SIZE;
const TITLE = "column-stratigraphic · javascript · muix · anyplot.ai";
const FONT =
  '-apple-system, BlinkMacSystemFont, "Segoe UI", Roboto, Helvetica, Arial, sans-serif';

// --- Lithology dictionary --------------------------------------------------
// Each rock type maps to an Imprint colour + a distinct FGDC/USGS-style fill
// pattern. The pattern (not the colour) is the primary lithology cue; the colour
// is a redundant, colourblind-safe secondary. Sandstone takes brand green
// (Imprint position 1 — always the first categorical series).
const LITHO = {
  sandstone: { name: "Sandstone", color: t.palette[0] }, // brand green
  shale: { name: "Shale", color: t.palette[1] }, // lavender
  limestone: { name: "Limestone", color: t.palette[2] }, // blue
  siltstone: { name: "Siltstone", color: t.palette[3] }, // ochre
  dolomite: { name: "Dolomite", color: t.palette[5] }, // cyan
  conglomerate: { name: "Conglomerate", color: t.palette[4] }, // matte red
};
const LITHO_ORDER = [
  "sandstone",
  "shale",
  "limestone",
  "siltstone",
  "dolomite",
  "conglomerate",
];

// --- Data: synthetic borehole section (deterministic, in-memory) -----------
// A Western-Canada-style sedimentary succession: a young clastic/marine
// Cretaceous package resting unconformably on Paleozoic carbonates, with a
// second unconformity onto basal Cambrian clastics. Depth increases downward.
const LAYERS = [
  { top: 0, bottom: 28, litho: "sandstone", formation: "Horseshoe Canyon Fm", age: "Maastrichtian" },
  { top: 28, bottom: 62, litho: "shale", formation: "Bearpaw Shale", age: "Campanian" },
  { top: 62, bottom: 88, litho: "sandstone", formation: "Belly River Fm", age: "Campanian" },
  { top: 88, bottom: 120, litho: "limestone", formation: "Rundle Group", age: "Mississippian", unconf: true },
  { top: 120, bottom: 150, litho: "dolomite", formation: "Palliser Fm", age: "Famennian" },
  { top: 150, bottom: 178, litho: "shale", formation: "Ireton Fm", age: "Frasnian" },
  { top: 178, bottom: 214, litho: "limestone", formation: "Leduc Reef", age: "Frasnian" },
  { top: 214, bottom: 246, litho: "siltstone", formation: "Beaverhill Lake Gp", age: "Givetian" },
  { top: 246, bottom: 280, litho: "conglomerate", formation: "Basal Clastics", age: "Cambrian", unconf: true },
];
const MAXDEPTH = 280;

// Geological periods spanned, grouped for the left-margin time brackets.
const PERIODS = [
  { name: "Cretaceous", age: "100–66 Ma", top: 0, bottom: 88 },
  { name: "Carboniferous", age: "359–299 Ma", top: 88, bottom: 120 },
  { name: "Devonian", age: "419–359 Ma", top: 120, bottom: 246 },
  { name: "Cambrian", age: "539–485 Ma", top: 246, bottom: 280 },
];

// --- World layout (abstract 16×9 coordinate space, y increases upward) ------
const COL_LEFT = 4.25;
const COL_RIGHT = 7.7;
const COL_TOP_Y = 7.7; // world-y of the shallowest depth (top of column)
const COL_BOT_Y = 0.6; // world-y of the deepest depth (bottom of column)
const AXIS_X = 4.05;
const BRACKET_X = 2.95;
const FORM_X = 7.95;
const LEGEND_X = 11.3;

// Depth (m) → world-y. Depth 0 sits at the top, MAXDEPTH at the bottom.
const depthToY = (d) => COL_TOP_Y - (d / MAXDEPTH) * (COL_TOP_Y - COL_BOT_Y);

// --- SVG fill patterns (FGDC/USGS-style lithology motifs) -------------------
// Each tile paints a faint colour wash (identity) plus a saturated motif in the
// same Imprint hue. userSpaceOnUse keeps motifs a constant pixel size whatever
// the layer thickness. Theme-independent: identical in light & dark.
function Defs() {
  return (
    <defs>
      {/* Sandstone — stipple dots */}
      <pattern id="lith-sandstone" patternUnits="userSpaceOnUse" width={24} height={24}>
        <rect width={24} height={24} fill={LITHO.sandstone.color} fillOpacity={0.26} />
        {[[5, 5], [17, 9], [9, 17], [20, 20], [13, 13]].map(([x, y], i) => (
          <circle key={i} cx={x} cy={y} r={2.1} fill={LITHO.sandstone.color} />
        ))}
      </pattern>
      {/* Shale — fine horizontal laminations */}
      <pattern id="lith-shale" patternUnits="userSpaceOnUse" width={24} height={16}>
        <rect width={24} height={16} fill={LITHO.shale.color} fillOpacity={0.26} />
        {[4, 9, 14].map((y, i) => (
          <line key={i} x1={0} y1={y} x2={24} y2={y} stroke={LITHO.shale.color} strokeWidth={1.7} />
        ))}
      </pattern>
      {/* Limestone — brickwork */}
      <pattern id="lith-limestone" patternUnits="userSpaceOnUse" width={28} height={18}>
        <rect width={28} height={18} fill={LITHO.limestone.color} fillOpacity={0.26} />
        <g stroke={LITHO.limestone.color} strokeWidth={1.7}>
          <line x1={0} y1={0} x2={28} y2={0} />
          <line x1={0} y1={9} x2={28} y2={9} />
          <line x1={0} y1={18} x2={28} y2={18} />
          <line x1={14} y1={0} x2={14} y2={9} />
          <line x1={0} y1={9} x2={0} y2={18} />
          <line x1={28} y1={9} x2={28} y2={18} />
        </g>
      </pattern>
      {/* Siltstone — short scattered dashes */}
      <pattern id="lith-siltstone" patternUnits="userSpaceOnUse" width={26} height={26}>
        <rect width={26} height={26} fill={LITHO.siltstone.color} fillOpacity={0.26} />
        <g stroke={LITHO.siltstone.color} strokeWidth={1.8} strokeLinecap="round">
          <line x1={3} y1={6} x2={10} y2={6} />
          <line x1={15} y1={12} x2={22} y2={12} />
          <line x1={6} y1={19} x2={13} y2={19} />
          <line x1={18} y1={23} x2={25} y2={23} />
        </g>
      </pattern>
      {/* Dolomite — rhombic (diagonal) brick */}
      <pattern id="lith-dolomite" patternUnits="userSpaceOnUse" width={20} height={20}>
        <rect width={20} height={20} fill={LITHO.dolomite.color} fillOpacity={0.26} />
        <g stroke={LITHO.dolomite.color} strokeWidth={1.6}>
          <line x1={0} y1={0} x2={20} y2={20} />
          <line x1={0} y1={20} x2={20} y2={0} />
          <line x1={-10} y1={10} x2={10} y2={-10} />
          <line x1={10} y1={30} x2={30} y2={10} />
        </g>
      </pattern>
      {/* Conglomerate — clast outlines (pebbles) */}
      <pattern id="lith-conglomerate" patternUnits="userSpaceOnUse" width={32} height={32}>
        <rect width={32} height={32} fill={LITHO.conglomerate.color} fillOpacity={0.26} />
        <g fill="none" stroke={LITHO.conglomerate.color} strokeWidth={1.8}>
          <circle cx={9} cy={9} r={5.5} />
          <circle cx={24} cy={13} r={6.5} />
          <circle cx={15} cy={25} r={5} />
          <circle cx={30} cy={29} r={4} />
        </g>
      </pattern>
    </defs>
  );
}

// Wavy path (sine) for unconformity contacts.
function wavyPath(x1, x2, y, amp, wavelength) {
  const n = Math.max(2, Math.round((x2 - x1) / 6));
  let d = `M${x1.toFixed(1)} ${(y).toFixed(1)}`;
  for (let i = 1; i <= n; i++) {
    const x = x1 + ((x2 - x1) * i) / n;
    const yy = y + amp * Math.sin(((x - x1) / wavelength) * 2 * Math.PI);
    d += ` L${x.toFixed(1)} ${yy.toFixed(1)}`;
  }
  return d;
}

// --- Column: patterned lithology blocks + contacts --------------------------
function Column() {
  const xs = useXScale();
  const ys = useYScale();
  const xL = xs(COL_LEFT);
  const xR = xs(COL_RIGHT);
  return (
    <g>
      {LAYERS.map((L, i) => {
        const yTop = ys(depthToY(L.top));
        const yBot = ys(depthToY(L.bottom));
        return (
          <rect
            key={i}
            x={xL}
            y={yTop}
            width={xR - xL}
            height={yBot - yTop}
            fill={`url(#lith-${L.litho})`}
            stroke={t.ink}
            strokeWidth={1.4}
          />
        );
      })}
      {/* Contacts: solid = conformable, wavy = unconformity (hiatus) */}
      {LAYERS.map((L, i) => {
        const y = ys(depthToY(L.top));
        if (L.top === 0) return null;
        return L.unconf ? (
          <path
            key={`c${i}`}
            d={wavyPath(xL, xR, y, 4.5, (xR - xL) / 5)}
            fill="none"
            stroke={t.ink}
            strokeWidth={3}
            strokeLinecap="round"
          />
        ) : (
          <line key={`c${i}`} x1={xL} y1={y} x2={xR} y2={y} stroke={t.ink} strokeWidth={1.6} />
        );
      })}
    </g>
  );
}

// --- Depth scale (left axis, metres, increasing downward) -------------------
function DepthAxis() {
  const xs = useXScale();
  const ys = useYScale();
  const x = xs(AXIS_X);
  const ticks = [];
  for (let d = 0; d <= MAXDEPTH; d += 40) ticks.push(d);
  return (
    <g fontFamily={FONT}>
      <line x1={x} y1={ys(COL_TOP_Y)} x2={x} y2={ys(COL_BOT_Y)} stroke={t.inkSoft} strokeWidth={1.6} />
      {ticks.map((d) => {
        const y = ys(depthToY(d));
        return (
          <g key={d}>
            <line x1={x - 8} y1={y} x2={x} y2={y} stroke={t.inkSoft} strokeWidth={1.6} />
            <text x={x - 13} y={y} textAnchor="end" dominantBaseline="middle" fontSize={14} fill={t.inkSoft}>
              {d}
            </text>
          </g>
        );
      })}
      <text
        x={x - 13}
        y={ys(COL_TOP_Y) - 22}
        textAnchor="end"
        dominantBaseline="middle"
        fontSize={15}
        fontWeight={600}
        fill={t.ink}
      >
        Depth (m)
      </text>
    </g>
  );
}

// --- Geological time brackets (far left) ------------------------------------
function Periods() {
  const xs = useXScale();
  const ys = useYScale();
  const bx = xs(BRACKET_X);
  const cap = 10;
  return (
    <g fontFamily={FONT}>
      {PERIODS.map((p, i) => {
        const yTop = ys(depthToY(p.top));
        const yBot = ys(depthToY(p.bottom));
        const yMid = (yTop + yBot) / 2;
        return (
          <g key={i}>
            <line x1={bx} y1={yTop + 1} x2={bx} y2={yBot - 1} stroke={t.inkSoft} strokeWidth={1.8} />
            <line x1={bx} y1={yTop + 1} x2={bx - cap} y2={yTop + 1} stroke={t.inkSoft} strokeWidth={1.8} />
            <line x1={bx} y1={yBot - 1} x2={bx - cap} y2={yBot - 1} stroke={t.inkSoft} strokeWidth={1.8} />
            <text x={bx - 16} y={yMid - 9} textAnchor="end" dominantBaseline="middle" fontSize={16} fontWeight={600} fill={t.ink}>
              {p.name}
            </text>
            <text x={bx - 16} y={yMid + 11} textAnchor="end" dominantBaseline="middle" fontSize={12.5} fill={t.inkSoft}>
              {p.age}
            </text>
          </g>
        );
      })}
    </g>
  );
}

// --- Formation labels (right of each layer, with leader lines) --------------
function Formations() {
  const xs = useXScale();
  const ys = useYScale();
  const xR = xs(COL_RIGHT);
  const xLead = xs(FORM_X) - 8;
  const xText = xs(FORM_X);
  return (
    <g fontFamily={FONT}>
      {LAYERS.map((L, i) => {
        const yMid = ys(depthToY((L.top + L.bottom) / 2));
        return (
          <g key={i}>
            <line x1={xR} y1={yMid} x2={xLead} y2={yMid} stroke={t.grid} strokeWidth={1.2} />
            <text x={xText} y={yMid - 9} dominantBaseline="middle" fontSize={16} fontWeight={600} fill={t.ink}>
              {L.formation}
            </text>
            <text x={xText} y={yMid + 11} dominantBaseline="middle" fontSize={13} fill={t.inkSoft}>
              {`${L.age} · ${L.bottom - L.top} m`}
            </text>
          </g>
        );
      })}
    </g>
  );
}

// --- Legend: lithology patterns + contact types -----------------------------
function Legend() {
  const xs = useXScale();
  const ys = useYScale();
  const x = xs(LEGEND_X);
  const swW = xs(LEGEND_X + 0.85) - xs(LEGEND_X);
  const top = COL_TOP_Y;
  const step = 0.72;
  const rowY = (i) => ys(top - i * step);
  const swH = Math.abs(ys(0) - ys(0.42));
  return (
    <g fontFamily={FONT}>
      <text x={x} y={ys(top + 0.55)} fontSize={18} fontWeight={700} fill={t.ink}>
        Lithology
      </text>
      {LITHO_ORDER.map((key, i) => {
        const y = rowY(i);
        return (
          <g key={key}>
            <rect x={x} y={y - swH / 2} width={swW} height={swH} fill={`url(#lith-${key})`} stroke={t.ink} strokeWidth={1.2} />
            <text x={x + swW + 14} y={y} dominantBaseline="middle" fontSize={15} fill={t.inkSoft}>
              {LITHO[key].name}
            </text>
          </g>
        );
      })}
      {/* Contact-type key */}
      <text x={x} y={ys(top - LITHO_ORDER.length * step - 0.15)} fontSize={16} fontWeight={700} fill={t.ink}>
        Contacts
      </text>
      {(() => {
        const yC = rowY(LITHO_ORDER.length + 0.6);
        return (
          <g>
            <line x1={x} y1={yC} x2={x + swW} y2={yC} stroke={t.ink} strokeWidth={2} />
            <text x={x + swW + 14} y={yC} dominantBaseline="middle" fontSize={15} fill={t.inkSoft}>
              Conformable
            </text>
          </g>
        );
      })()}
      {(() => {
        const yC = rowY(LITHO_ORDER.length + 1.4);
        return (
          <g>
            <path d={wavyPath(x, x + swW, yC, 3.5, swW / 2.5)} fill="none" stroke={t.ink} strokeWidth={2.4} />
            <text x={x + swW + 14} y={yC} dominantBaseline="middle" fontSize={15} fill={t.inkSoft}>
              Unconformity (hiatus)
            </text>
          </g>
        );
      })()}
    </g>
  );
}

// --- Title / subtitle -------------------------------------------------------
function TitleBlock() {
  const xs = useXScale();
  const ys = useYScale();
  return (
    <g fontFamily={FONT}>
      <text x={xs(0.55)} y={ys(8.62)} fontSize={26} fontWeight={600} fill={t.ink}>
        {TITLE}
      </text>
      <text x={xs(0.55)} y={ys(8.2)} fontSize={15} fill={t.inkSoft}>
        Synthetic borehole section · Western Canada Sedimentary Basin · lithology symbols after FGDC/USGS
      </text>
    </g>
  );
}

// --- Chart (default-exported component — the harness mounts it) -------------
export default function Chart() {
  return (
    <ChartContainer
      width={SIZE.width}
      height={SIZE.height}
      margin={{ top: 12, right: 12, bottom: 12, left: 12 }}
      series={[]}
      xAxis={[{ scaleType: "linear", min: 0, max: 16 }]}
      yAxis={[{ scaleType: "linear", min: 0, max: 9 }]}
      skipAnimation
    >
      <Defs />
      <Column />
      <DepthAxis />
      <Periods />
      <Formations />
      <Legend />
      <TitleBlock />
    </ChartContainer>
  );
}
Runnable source as JSON, for any HTTP client: https://api.anyplot.ai/specs/column-stratigraphic/muix/code. Any spec id and library id listed in llms-full.txt fit the same URL shape; every URL below is complete and callable.
{
  "spec_id": "column-stratigraphic",
  "language": "javascript",
  "library": "muix",
  "page": "https://anyplot.ai/column-stratigraphic/javascript/muix",
  "hub": "https://anyplot.ai/column-stratigraphic",
  "code_json": "https://api.anyplot.ai/specs/column-stratigraphic/muix/code",
  "spec_json": "https://api.anyplot.ai/specs/column-stratigraphic",
  "render_light_png": "https://storage.googleapis.com/anyplot-images/plots/column-stratigraphic/javascript/muix/plot-light.png",
  "render_dark_png": "https://storage.googleapis.com/anyplot-images/plots/column-stratigraphic/javascript/muix/plot-dark.png",
  "interactive_light_html": "https://storage.googleapis.com/anyplot-images/plots/column-stratigraphic/javascript/muix/plot-light.html",
  "interactive_dark_html": "https://storage.googleapis.com/anyplot-images/plots/column-stratigraphic/javascript/muix/plot-dark.html",
  "quality_score": 95.0,
  "license": "MIT",
  "guide": "https://anyplot.ai/llms.txt"
}
Part of Stratigraphic Column with Lithology Patterns on anyplot.ai.