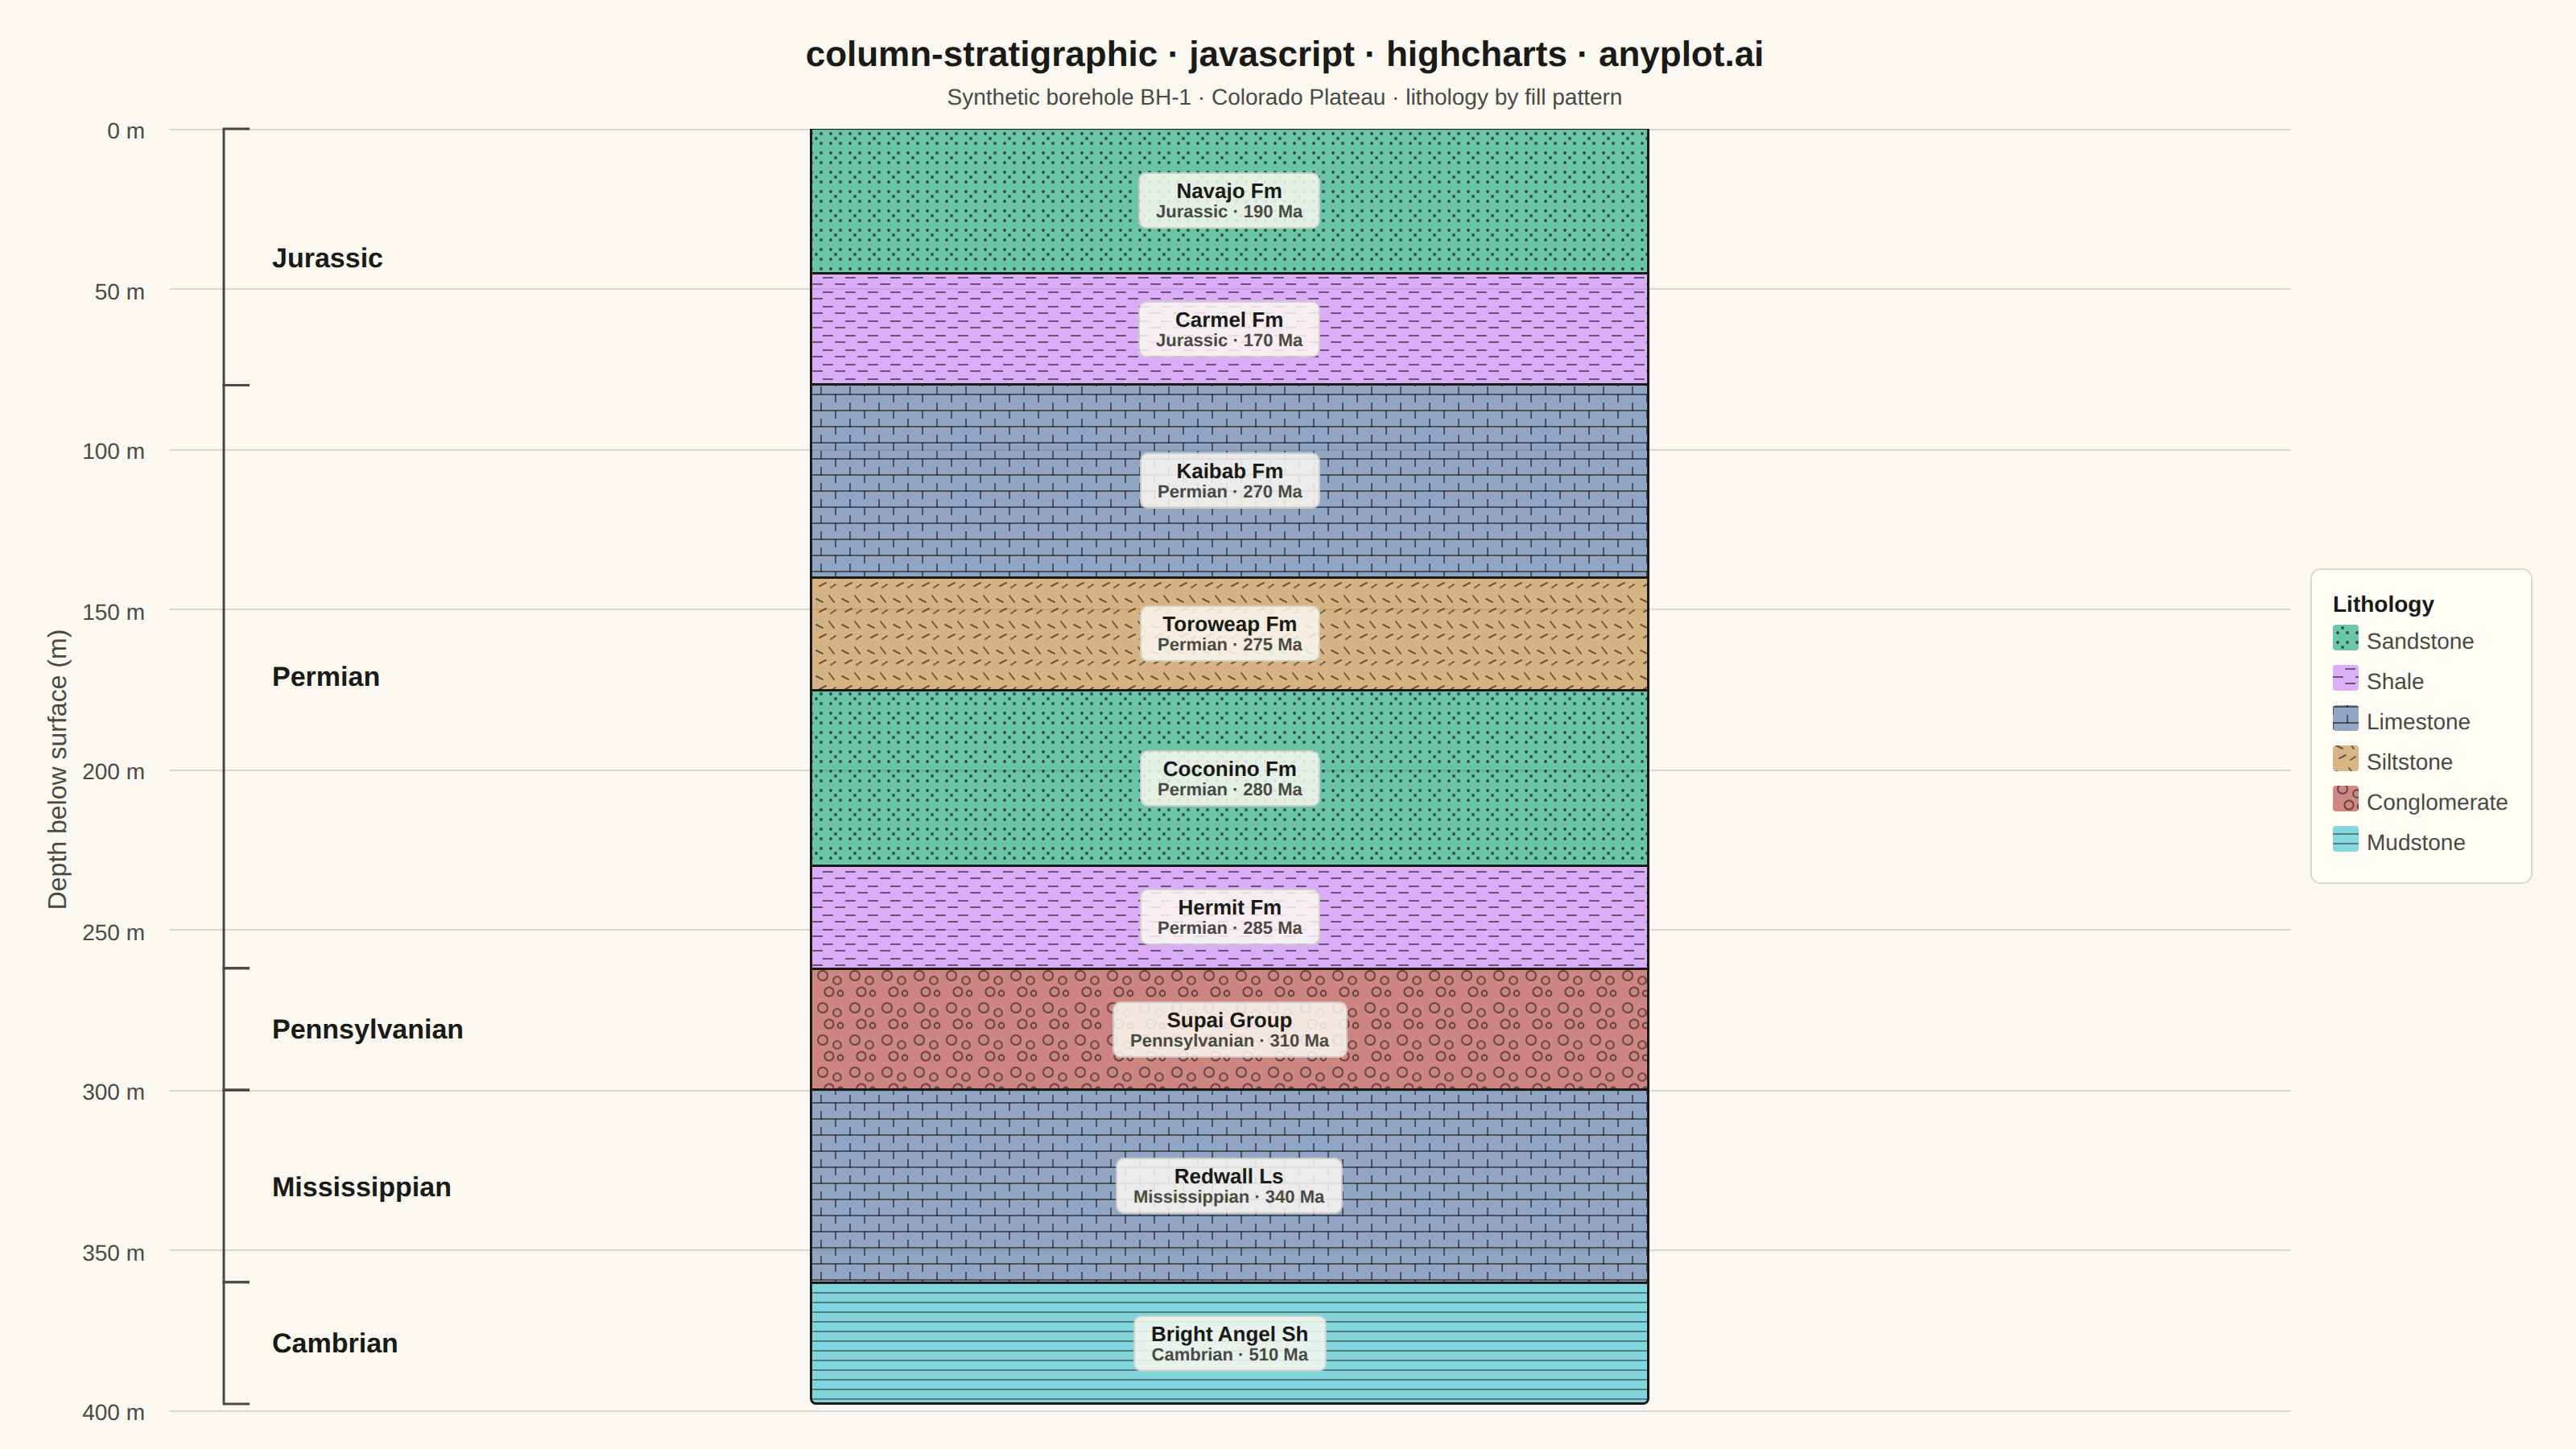
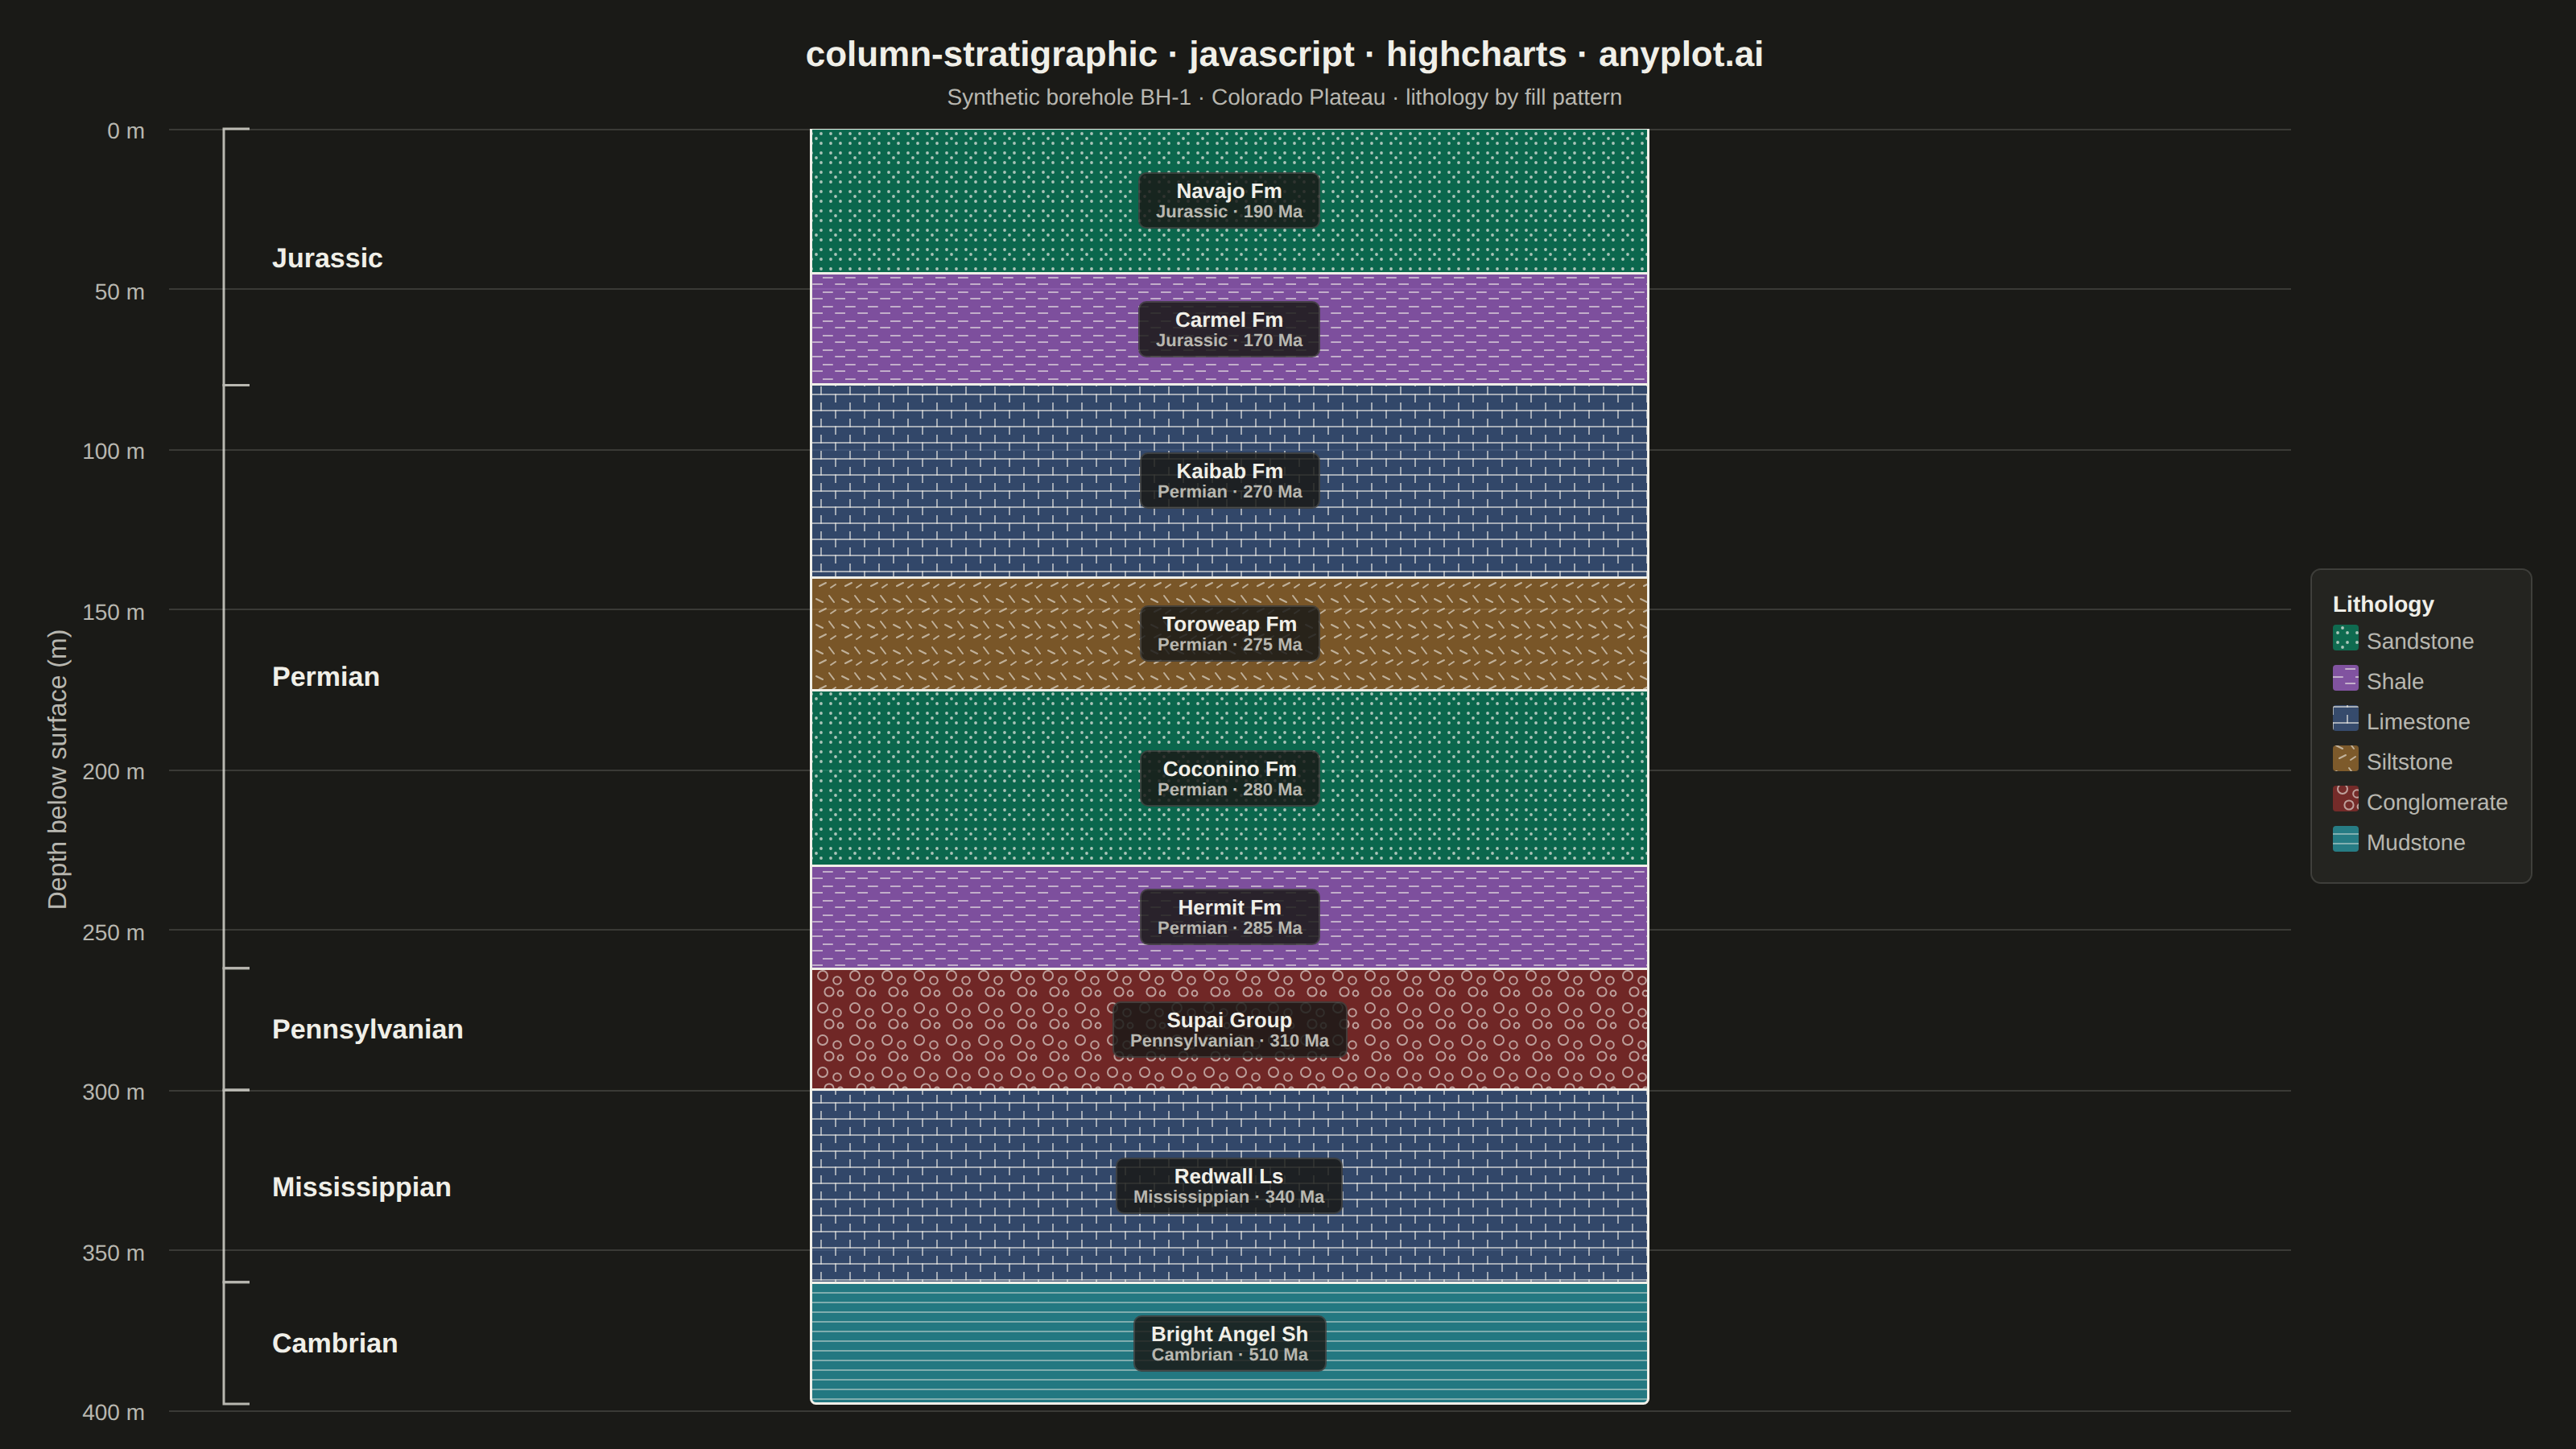
A vertical column visualization showing geological rock layers with standardized lithology patterns, formation names, ages, and thickness scales. Each layer is represented as a stacked rectangular block filled with a distinctive pattern (e.g., brick pattern for limestone, dots for sandstone, dashes for shale) following FGDC/USGS conventions. This plot is essential for communicating subsurface geology and sedimentary sequences in a compact, standardized format.
// anyplot.ai
// column-stratigraphic: Stratigraphic Column with Lithology Patterns
// Library: highcharts 12.6.0 | JavaScript 22.22.3
// Quality: 92/100 | Created: 2026-06-17
//# anyplot-orientation: landscape

const t = window.ANYPLOT_TOKENS;

// --- Data: synthetic borehole section, top → bottom, depth increasing downward
// `top`/`bottom` are depths below surface in metres. Lithology drives the fill
// pattern; the tint is assigned in canonical Imprint order by first appearance.
const layers = [
  { litho: "sandstone", formation: "Navajo Fm", age: "Jurassic · 190 Ma", top: 0, bottom: 45 },
  { litho: "shale", formation: "Carmel Fm", age: "Jurassic · 170 Ma", top: 45, bottom: 80 },
  { litho: "limestone", formation: "Kaibab Fm", age: "Permian · 270 Ma", top: 80, bottom: 140 },
  { litho: "siltstone", formation: "Toroweap Fm", age: "Permian · 275 Ma", top: 140, bottom: 175 },
  { litho: "sandstone", formation: "Coconino Fm", age: "Permian · 280 Ma", top: 175, bottom: 230 },
  { litho: "shale", formation: "Hermit Fm", age: "Permian · 285 Ma", top: 230, bottom: 262 },
  { litho: "conglomerate", formation: "Supai Group", age: "Pennsylvanian · 310 Ma", top: 262, bottom: 300 },
  { litho: "limestone", formation: "Redwall Ls", age: "Mississippian · 340 Ma", top: 300, bottom: 360 },
  { litho: "mudstone", formation: "Bright Angel Sh", age: "Cambrian · 510 Ma", top: 360, bottom: 398 },
];

const total = layers[layers.length - 1].bottom; // deepest depth = stack height

// Assign an Imprint tint to each lithology by order of first appearance
// (first categorical series is therefore always #009E73 — palette[0]).
const lithoOrder = [];
layers.forEach((l) => {
  if (!lithoOrder.includes(l.litho)) lithoOrder.push(l.litho);
});
const tintFor = {};
lithoOrder.forEach((k, i) => {
  tintFor[k] = t.palette[i % t.palette.length];
});

const cap = (s) => s.charAt(0).toUpperCase() + s.slice(1);

// --- SVG pattern texture per lithology (approximating FGDC/USGS symbols).
// Each entry returns the foreground texture children; the harness injects them
// into the chart's <defs> after load so the `url(#litho-*)` fills resolve.
const dot = (x, y, r) => ({ tag: "circle", attrs: { cx: x, cy: y, r, fill: t.ink, "fill-opacity": 0.7 } });
const seg = (x1, y1, x2, y2, w) => ({
  tag: "line",
  attrs: { x1, y1, x2, y2, stroke: t.ink, "stroke-width": w || 1, "stroke-opacity": 0.6, "stroke-linecap": "round" },
});
const ring = (x, y, r) => ({
  tag: "circle",
  attrs: { cx: x, cy: y, r, fill: "none", stroke: t.ink, "stroke-width": 1, "stroke-opacity": 0.6 },
});

const TEXTURE = {
  // Stipple dots → sandstone
  sandstone: { w: 12, h: 12, kids: [dot(3, 3, 0.95), dot(9, 9, 0.95), dot(9, 3, 0.95), dot(3, 9, 0.95), dot(6, 6, 0.95)] },
  // Horizontal dashes → shale
  shale: { w: 14, h: 9, kids: [seg(0, 2.5, 6, 2.5), seg(8, 6.5, 14, 6.5)] },
  // Brick / blocky → limestone
  limestone: { w: 18, h: 10, kids: [seg(0, 5, 18, 5), seg(9, 0, 9, 5), seg(0, 5, 0, 10), seg(18, 5, 18, 10)] },
  // Random short dashes → siltstone
  siltstone: { w: 16, h: 16, kids: [seg(2, 4, 6, 6), seg(10, 2, 13, 6), seg(4, 12, 8, 10), seg(11, 13, 14, 11)] },
  // Pebbles / clasts → conglomerate
  conglomerate: { w: 20, h: 20, kids: [ring(6, 6, 3), ring(15, 9, 2.4), ring(10, 16, 2.8), ring(17, 17, 1.7)] },
  // Fine horizontal lines → mudstone
  mudstone: { w: 8, h: 6, kids: [seg(0, 3, 8, 3, 0.8)] },
};

// --- Build one stacked series per layer (single category column). With the
// y-axis reversed + normal stacking, series[0] (the shallowest layer) sits at
// the top, so depth increases downward as required.
const seen = new Set();
const series = layers.map((l) => {
  const firstOfKind = !seen.has(l.litho);
  seen.add(l.litho);
  return {
    name: cap(l.litho),
    color: `url(#litho-${l.litho})`,
    showInLegend: firstOfKind,
    data: [{ y: l.bottom - l.top, formation: l.formation, age: l.age }],
  };
});

// --- Chart ------------------------------------------------------------------
Highcharts.chart("container", {
  chart: {
    type: "column",
    backgroundColor: "transparent",
    animation: false,
    spacing: [24, 28, 24, 24],
    style: { fontFamily: "inherit" },
    events: {
      // Inject lithology patterns into the chart SVG <defs> so `url(#litho-*)`
      // fills resolve (the core bundle ships no pattern-fill module).
      load() {
        const R = this.renderer;
        lithoOrder.forEach((k) => {
          const tex = TEXTURE[k];
          const pat = R.createElement("pattern").attr({
            id: `litho-${k}`,
            patternUnits: "userSpaceOnUse",
            width: tex.w,
            height: tex.h,
          });
          // tinted background — identical hue across light/dark themes
          R.createElement("rect").attr({ width: tex.w, height: tex.h, fill: tintFor[k], "fill-opacity": 0.58 }).add(pat);
          tex.kids.forEach((c) => R.createElement(c.tag).attr(c.attrs).add(pat));
          pat.add(R.defs);
        });

        // --- Left-side geologic time scale: group consecutive layers by period
        // and draw a labelled bracket spanning each period's depth range. This
        // fills the otherwise-empty left band and satisfies the spec hint that
        // age/period names belong on the left side.
        const periods = [];
        layers.forEach((l) => {
          const name = l.age.split(" · ")[0];
          const prev = periods[periods.length - 1];
          if (prev && prev.name === name) prev.bottom = l.bottom;
          else periods.push({ name, top: l.top, bottom: l.bottom });
        });
        const yA = this.yAxis[0];
        const xLine = this.plotLeft + 34; // vertical spine of the bracket
        const xTip = xLine + 16; // horizontal caps point toward the column
        periods.forEach((p) => {
          const yTop = yA.toPixels(p.top);
          const yBot = yA.toPixels(p.bottom);
          R.path(["M", xTip, yTop, "L", xLine, yTop, "L", xLine, yBot, "L", xTip, yBot])
            .attr({ stroke: t.inkSoft, "stroke-width": 1.5, fill: "none" })
            .add();
          R.text(p.name, xTip + 14, (yTop + yBot) / 2 + 6)
            .attr({ align: "left" })
            .css({ color: t.ink, fontSize: "17px", fontWeight: "600" })
            .add();
        });
      },
    },
  },
  credits: { enabled: false },
  colors: t.palette,
  title: {
    text: "column-stratigraphic · javascript · highcharts · anyplot.ai",
    style: { color: t.ink, fontSize: "22px", fontWeight: "600" },
  },
  subtitle: {
    text: "Synthetic borehole BH-1 · Colorado Plateau · lithology by fill pattern",
    style: { color: t.inkSoft, fontSize: "14px" },
  },
  xAxis: {
    categories: ["BH-1"],
    visible: false,
  },
  yAxis: {
    min: 0,
    max: total,
    reversed: true, // depth increases downward
    reversedStacks: false, // keep series[0] (shallowest) at the top of the stack
    tickInterval: 50,
    title: { text: "Depth below surface (m)", style: { color: t.inkSoft, fontSize: "16px" } },
    gridLineColor: t.grid,
    lineColor: t.inkSoft,
    tickColor: t.inkSoft,
    labels: { format: "{value} m", style: { color: t.inkSoft, fontSize: "14px" } },
  },
  legend: {
    title: { text: "Lithology", style: { color: t.ink, fontSize: "14px", fontWeight: "600" } },
    layout: "vertical",
    align: "right",
    verticalAlign: "middle",
    itemStyle: { color: t.inkSoft, fontSize: "14px" },
    itemHoverStyle: { color: t.ink },
    symbolRadius: 2,
    symbolHeight: 16,
    symbolWidth: 16,
    backgroundColor: t.elevatedBg,
    borderColor: t.grid,
    borderWidth: 1,
    borderRadius: 6,
    padding: 14,
    itemMarginBottom: 6,
  },
  tooltip: { enabled: false },
  plotOptions: {
    series: {
      animation: false,
      states: { hover: { enabled: false }, inactive: { opacity: 1 } },
    },
    column: {
      stacking: "normal",
      borderColor: t.ink, // solid layer-boundary lines
      borderWidth: 1.5,
      groupPadding: 0.05,
      pointPadding: 0,
      maxPointWidth: 520,
      dataLabels: {
        enabled: true,
        inside: true,
        align: "center",
        verticalAlign: "middle",
        useHTML: true,
        allowOverlap: true,
        crop: false,
        overflow: "allow",
        formatter() {
          const p = this.point;
          const formation = p.formation || p.options.formation;
          const age = p.age || p.options.age;
          return (
            `<div style="text-align:center;background:${t.pageBg}d9;border:1px solid ${t.grid};` +
            `border-radius:5px;padding:3px 10px;white-space:nowrap;">` +
            `<span style="color:${t.ink};font-weight:600;font-size:13px;">${formation}</span><br>` +
            `<span style="color:${t.inkSoft};font-size:11px;">${age}</span></div>`
          );
        },
        style: { textOutline: "none" },
      },
    },
  },
  series,
});
Runnable source as JSON, for any HTTP client: https://api.anyplot.ai/specs/column-stratigraphic/highcharts/code. Any spec id and library id listed in llms-full.txt fit the same URL shape; every URL below is complete and callable.
{
  "spec_id": "column-stratigraphic",
  "language": "javascript",
  "library": "highcharts",
  "page": "https://anyplot.ai/column-stratigraphic/javascript/highcharts",
  "hub": "https://anyplot.ai/column-stratigraphic",
  "code_json": "https://api.anyplot.ai/specs/column-stratigraphic/highcharts/code",
  "spec_json": "https://api.anyplot.ai/specs/column-stratigraphic",
  "render_light_png": "https://storage.googleapis.com/anyplot-images/plots/column-stratigraphic/javascript/highcharts/plot-light.png",
  "render_dark_png": "https://storage.googleapis.com/anyplot-images/plots/column-stratigraphic/javascript/highcharts/plot-dark.png",
  "interactive_light_html": "https://storage.googleapis.com/anyplot-images/plots/column-stratigraphic/javascript/highcharts/plot-light.html",
  "interactive_dark_html": "https://storage.googleapis.com/anyplot-images/plots/column-stratigraphic/javascript/highcharts/plot-dark.html",
  "quality_score": 92.0,
  "license": "MIT",
  "guide": "https://anyplot.ai/llms.txt"
}
Part of Stratigraphic Column with Lithology Patterns on anyplot.ai.