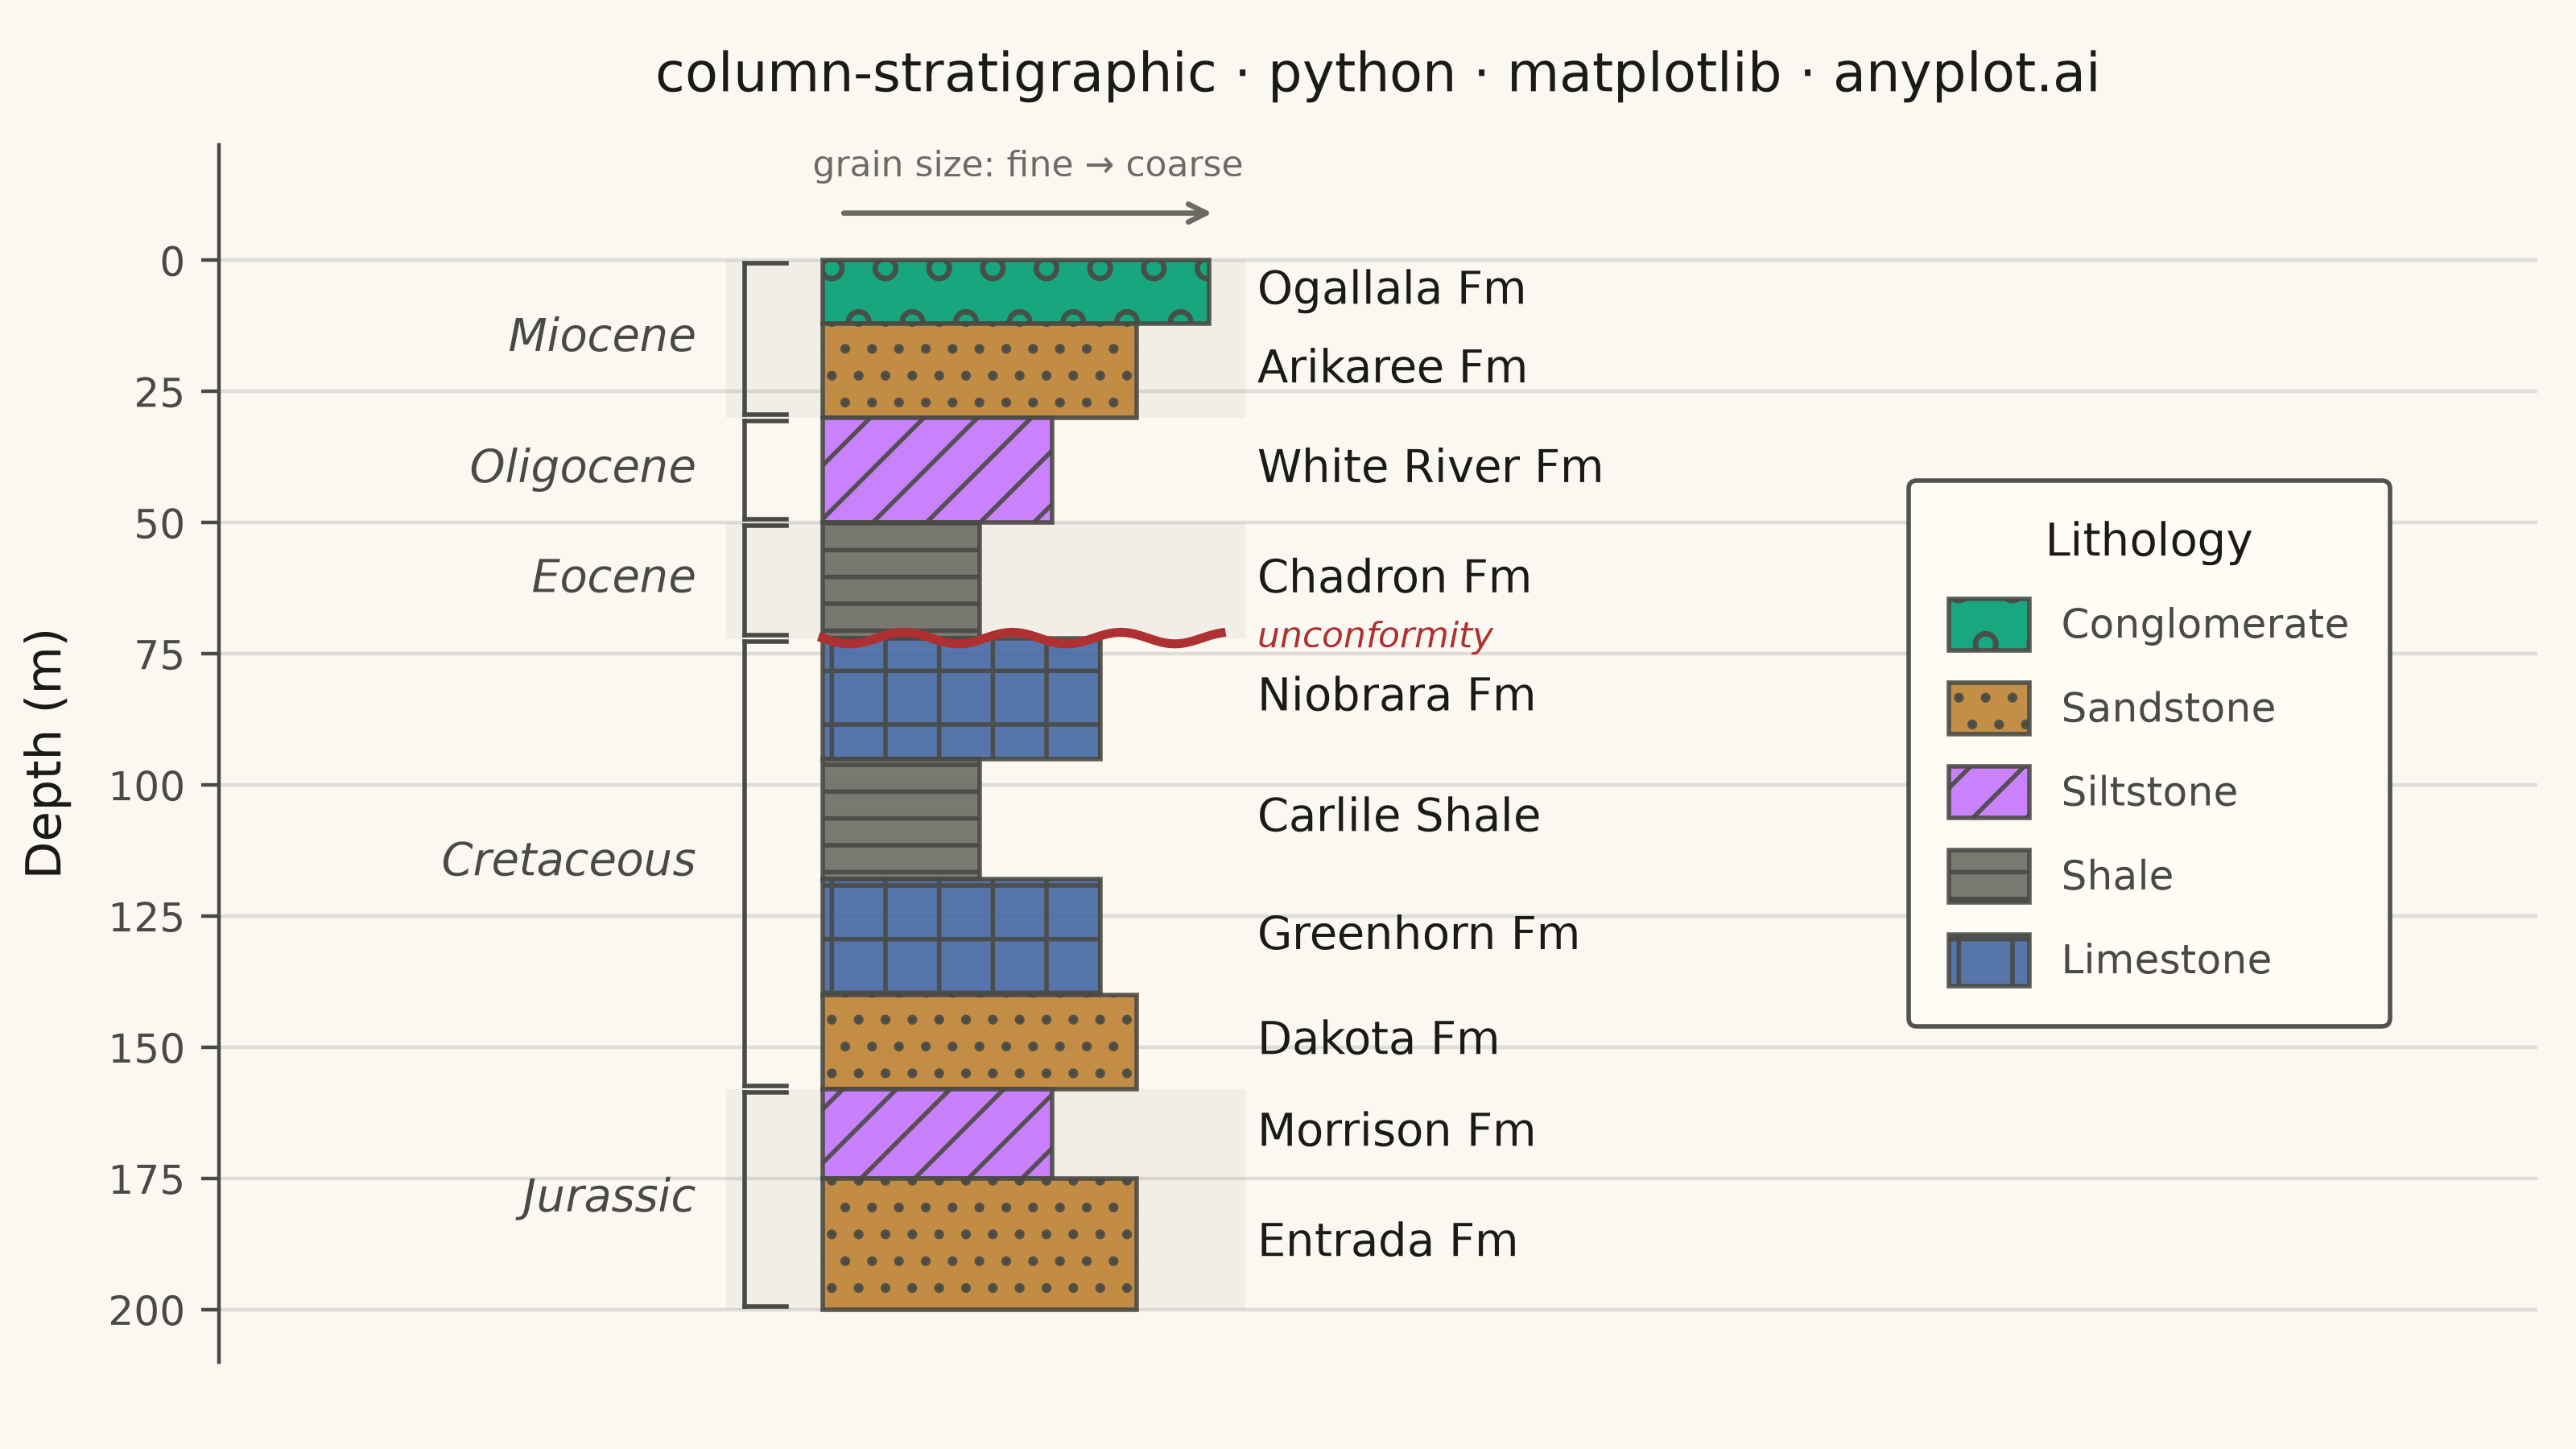
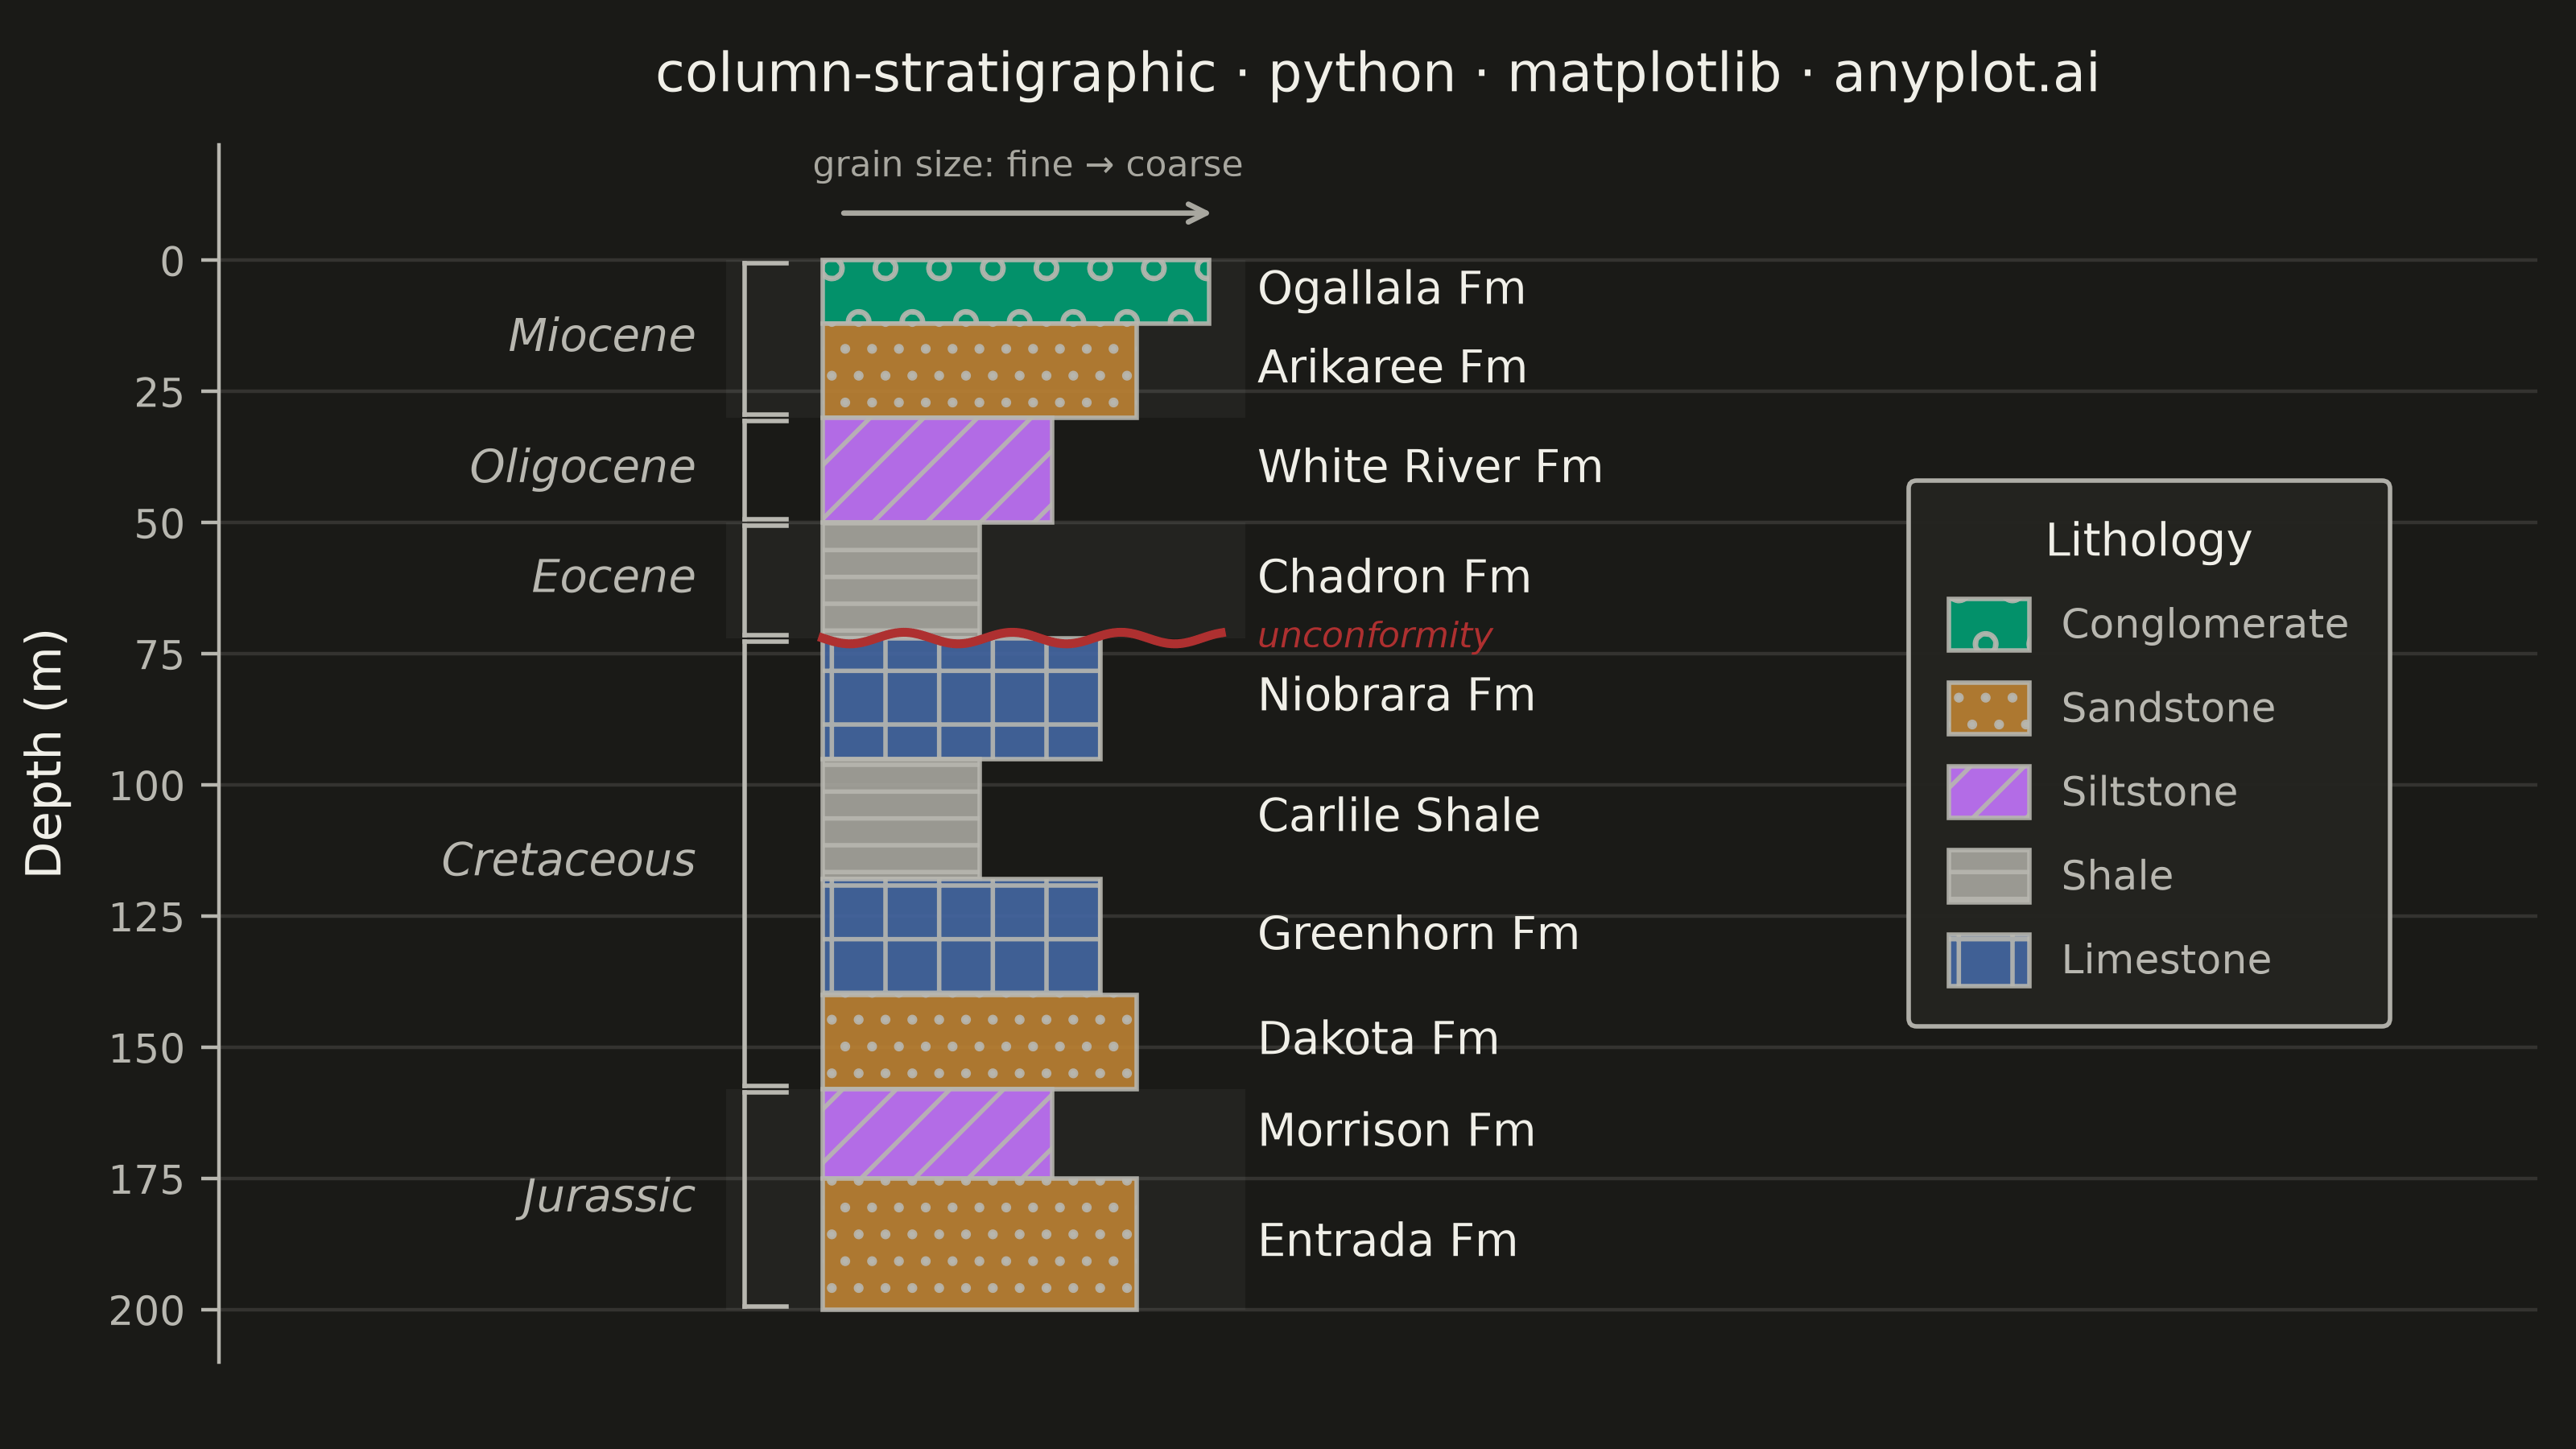
A vertical column visualization showing geological rock layers with standardized lithology patterns, formation names, ages, and thickness scales. Each layer is represented as a stacked rectangular block filled with a distinctive pattern (e.g., brick pattern for limestone, dots for sandstone, dashes for shale) following FGDC/USGS conventions. This plot is essential for communicating subsurface geology and sedimentary sequences in a compact, standardized format.
""" anyplot.ai
column-stratigraphic: Stratigraphic Column with Lithology Patterns
Library: matplotlib 3.11.0 | Python 3.13.14
Quality: 94/100 | Updated: 2026-06-17
"""

import os

import matplotlib.patches as mpatches
import matplotlib.pyplot as plt
import numpy as np


# Theme tokens (see prompts/default-style-guide.md "Theme-adaptive Chrome")
THEME = os.getenv("ANYPLOT_THEME", "light")
PAGE_BG = "#FAF8F1" if THEME == "light" else "#1A1A17"
ELEVATED_BG = "#FFFDF6" if THEME == "light" else "#242420"
INK = "#1A1A17" if THEME == "light" else "#F0EFE8"
INK_SOFT = "#4A4A44" if THEME == "light" else "#B8B7B0"
INK_MUTED = "#6B6A63" if THEME == "light" else "#A8A79F"

# Imprint palette — first categorical series is ALWAYS brand green (#009E73).
# Lithologies are ordered by grain size (coarse → fine), so conglomerate leads.
# Semantic exception: sand → ochre, carbonate → blue, mudrock → muted gray.
IMPRINT_MUTED = "#6B6A63" if THEME == "light" else "#A8A79F"

# Data — synthetic sedimentary borehole section (depth increases downward,
# youngest at top), using real US Great Plains formations and ages.
layers = [
    {"top": 0, "bottom": 12, "lithology": "conglomerate", "formation": "Ogallala Fm", "age": "Miocene"},
    {"top": 12, "bottom": 30, "lithology": "sandstone", "formation": "Arikaree Fm", "age": "Miocene"},
    {"top": 30, "bottom": 50, "lithology": "siltstone", "formation": "White River Fm", "age": "Oligocene"},
    {"top": 50, "bottom": 72, "lithology": "shale", "formation": "Chadron Fm", "age": "Eocene"},
    {"top": 72, "bottom": 95, "lithology": "limestone", "formation": "Niobrara Fm", "age": "Cretaceous"},
    {"top": 95, "bottom": 118, "lithology": "shale", "formation": "Carlile Shale", "age": "Cretaceous"},
    {"top": 118, "bottom": 140, "lithology": "limestone", "formation": "Greenhorn Fm", "age": "Cretaceous"},
    {"top": 140, "bottom": 158, "lithology": "sandstone", "formation": "Dakota Fm", "age": "Cretaceous"},
    {"top": 158, "bottom": 175, "lithology": "siltstone", "formation": "Morrison Fm", "age": "Jurassic"},
    {"top": 175, "bottom": 200, "lithology": "sandstone", "formation": "Entrada Fm", "age": "Jurassic"},
]

# Lithology styles: Imprint color, FGDC-like hatch, grain-size column width.
# Grain size sets the block width (wider = coarser), a standard sed-log convention.
lithology_styles = {
    "conglomerate": {"color": "#009E73", "hatch": "o", "grain": 3.2},  # brand green — first series
    "sandstone": {"color": "#BD8233", "hatch": "..", "grain": 2.6},  # ochre — sand
    "siltstone": {"color": "#C475FD", "hatch": "//", "grain": 1.9},  # lavender
    "shale": {"color": IMPRINT_MUTED, "hatch": "--", "grain": 1.3},  # muted gray — mudrock
    "limestone": {"color": "#4467A3", "hatch": "+", "grain": 2.3},  # blue — carbonate
}
lithology_order = ["conglomerate", "sandstone", "siltstone", "shale", "limestone"]

# Plot — square canvas, depth has no preferred horizontal axis
fig, ax = plt.subplots(figsize=(8, 4.5), dpi=400, facecolor=PAGE_BG)
ax.set_facecolor(PAGE_BG)

column_left = 0.0
max_depth = 200

# Compute the depth span of each geological period
age_spans = {}
for layer in layers:
    age = layer["age"]
    if age not in age_spans:
        age_spans[age] = {"top": layer["top"], "bottom": layer["bottom"]}
    else:
        age_spans[age]["top"] = min(age_spans[age]["top"], layer["top"])
        age_spans[age]["bottom"] = max(age_spans[age]["bottom"], layer["bottom"])

# Subtle alternating period-band shading behind the column (theme-adaptive)
for idx, span in enumerate(age_spans.values()):
    if idx % 2 == 0:
        band = mpatches.Rectangle(
            (-0.8, span["top"]),
            4.3,
            span["bottom"] - span["top"],
            facecolor=INK,
            edgecolor="none",
            alpha=0.045,
            zorder=0,
        )
        ax.add_patch(band)

# Lithology layers — width encodes grain size, hatch encodes rock type
for layer in layers:
    top, bottom = layer["top"], layer["bottom"]
    style = lithology_styles[layer["lithology"]]

    rect = mpatches.Rectangle(
        (column_left, top),
        style["grain"],
        bottom - top,
        facecolor=style["color"],
        edgecolor=INK_SOFT,
        linewidth=1.0,
        hatch=style["hatch"],
        alpha=0.9,
        zorder=2,
    )
    ax.add_patch(rect)

    mid_depth = (top + bottom) / 2
    ax.text(3.6, mid_depth, layer["formation"], fontsize=10, va="center", ha="left", color=INK, zorder=4)

# Unconformity — wavy erosional surface between Eocene and Cretaceous (72 m)
unconformity_depth = 72
x_wave = np.linspace(column_left, 3.3, 120)
y_wave = unconformity_depth + 1.1 * np.sin(x_wave * 7)
ax.plot(x_wave, y_wave, color="#AE3030", linewidth=2.0, zorder=3)
ax.text(
    3.6,
    unconformity_depth,
    "unconformity",
    fontsize=8,
    va="center",
    ha="left",
    fontstyle="italic",
    color="#AE3030",
    zorder=4,
)

# Period (age) labels on the left with bracket lines
bracket_x = -0.65
for age, span in age_spans.items():
    mid = (span["top"] + span["bottom"]) / 2
    ax.text(-1.05, mid, age, fontsize=10, va="center", ha="right", fontstyle="italic", color=INK_SOFT, clip_on=False)
    ax.plot([bracket_x, bracket_x + 0.35], [span["top"] + 0.6, span["top"] + 0.6], color=INK_SOFT, linewidth=1.0)
    ax.plot([bracket_x, bracket_x + 0.35], [span["bottom"] - 0.6, span["bottom"] - 0.6], color=INK_SOFT, linewidth=1.0)
    ax.plot([bracket_x, bracket_x], [span["top"] + 0.6, span["bottom"] - 0.6], color=INK_SOFT, linewidth=1.0)

# Grain-size guide above the column (explains the varying block width)
ax.annotate("", xy=(3.3, -9), xytext=(0.1, -9), arrowprops={"arrowstyle": "->", "color": INK_MUTED, "linewidth": 1.2})
ax.text(1.7, -16, "grain size: fine → coarse", ha="center", fontsize=8, color=INK_MUTED)

# Legend — lithology patterns, in grain-size order
legend_handles = [
    mpatches.Patch(
        facecolor=lithology_styles[lith]["color"],
        edgecolor=INK_SOFT,
        hatch=lithology_styles[lith]["hatch"],
        label=lith.capitalize(),
        alpha=0.9,
        linewidth=1.0,
    )
    for lith in lithology_order
]
leg = ax.legend(
    handles=legend_handles,
    loc="center left",
    bbox_to_anchor=(0.72, 0.5),
    fontsize=9,
    title="Lithology",
    title_fontsize=10,
    framealpha=0.95,
    borderpad=1.0,
    labelspacing=0.8,
    handleheight=1.6,
)
leg.get_frame().set_facecolor(ELEVATED_BG)
leg.get_frame().set_edgecolor(INK_SOFT)
leg.get_title().set_color(INK)
for txt in leg.get_texts():
    txt.set_color(INK_SOFT)

# Style
title = "column-stratigraphic · python · matplotlib · anyplot.ai"
title_fontsize = round(12 * 67 / len(title)) if len(title) > 67 else 12

ax.set_xlim(-5.0, 14.2)
ax.set_ylim(210, -22)
ax.set_ylabel("Depth (m)", fontsize=11, color=INK, labelpad=8)
ax.set_title(title, fontsize=title_fontsize, fontweight="medium", color=INK, pad=12)
ax.set_yticks(np.arange(0, max_depth + 1, 25))
ax.tick_params(axis="y", labelsize=9, length=4, colors=INK_SOFT)
ax.set_xticks([])
ax.spines["top"].set_visible(False)
ax.spines["right"].set_visible(False)
ax.spines["bottom"].set_visible(False)
ax.spines["left"].set_color(INK_SOFT)
ax.yaxis.grid(True, alpha=0.12, linewidth=0.8, color=INK)

fig.subplots_adjust(left=0.085, right=0.985, top=0.9, bottom=0.06)
plt.savefig(f"plot-{THEME}.png", dpi=400, facecolor=PAGE_BG)
Runnable source as JSON, for any HTTP client: https://api.anyplot.ai/specs/column-stratigraphic/matplotlib/code. Any spec id and library id listed in llms-full.txt fit the same URL shape; every URL below is complete and callable.
{
  "spec_id": "column-stratigraphic",
  "language": "python",
  "library": "matplotlib",
  "page": "https://anyplot.ai/column-stratigraphic/python/matplotlib",
  "hub": "https://anyplot.ai/column-stratigraphic",
  "code_json": "https://api.anyplot.ai/specs/column-stratigraphic/matplotlib/code",
  "spec_json": "https://api.anyplot.ai/specs/column-stratigraphic",
  "render_light_png": "https://storage.googleapis.com/anyplot-images/plots/column-stratigraphic/python/matplotlib/plot-light.png",
  "render_dark_png": "https://storage.googleapis.com/anyplot-images/plots/column-stratigraphic/python/matplotlib/plot-dark.png",
  "quality_score": 94.0,
  "license": "MIT",
  "guide": "https://anyplot.ai/llms.txt"
}
Part of Stratigraphic Column with Lithology Patterns on anyplot.ai.