The same plot in 14 other libraries — JavaScript: D3.js, Apache ECharts, Highcharts, MUI X Charts; Python: Altair, Bokeh, lets-plot, Matplotlib, Plotly, plotnine, Pygal, Seaborn; R: ggplot2; Julia: Makie.jl. Compare all 15 side by side: Decision Boundary Classifier Visualization in Python, R, Julia and JavaScript.
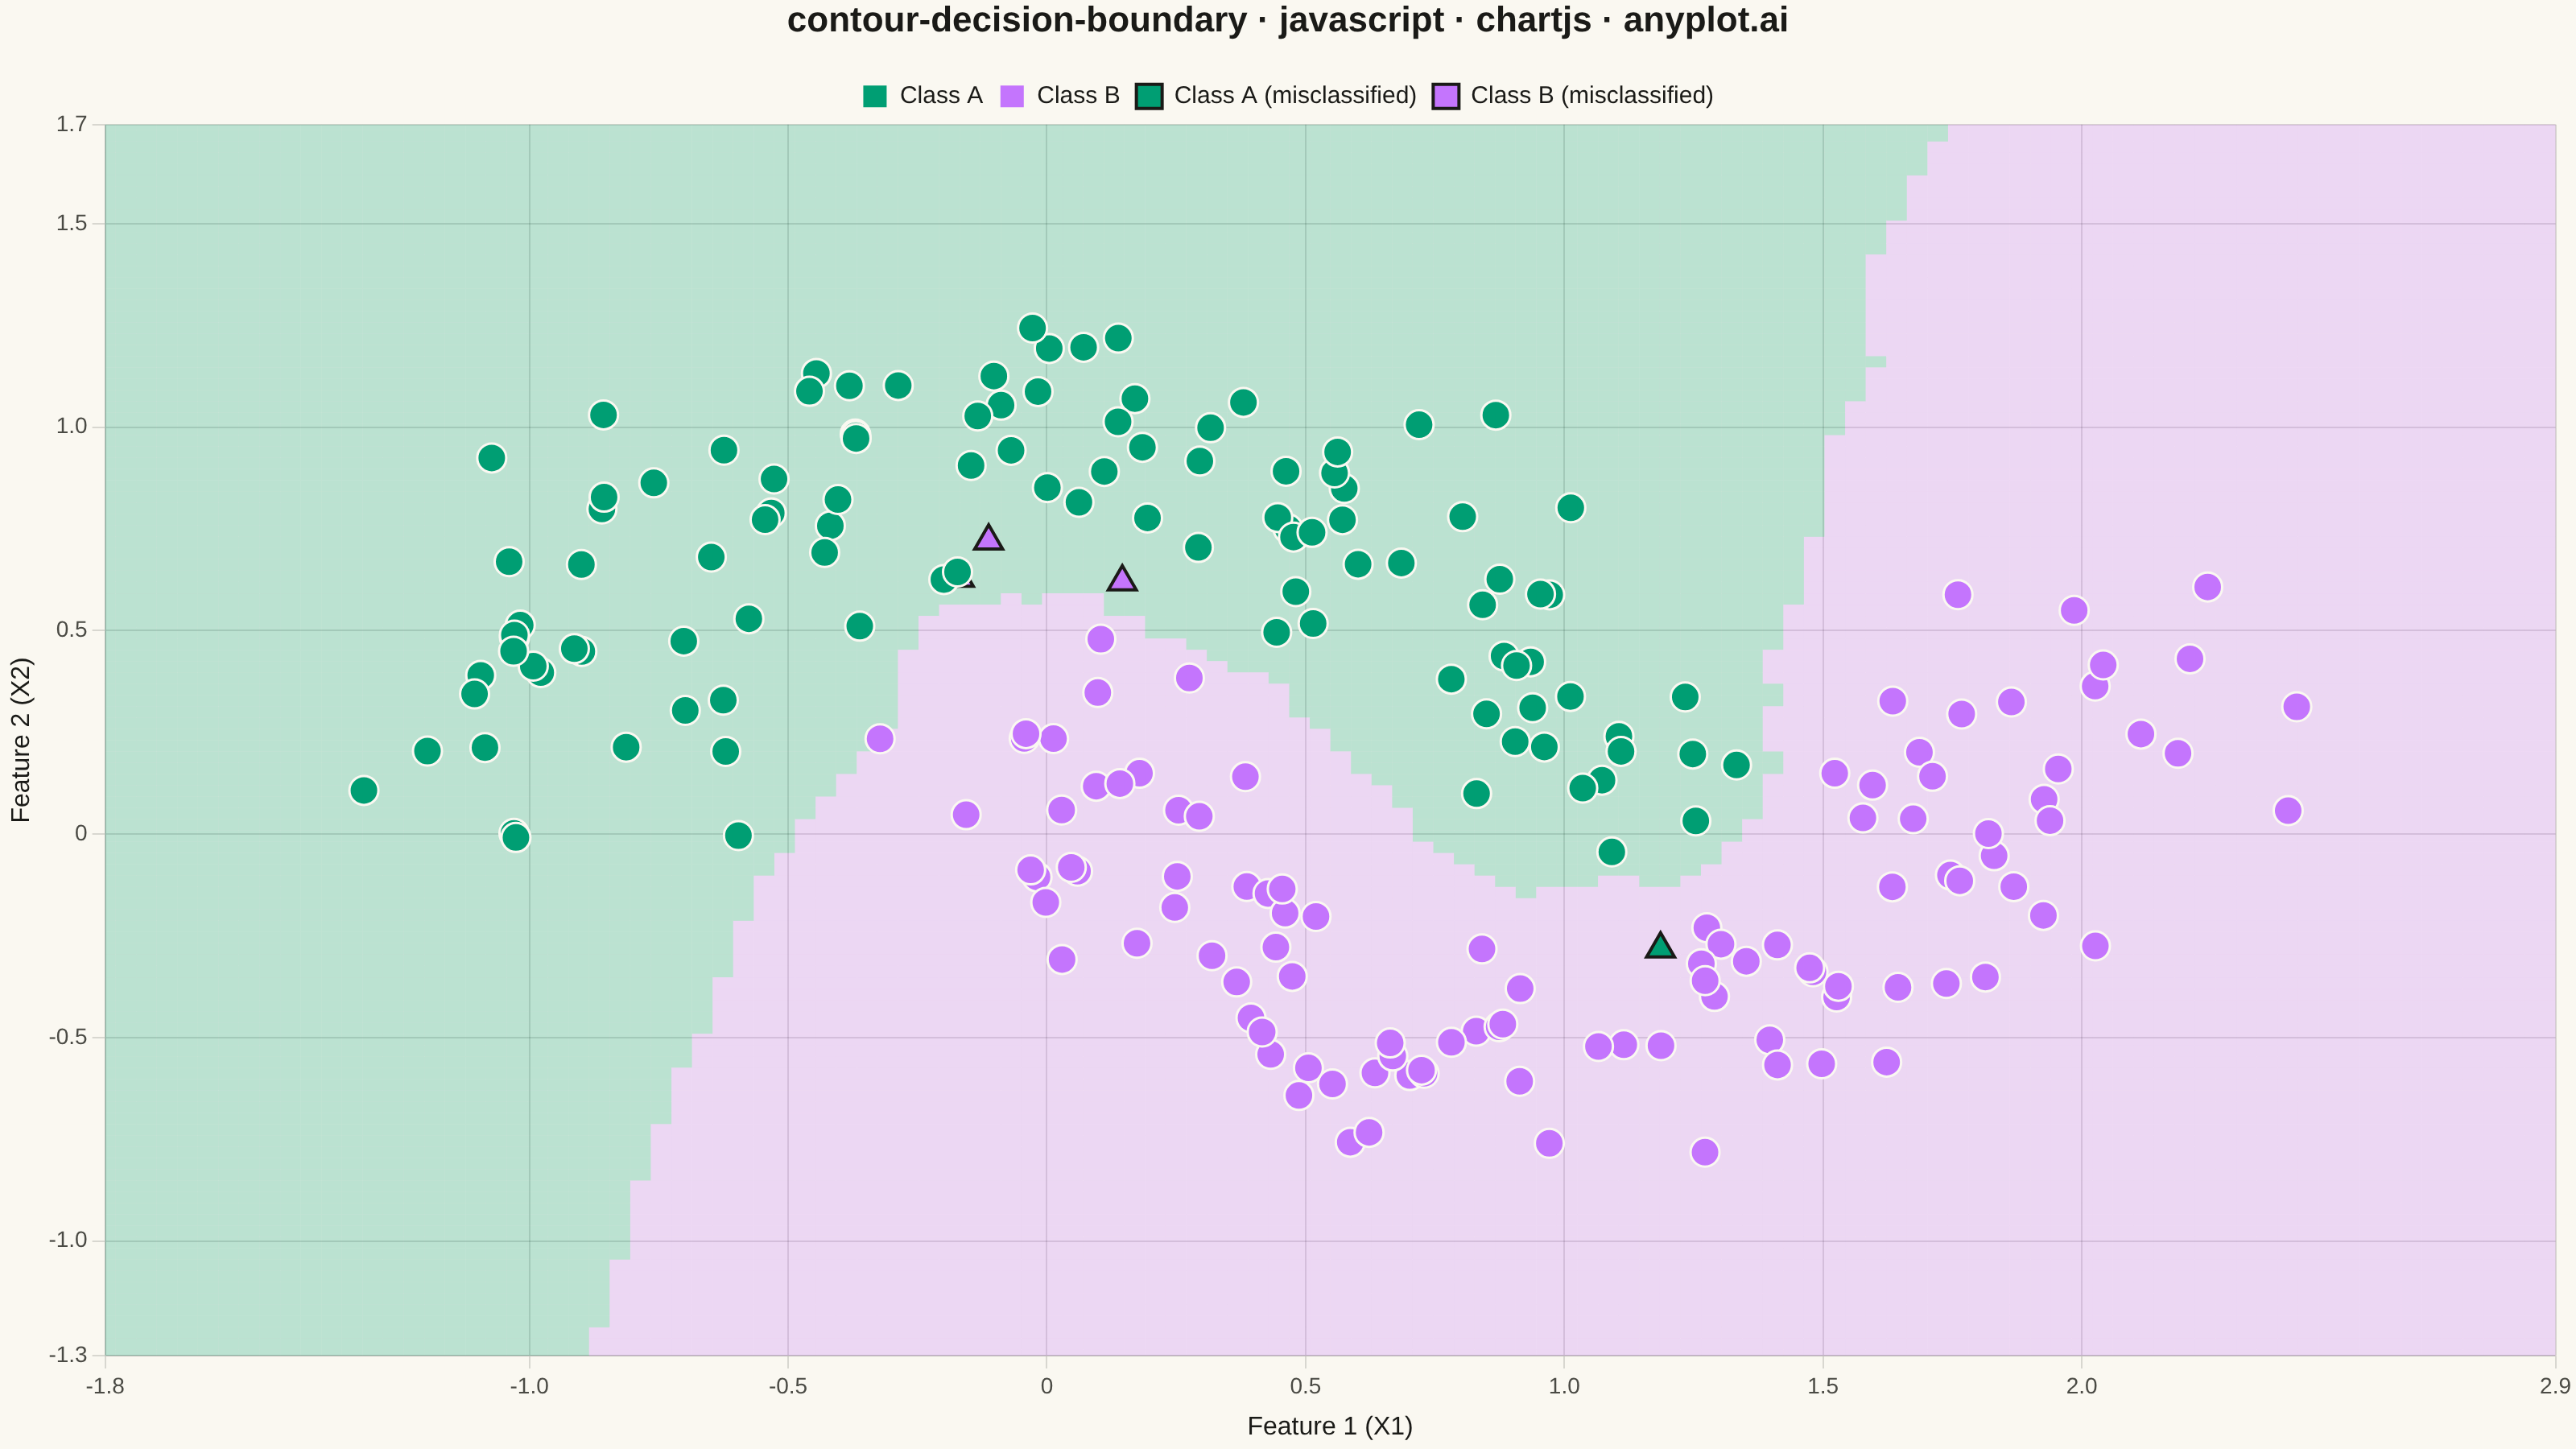
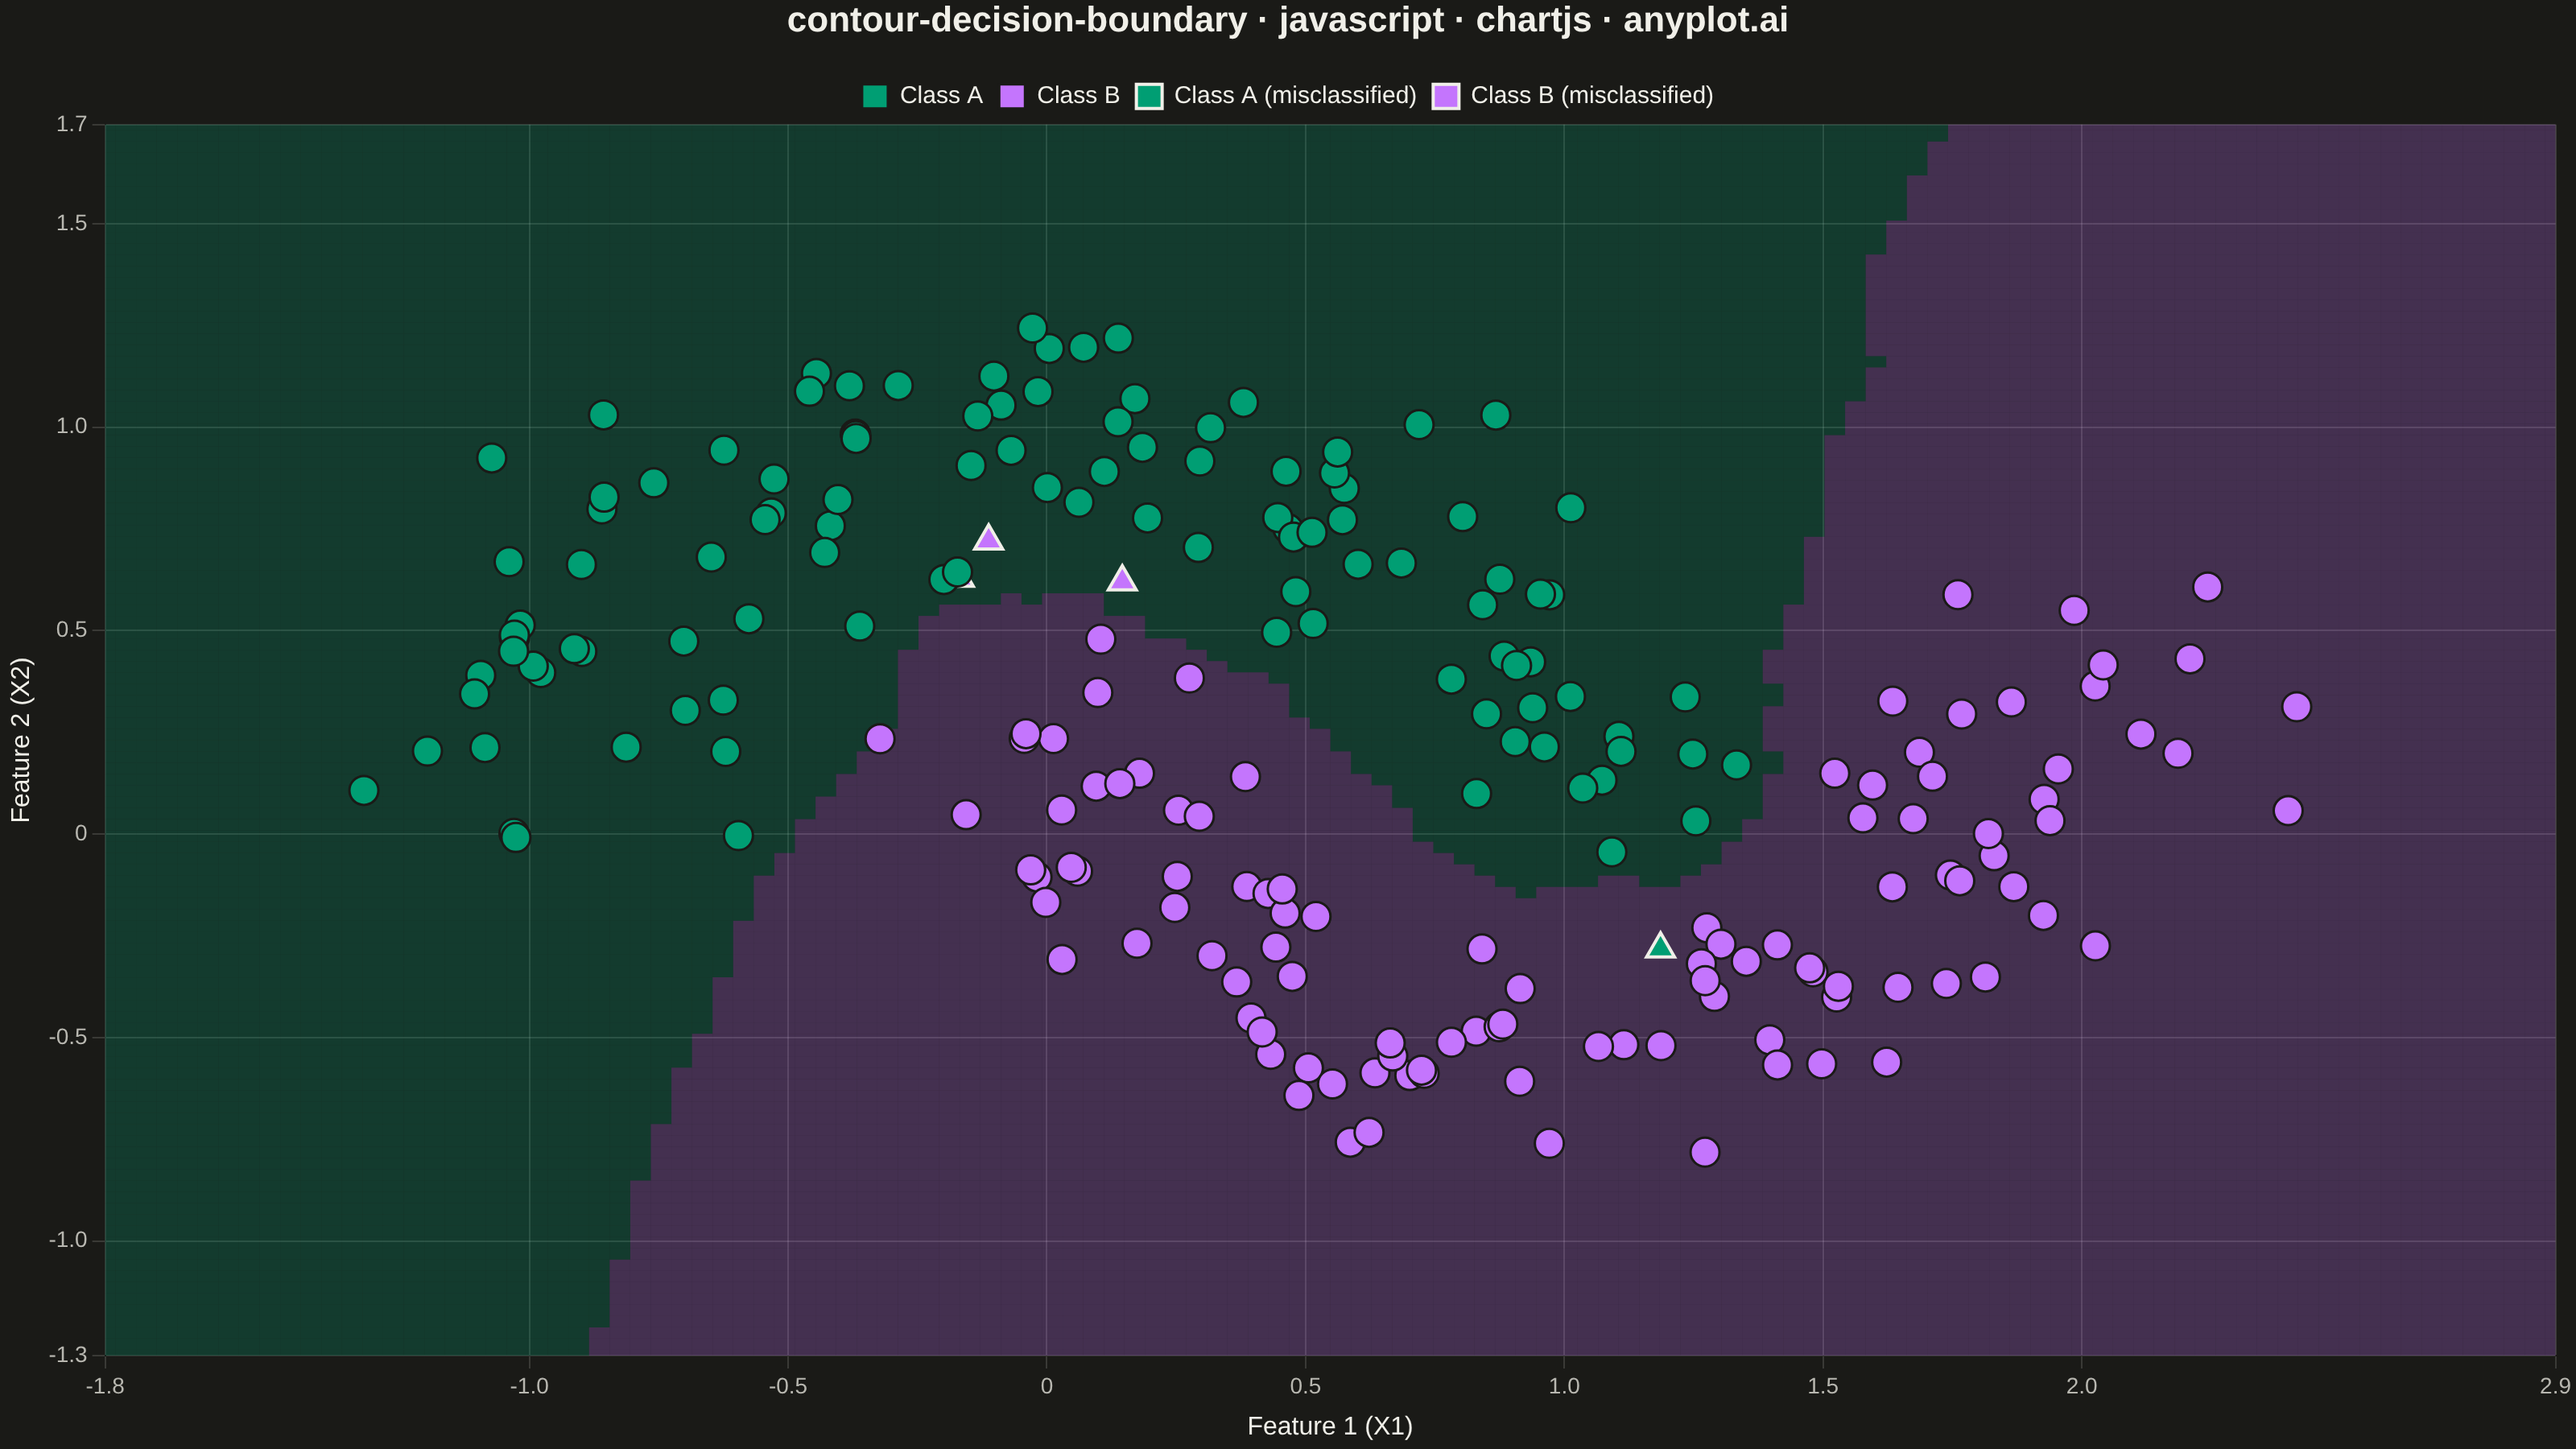
A decision boundary visualization showing how a classifier partitions 2D feature space into predicted class regions. Colored regions indicate the predicted class at each point in the feature space, with training data points overlaid to show how well the classifier separates different classes. This visualization is essential for understanding classifier behavior, identifying decision boundaries, and evaluating classification accuracy in machine learning.
// anyplot.ai
// contour-decision-boundary: Decision Boundary Classifier Visualization
// Library: chartjs 4.4.7 | JavaScript 22.23.2
// Quality: 91/100 | Created: 2026-09-04

const t = window.ANYPLOT_TOKENS;

// --- Deterministic PRNG (LCG) + Gaussian via Box-Muller ---------------------
let lcgState = 42;
const rand = () => {
  lcgState = (lcgState * 1664525 + 1013904223) % 4294967296;
  return lcgState / 4294967296;
};
const gaussian = () => {
  const u1 = Math.max(rand(), 1e-9);
  const u2 = rand();
  return Math.sqrt(-2 * Math.log(u1)) * Math.cos(2 * Math.PI * u2);
};

// --- Data: two interleaving crescents (make_moons-style), 220 points -------
const perMoon = 110;
const noiseStd = 0.18;
const trainX1 = [];
const trainX2 = [];
const trainY = [];

for (let i = 0; i < perMoon; i++) {
  const theta = (Math.PI * i) / (perMoon - 1);
  trainX1.push(Math.cos(theta) + gaussian() * noiseStd);
  trainX2.push(Math.sin(theta) + gaussian() * noiseStd);
  trainY.push(0);
}
for (let i = 0; i < perMoon; i++) {
  const theta = (Math.PI * i) / (perMoon - 1);
  trainX1.push(1 - Math.cos(theta) + gaussian() * noiseStd);
  trainX2.push(0.5 - Math.sin(theta) + gaussian() * noiseStd);
  trainY.push(1);
}

// --- k-NN classifier (k=15, majority vote on squared Euclidean distance) ---
const K = 15;
const knnPredict = (px, py) => {
  const dists = new Array(trainX1.length);
  for (let i = 0; i < trainX1.length; i++) {
    const dx = px - trainX1[i];
    const dy = py - trainX2[i];
    dists[i] = { d: dx * dx + dy * dy, y: trainY[i] };
  }
  dists.sort((a, b) => a.d - b.d);
  let votes0 = 0;
  let votes1 = 0;
  for (let i = 0; i < K; i++) {
    if (dists[i].y === 0) votes0++;
    else votes1++;
  }
  return votes0 >= votes1 ? 0 : 1;
};

const trainPred = trainX1.map((x, i) => knnPredict(x, trainX2[i]));

// --- Mesh grid over feature space, classified to paint decision regions ----
const pad = 0.5;
const xMin = Math.min(...trainX1) - pad;
const xMax = Math.max(...trainX1) + pad;
const yMin = Math.min(...trainX2) - pad;
const yMax = Math.max(...trainX2) + pad;
const nx = 120;
const ny = 110;
const stepX = (xMax - xMin) / (nx - 1);
const stepY = (yMax - yMin) / (ny - 1);

// Each mesh point becomes an exact half-step-wide rectangle so the plugin
// below can tile the decision regions with no gaps and no overlap.
const cellsA = [];
const cellsB = [];
for (let i = 0; i < nx; i++) {
  const x = xMin + stepX * i;
  for (let j = 0; j < ny; j++) {
    const y = yMin + stepY * j;
    (knnPredict(x, y) === 0 ? cellsA : cellsB).push({
      x0: x - stepX / 2,
      x1: x + stepX / 2,
      y0: y - stepY / 2,
      y1: y + stepY / 2,
    });
  }
}

// --- Split training points into correct / misclassified per class ---------
const groups = { a0: [], a1: [], b0: [], b1: [] };
trainX1.forEach((x, i) => {
  const y = trainX2[i];
  const correct = trainPred[i] === trainY[i];
  if (trainY[i] === 0) (correct ? groups.a0 : groups.a1).push({ x, y });
  else (correct ? groups.b0 : groups.b1).push({ x, y });
});

// --- Colors ------------------------------------------------------------
const hexToRgba = (hex, alpha) => {
  const r = parseInt(hex.slice(1, 3), 16);
  const g = parseInt(hex.slice(3, 5), 16);
  const b = parseInt(hex.slice(5, 7), 16);
  return `rgba(${r}, ${g}, ${b}, ${alpha})`;
};
const colorA = t.palette[0]; // #009E73 brand green — Class A
const colorB = t.palette[1]; // lavender — Class B
const fillA = hexToRgba(colorA, 0.25);
const fillB = hexToRgba(colorB, 0.25);

// --- Decision-region plugin --------------------------------------------
// A point-marker mesh approximates a filled contour with translucent rects,
// but neighboring markers never tile perfectly against the axis grid
// spacing, leaving a crosshatch of background/gridline pixels showing
// through. Painting exact pixel rectangles from the scales at draw time
// (one per mesh cell, edge-to-edge, no overlap) gives a truly smooth fill.
const decisionRegionPlugin = {
  id: "decisionRegions",
  beforeDatasetsDraw(chart) {
    const { ctx, chartArea, scales } = chart;
    ctx.save();
    ctx.beginPath();
    ctx.rect(
      chartArea.left,
      chartArea.top,
      chartArea.right - chartArea.left,
      chartArea.bottom - chartArea.top,
    );
    ctx.clip();
    const paintCells = (cells, color) => {
      ctx.fillStyle = color;
      for (const c of cells) {
        const px0 = scales.x.getPixelForValue(c.x0);
        const px1 = scales.x.getPixelForValue(c.x1);
        const py0 = scales.y.getPixelForValue(c.y0);
        const py1 = scales.y.getPixelForValue(c.y1);
        ctx.fillRect(
          Math.min(px0, px1),
          Math.min(py0, py1),
          Math.abs(px1 - px0),
          Math.abs(py1 - py0),
        );
      }
    };
    paintCells(cellsA, fillA);
    paintCells(cellsB, fillB);
    ctx.restore();
  },
};

// --- Mount -----------------------------------------------------------------
const canvas = document.createElement("canvas");
document.getElementById("container").appendChild(canvas);

// --- Chart -----------------------------------------------------------------
new Chart(canvas, {
  type: "scatter",
  data: {
    datasets: [
      {
        label: "Class A",
        data: groups.a0,
        backgroundColor: colorA,
        borderColor: t.pageBg,
        borderWidth: 1.5,
        pointStyle: "circle",
        pointRadius: 9,
        pointHoverRadius: 9,
      },
      {
        label: "Class B",
        data: groups.b0,
        backgroundColor: colorB,
        borderColor: t.pageBg,
        borderWidth: 1.5,
        pointStyle: "circle",
        pointRadius: 9,
        pointHoverRadius: 9,
      },
      // Misclassified markers are drawn last so a correctly-classified
      // point never occludes a rarer, more important misclassified one.
      {
        label: "Class A (misclassified)",
        data: groups.a1,
        backgroundColor: colorA,
        borderColor: t.ink,
        borderWidth: 2,
        pointStyle: "triangle",
        pointRadius: 10,
        pointHoverRadius: 10,
      },
      {
        label: "Class B (misclassified)",
        data: groups.b1,
        backgroundColor: colorB,
        borderColor: t.ink,
        borderWidth: 2,
        pointStyle: "triangle",
        pointRadius: 10,
        pointHoverRadius: 10,
      },
    ],
  },
  plugins: [decisionRegionPlugin],
  options: {
    responsive: true,
    maintainAspectRatio: false,
    animation: false,
    plugins: {
      title: {
        display: true,
        text: "contour-decision-boundary · javascript · chartjs · anyplot.ai",
        color: t.ink,
        font: { size: 22 },
        padding: { bottom: 16 },
      },
      legend: {
        position: "top",
        labels: {
          color: t.ink,
          font: { size: 15 },
          boxWidth: 16,
        },
      },
    },
    scales: {
      x: {
        min: xMin,
        max: xMax,
        title: {
          display: true,
          text: "Feature 1 (X1)",
          color: t.ink,
          font: { size: 16 },
        },
        ticks: { color: t.inkSoft, font: { size: 14 } },
        grid: { color: t.grid },
      },
      y: {
        min: yMin,
        max: yMax,
        title: {
          display: true,
          text: "Feature 2 (X2)",
          color: t.ink,
          font: { size: 16 },
        },
        ticks: { color: t.inkSoft, font: { size: 14 } },
        grid: { color: t.grid },
      },
    },
  },
});
Runnable source as JSON, for any HTTP client: https://api.anyplot.ai/specs/contour-decision-boundary/chartjs/code. Any spec id and library id listed in llms-full.txt fit the same URL shape; every URL below is complete and callable.
{
  "spec_id": "contour-decision-boundary",
  "language": "javascript",
  "library": "chartjs",
  "page": "https://anyplot.ai/contour-decision-boundary/javascript/chartjs",
  "hub": "https://anyplot.ai/contour-decision-boundary",
  "code_json": "https://api.anyplot.ai/specs/contour-decision-boundary/chartjs/code",
  "spec_json": "https://api.anyplot.ai/specs/contour-decision-boundary",
  "render_light_png": "https://storage.googleapis.com/anyplot-images/plots/contour-decision-boundary/javascript/chartjs/plot-light.png",
  "render_dark_png": "https://storage.googleapis.com/anyplot-images/plots/contour-decision-boundary/javascript/chartjs/plot-dark.png",
  "interactive_light_html": "https://storage.googleapis.com/anyplot-images/plots/contour-decision-boundary/javascript/chartjs/plot-light.html",
  "interactive_dark_html": "https://storage.googleapis.com/anyplot-images/plots/contour-decision-boundary/javascript/chartjs/plot-dark.html",
  "quality_score": 91.0,
  "license": "MIT",
  "guide": "https://anyplot.ai/llms.txt"
}
Part of Decision Boundary Classifier Visualization on anyplot.ai.