The same plot in 14 other libraries — JavaScript: Chart.js, D3.js, Apache ECharts, MUI X Charts; Python: Altair, Bokeh, lets-plot, Matplotlib, Plotly, plotnine, Pygal, Seaborn; R: ggplot2; Julia: Makie.jl. Compare all 15 side by side: Decision Boundary Classifier Visualization in Python, R, Julia and JavaScript.
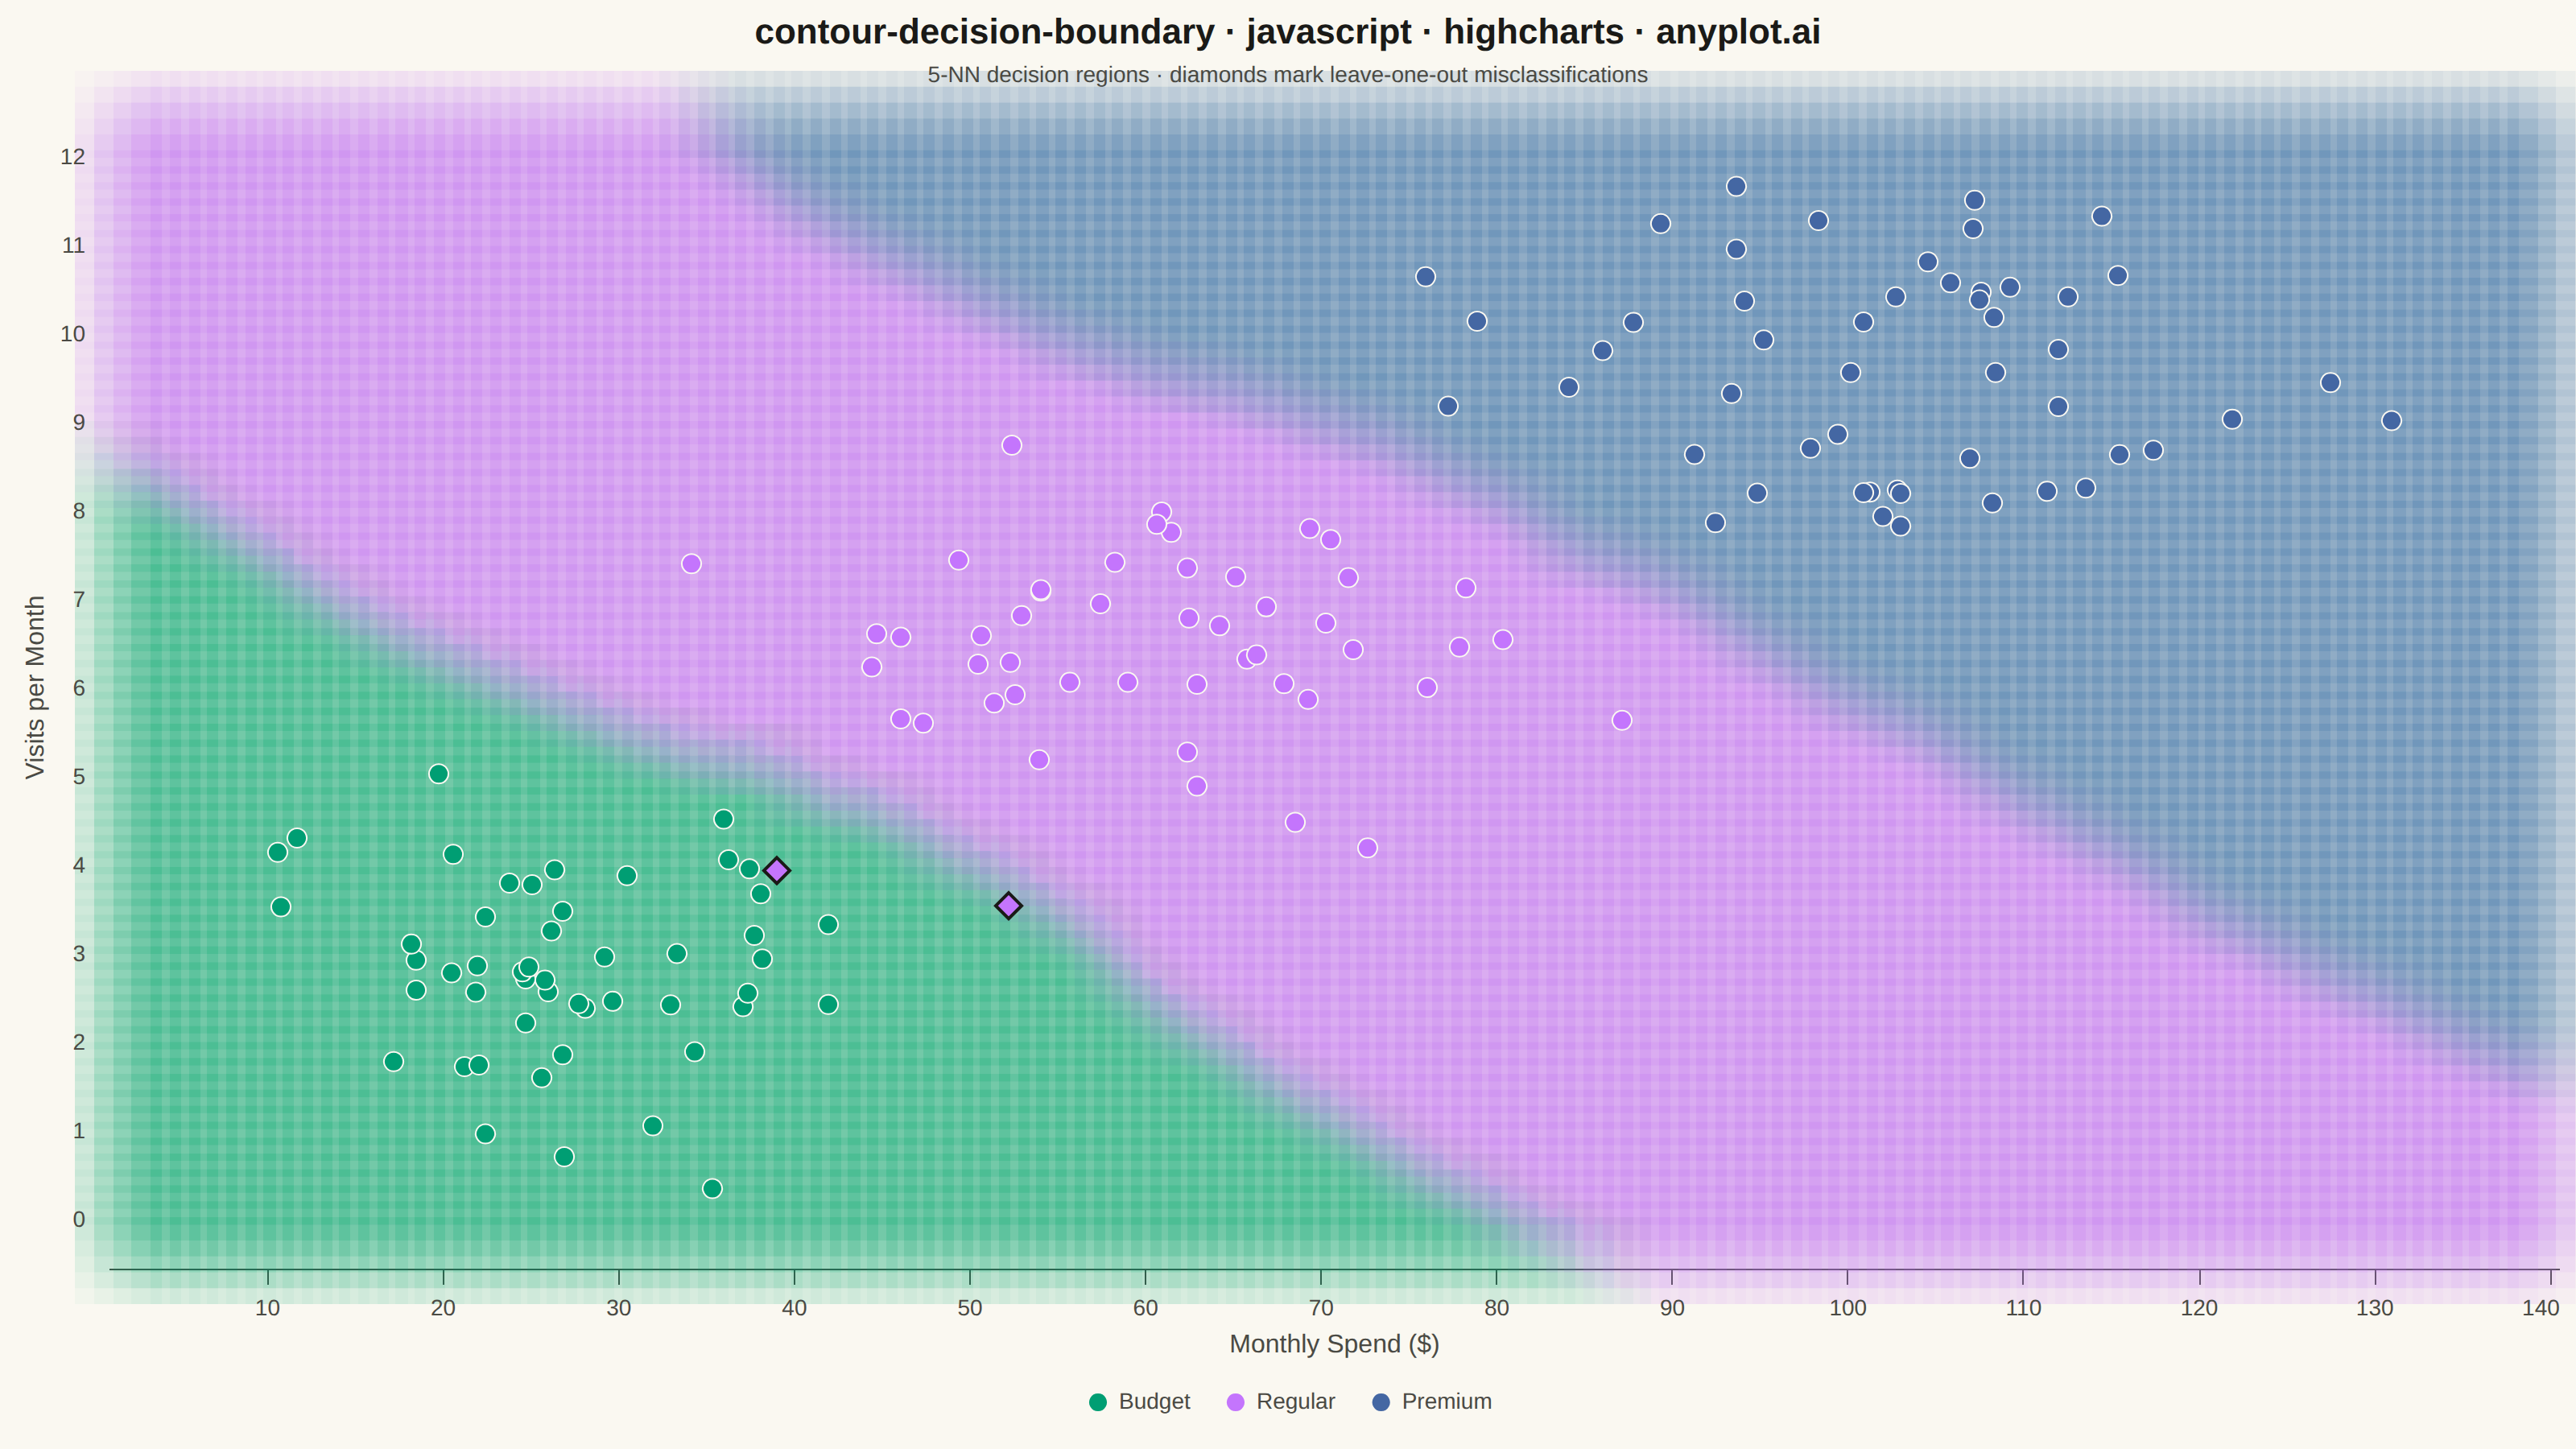
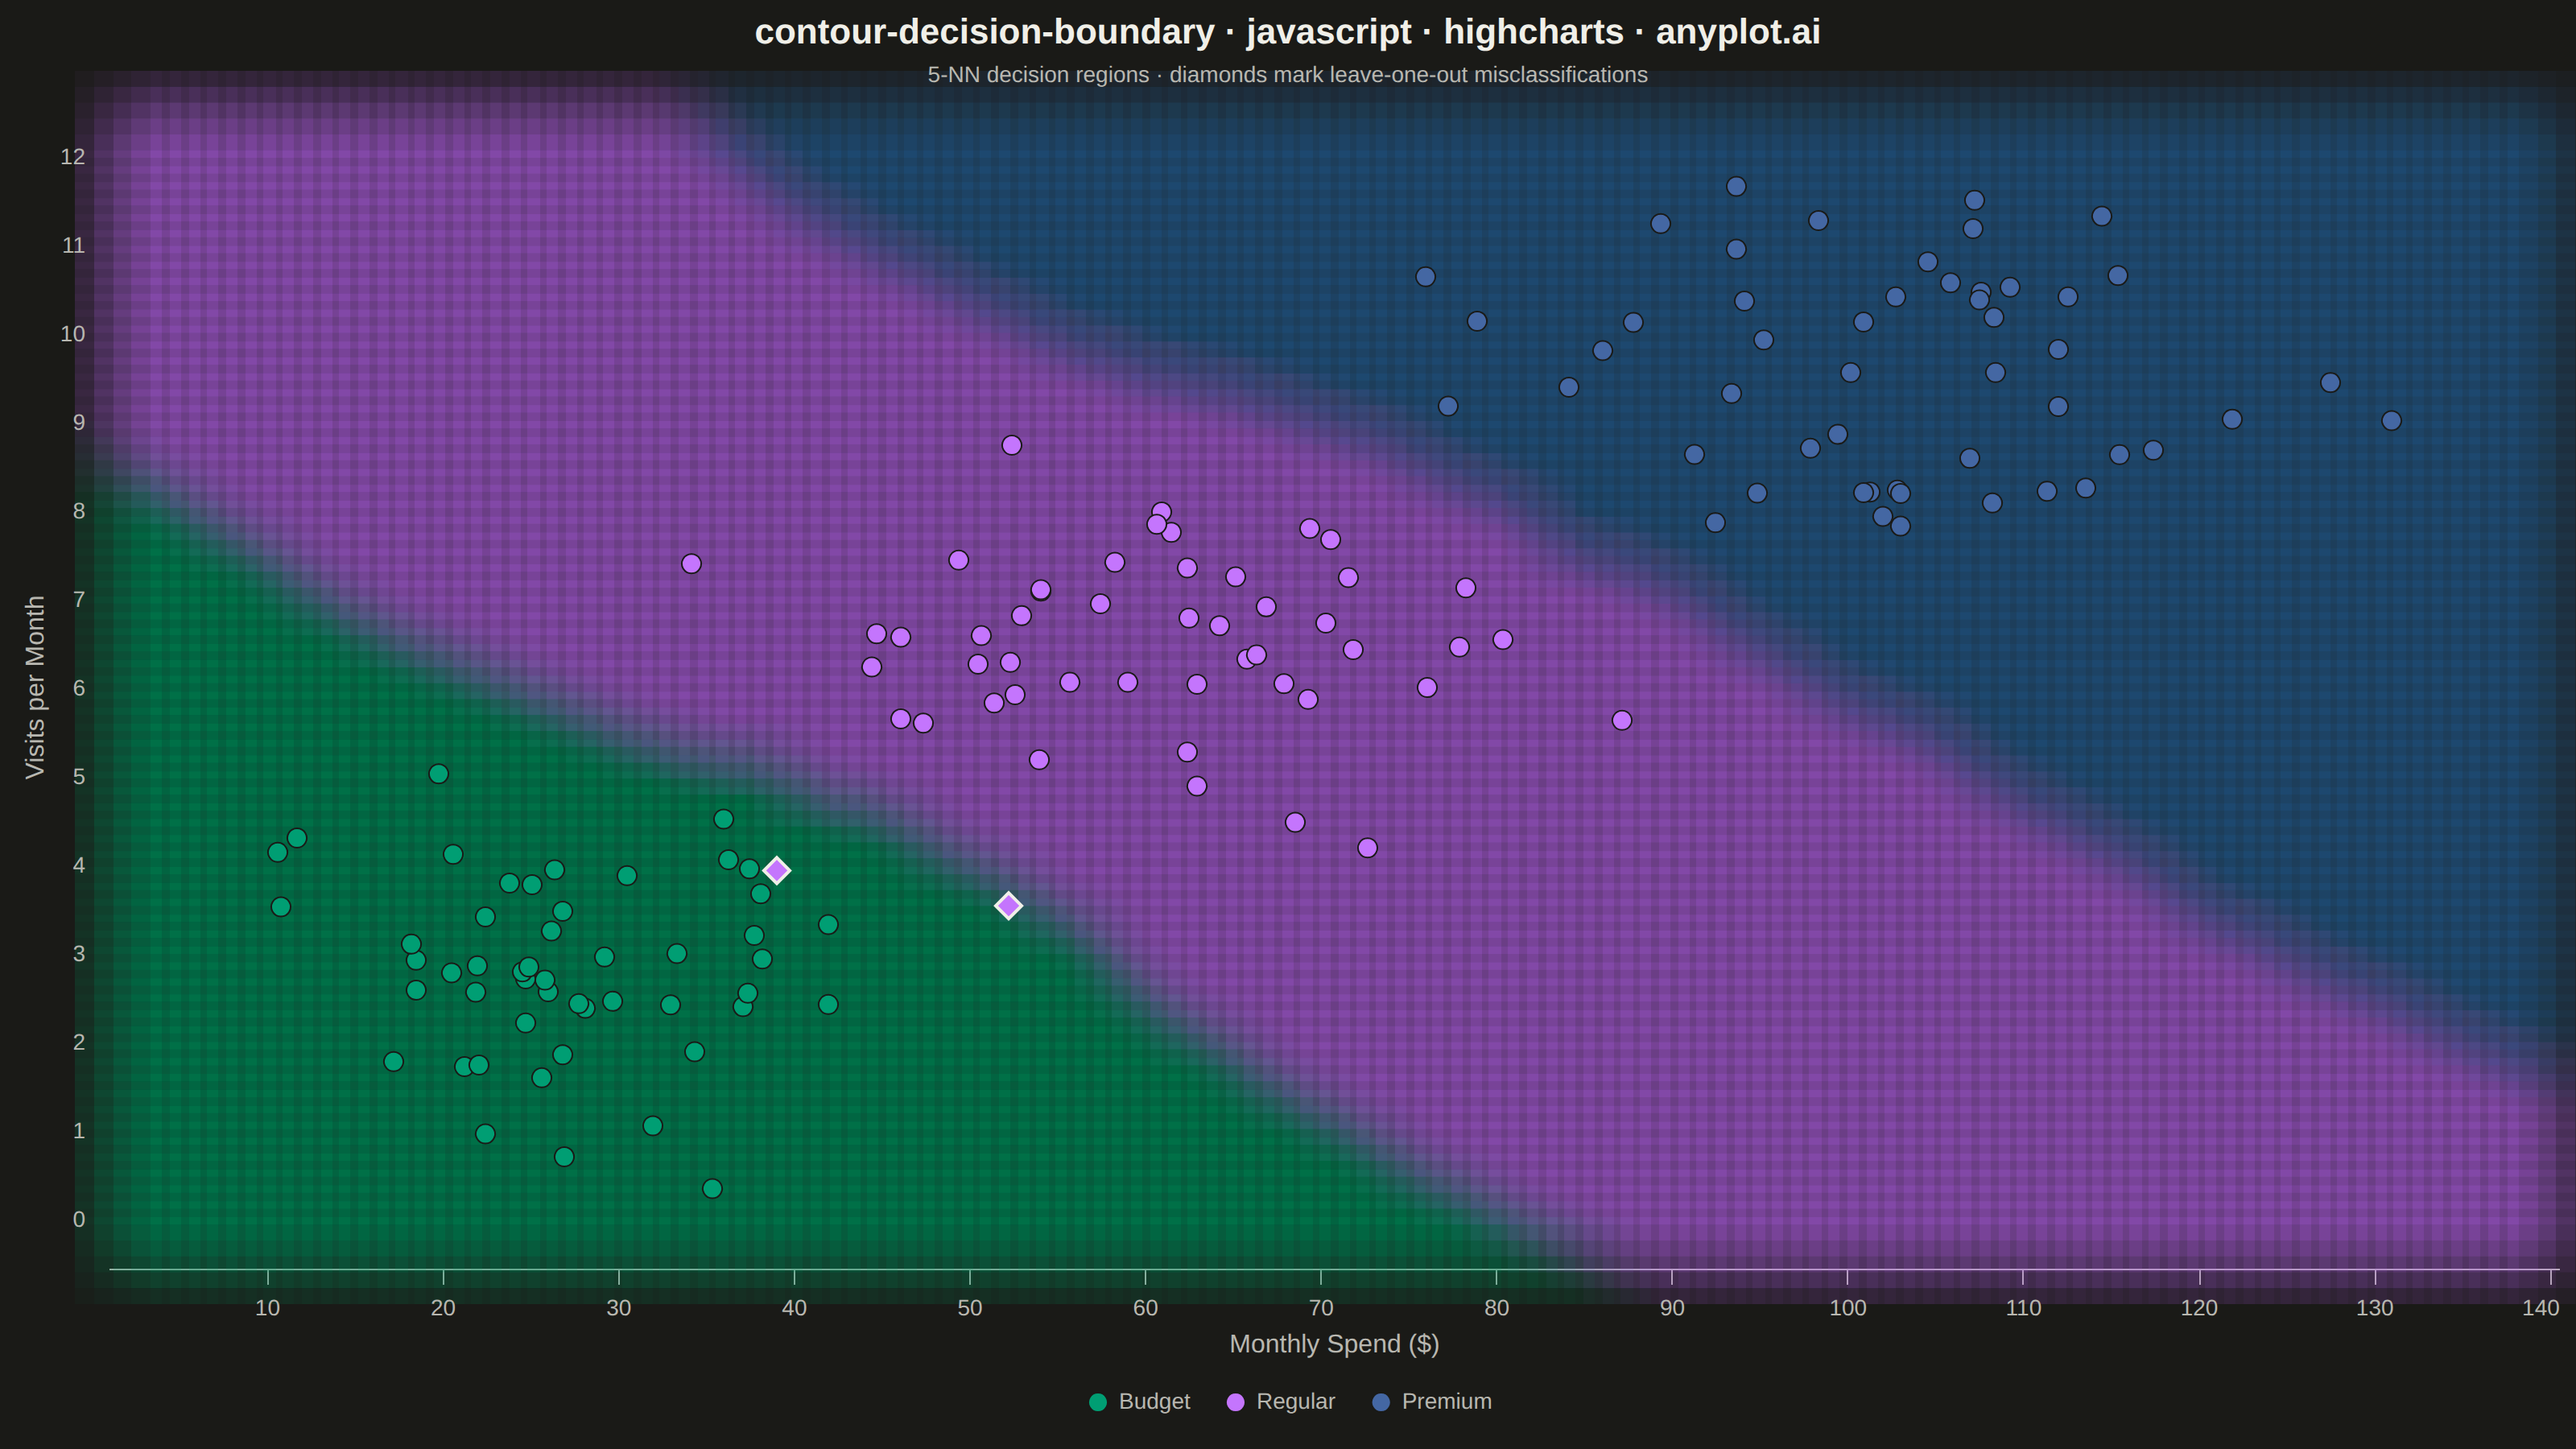
A decision boundary visualization showing how a classifier partitions 2D feature space into predicted class regions. Colored regions indicate the predicted class at each point in the feature space, with training data points overlaid to show how well the classifier separates different classes. This visualization is essential for understanding classifier behavior, identifying decision boundaries, and evaluating classification accuracy in machine learning.
// anyplot.ai
// contour-decision-boundary: Decision Boundary Classifier Visualization
// Library: highcharts 12.6.0 | JavaScript 22.23.2
// Quality: 81/100 | Created: 2026-09-04

const t = window.ANYPLOT_TOKENS;
const size = window.ANYPLOT_SIZE;

// --- Data: synthetic customer segments (monthly spend vs. visit frequency) --
function makeLcg(seed) {
  let state = seed >>> 0;
  return function lcg() {
    state = (1664525 * state + 1013904223) >>> 0;
    return state / 4294967296;
  };
}

function gaussian(rng) {
  const u1 = Math.max(rng(), 1e-9);
  const u2 = rng();
  return Math.sqrt(-2 * Math.log(u1)) * Math.cos(2 * Math.PI * u2);
}

const rng = makeLcg(42);
const segments = [
  { name: "Budget", spendMean: 25, spendSd: 9, visitMean: 3.0, visitSd: 1.0 },
  { name: "Regular", spendMean: 60, spendSd: 11, visitMean: 6.2, visitSd: 1.3 },
  { name: "Premium", spendMean: 102, spendSd: 13, visitMean: 9.6, visitSd: 1.2 },
];
const pointsPerSegment = 50;

const trainSpend = [];
const trainVisits = [];
const trainClass = [];
segments.forEach((segment, classIndex) => {
  for (let i = 0; i < pointsPerSegment; i++) {
    trainSpend.push(segment.spendMean + gaussian(rng) * segment.spendSd);
    trainVisits.push(segment.visitMean + gaussian(rng) * segment.visitSd);
    trainClass.push(classIndex);
  }
});

// --- k-NN classifier (k=5, Euclidean distance on standardized features) ----
function meanStd(values) {
  const mean = values.reduce((sum, v) => sum + v, 0) / values.length;
  const variance = values.reduce((sum, v) => sum + (v - mean) * (v - mean), 0) / values.length;
  return [mean, Math.sqrt(variance)];
}

const [spendMean, spendSd] = meanStd(trainSpend);
const [visitMean, visitSd] = meanStd(trainVisits);
const trainSpendZ = trainSpend.map((v) => (v - spendMean) / spendSd);
const trainVisitZ = trainVisits.map((v) => (v - visitMean) / visitSd);

const K_NEIGHBORS = 5;

function knnPredict(spendZ, visitZ, excludeIndex) {
  const distances = [];
  for (let i = 0; i < trainSpendZ.length; i++) {
    if (i === excludeIndex) continue;
    const dSpend = spendZ - trainSpendZ[i];
    const dVisit = visitZ - trainVisitZ[i];
    distances.push([dSpend * dSpend + dVisit * dVisit, trainClass[i]]);
  }
  distances.sort((a, b) => a[0] - b[0]);
  const votes = new Array(segments.length).fill(0);
  for (let i = 0; i < K_NEIGHBORS; i++) votes[distances[i][1]] += 1;
  let bestClass = 0;
  for (let c = 1; c < votes.length; c++) if (votes[c] > votes[bestClass]) bestClass = c;
  return bestClass;
}

// Leave-one-out prediction flags every training point as correct/misclassified.
const trainPredicted = trainClass.map((_, i) => knnPredict(trainSpendZ[i], trainVisitZ[i], i));

// --- Mesh grid: classify a dense grid to paint the decision regions --------
const margin = 0.08;
const spendRange = Math.max(...trainSpend) - Math.min(...trainSpend);
const visitRange = Math.max(...trainVisits) - Math.min(...trainVisits);
const spendMin = Math.min(...trainSpend) - margin * spendRange;
const spendMax = Math.max(...trainSpend) + margin * spendRange;
const visitMin = Math.min(...trainVisits) - margin * visitRange;
const visitMax = Math.max(...trainVisits) + margin * visitRange;

// Grid resolution follows the mount's pixel aspect so each cell renders ~square.
// Dense enough (per spec: 100x100-200x200) that the boundary reads as a smooth
// frontier rather than a staircase-stepped mesh.
const gridCols = 130;
const gridRows = Math.max(36, Math.round(gridCols * (size.height / size.width)));
const cellPx = (size.width - 150) / gridCols;
// Squares overlap heavily (each cell covered by several neighbors) so the
// per-square alpha compounds into a flat, seamless wash instead of a visible
// grid of tile edges; the per-square opacity below is lowered to compensate.
const cellRadius = Math.ceil(cellPx * 2.4);

const regionPoints = segments.map(() => []);
for (let i = 0; i < gridCols; i++) {
  const spend = spendMin + ((i + 0.5) * (spendMax - spendMin)) / gridCols;
  const spendZ = (spend - spendMean) / spendSd;
  for (let j = 0; j < gridRows; j++) {
    const visits = visitMin + ((j + 0.5) * (visitMax - visitMin)) / gridRows;
    const visitZ = (visits - visitMean) / visitSd;
    const predicted = knnPredict(spendZ, visitZ, -1);
    regionPoints[predicted].push([spend, visits]);
  }
}

// --- Chart -------------------------------------------------------------------
const regionSeries = segments.map((segment, classIndex) => ({
  type: "scatter",
  name: segment.name + " region",
  data: regionPoints[classIndex],
  marker: {
    symbol: "square",
    radius: cellRadius,
    fillColor: Highcharts.color(t.palette[classIndex]).setOpacity(0.035).get(),
    lineWidth: 0,
  },
  enableMouseTracking: false,
  showInLegend: false,
  states: { hover: { enabled: false } },
}));

const trainingSeries = segments.map((segment, classIndex) => {
  const data = [];
  for (let i = 0; i < trainClass.length; i++) {
    if (trainClass[i] !== classIndex) continue;
    const correct = trainPredicted[i] === trainClass[i];
    data.push({
      x: trainSpend[i],
      y: trainVisits[i],
      marker: correct
        ? { symbol: "circle", radius: 6, lineWidth: 1, lineColor: t.pageBg }
        : { symbol: "diamond", radius: 8, lineWidth: 2, lineColor: t.ink },
    });
  }
  return {
    type: "scatter",
    name: segment.name,
    color: t.palette[classIndex],
    marker: { symbol: "circle", radius: 6, lineWidth: 1, lineColor: t.pageBg },
    data,
    states: { hover: { enabled: false } },
  };
});

Highcharts.chart("container", {
  chart: {
    type: "scatter",
    backgroundColor: "transparent",
    animation: false,
    style: { fontFamily: "inherit" },
  },
  credits: { enabled: false },
  colors: t.palette,
  title: {
    text: "contour-decision-boundary · javascript · highcharts · anyplot.ai",
    style: { color: t.ink, fontSize: "22px", fontWeight: "600" },
  },
  subtitle: {
    text: "5-NN decision regions · diamonds mark leave-one-out misclassifications",
    style: { color: t.inkSoft, fontSize: "14px" },
  },
  xAxis: {
    title: { text: "Monthly Spend ($)", style: { color: t.inkSoft, fontSize: "16px" } },
    min: spendMin,
    max: spendMax,
    startOnTick: false,
    endOnTick: false,
    lineColor: t.inkSoft,
    tickColor: t.inkSoft,
    gridLineWidth: 0,
    labels: { style: { color: t.inkSoft, fontSize: "14px" } },
  },
  yAxis: {
    title: { text: "Visits per Month", style: { color: t.inkSoft, fontSize: "16px" } },
    min: visitMin,
    max: visitMax,
    startOnTick: false,
    endOnTick: false,
    lineColor: t.inkSoft,
    tickColor: t.inkSoft,
    gridLineWidth: 0,
    labels: { style: { color: t.inkSoft, fontSize: "14px" } },
  },
  legend: {
    itemStyle: { color: t.inkSoft, fontSize: "14px" },
    itemHoverStyle: { color: t.ink },
  },
  tooltip: {
    pointFormat: "Spend: {point.x:.0f}<br/>Visits: {point.y:.1f}",
  },
  plotOptions: {
    series: { animation: false },
  },
  series: [...regionSeries, ...trainingSeries],
});
Runnable source as JSON, for any HTTP client: https://api.anyplot.ai/specs/contour-decision-boundary/highcharts/code. Any spec id and library id listed in llms-full.txt fit the same URL shape; every URL below is complete and callable.
{
  "spec_id": "contour-decision-boundary",
  "language": "javascript",
  "library": "highcharts",
  "page": "https://anyplot.ai/contour-decision-boundary/javascript/highcharts",
  "hub": "https://anyplot.ai/contour-decision-boundary",
  "code_json": "https://api.anyplot.ai/specs/contour-decision-boundary/highcharts/code",
  "spec_json": "https://api.anyplot.ai/specs/contour-decision-boundary",
  "render_light_png": "https://storage.googleapis.com/anyplot-images/plots/contour-decision-boundary/javascript/highcharts/plot-light.png",
  "render_dark_png": "https://storage.googleapis.com/anyplot-images/plots/contour-decision-boundary/javascript/highcharts/plot-dark.png",
  "interactive_light_html": "https://storage.googleapis.com/anyplot-images/plots/contour-decision-boundary/javascript/highcharts/plot-light.html",
  "interactive_dark_html": "https://storage.googleapis.com/anyplot-images/plots/contour-decision-boundary/javascript/highcharts/plot-dark.html",
  "quality_score": 81.0,
  "license": "MIT",
  "guide": "https://anyplot.ai/llms.txt"
}
Part of Decision Boundary Classifier Visualization on anyplot.ai.