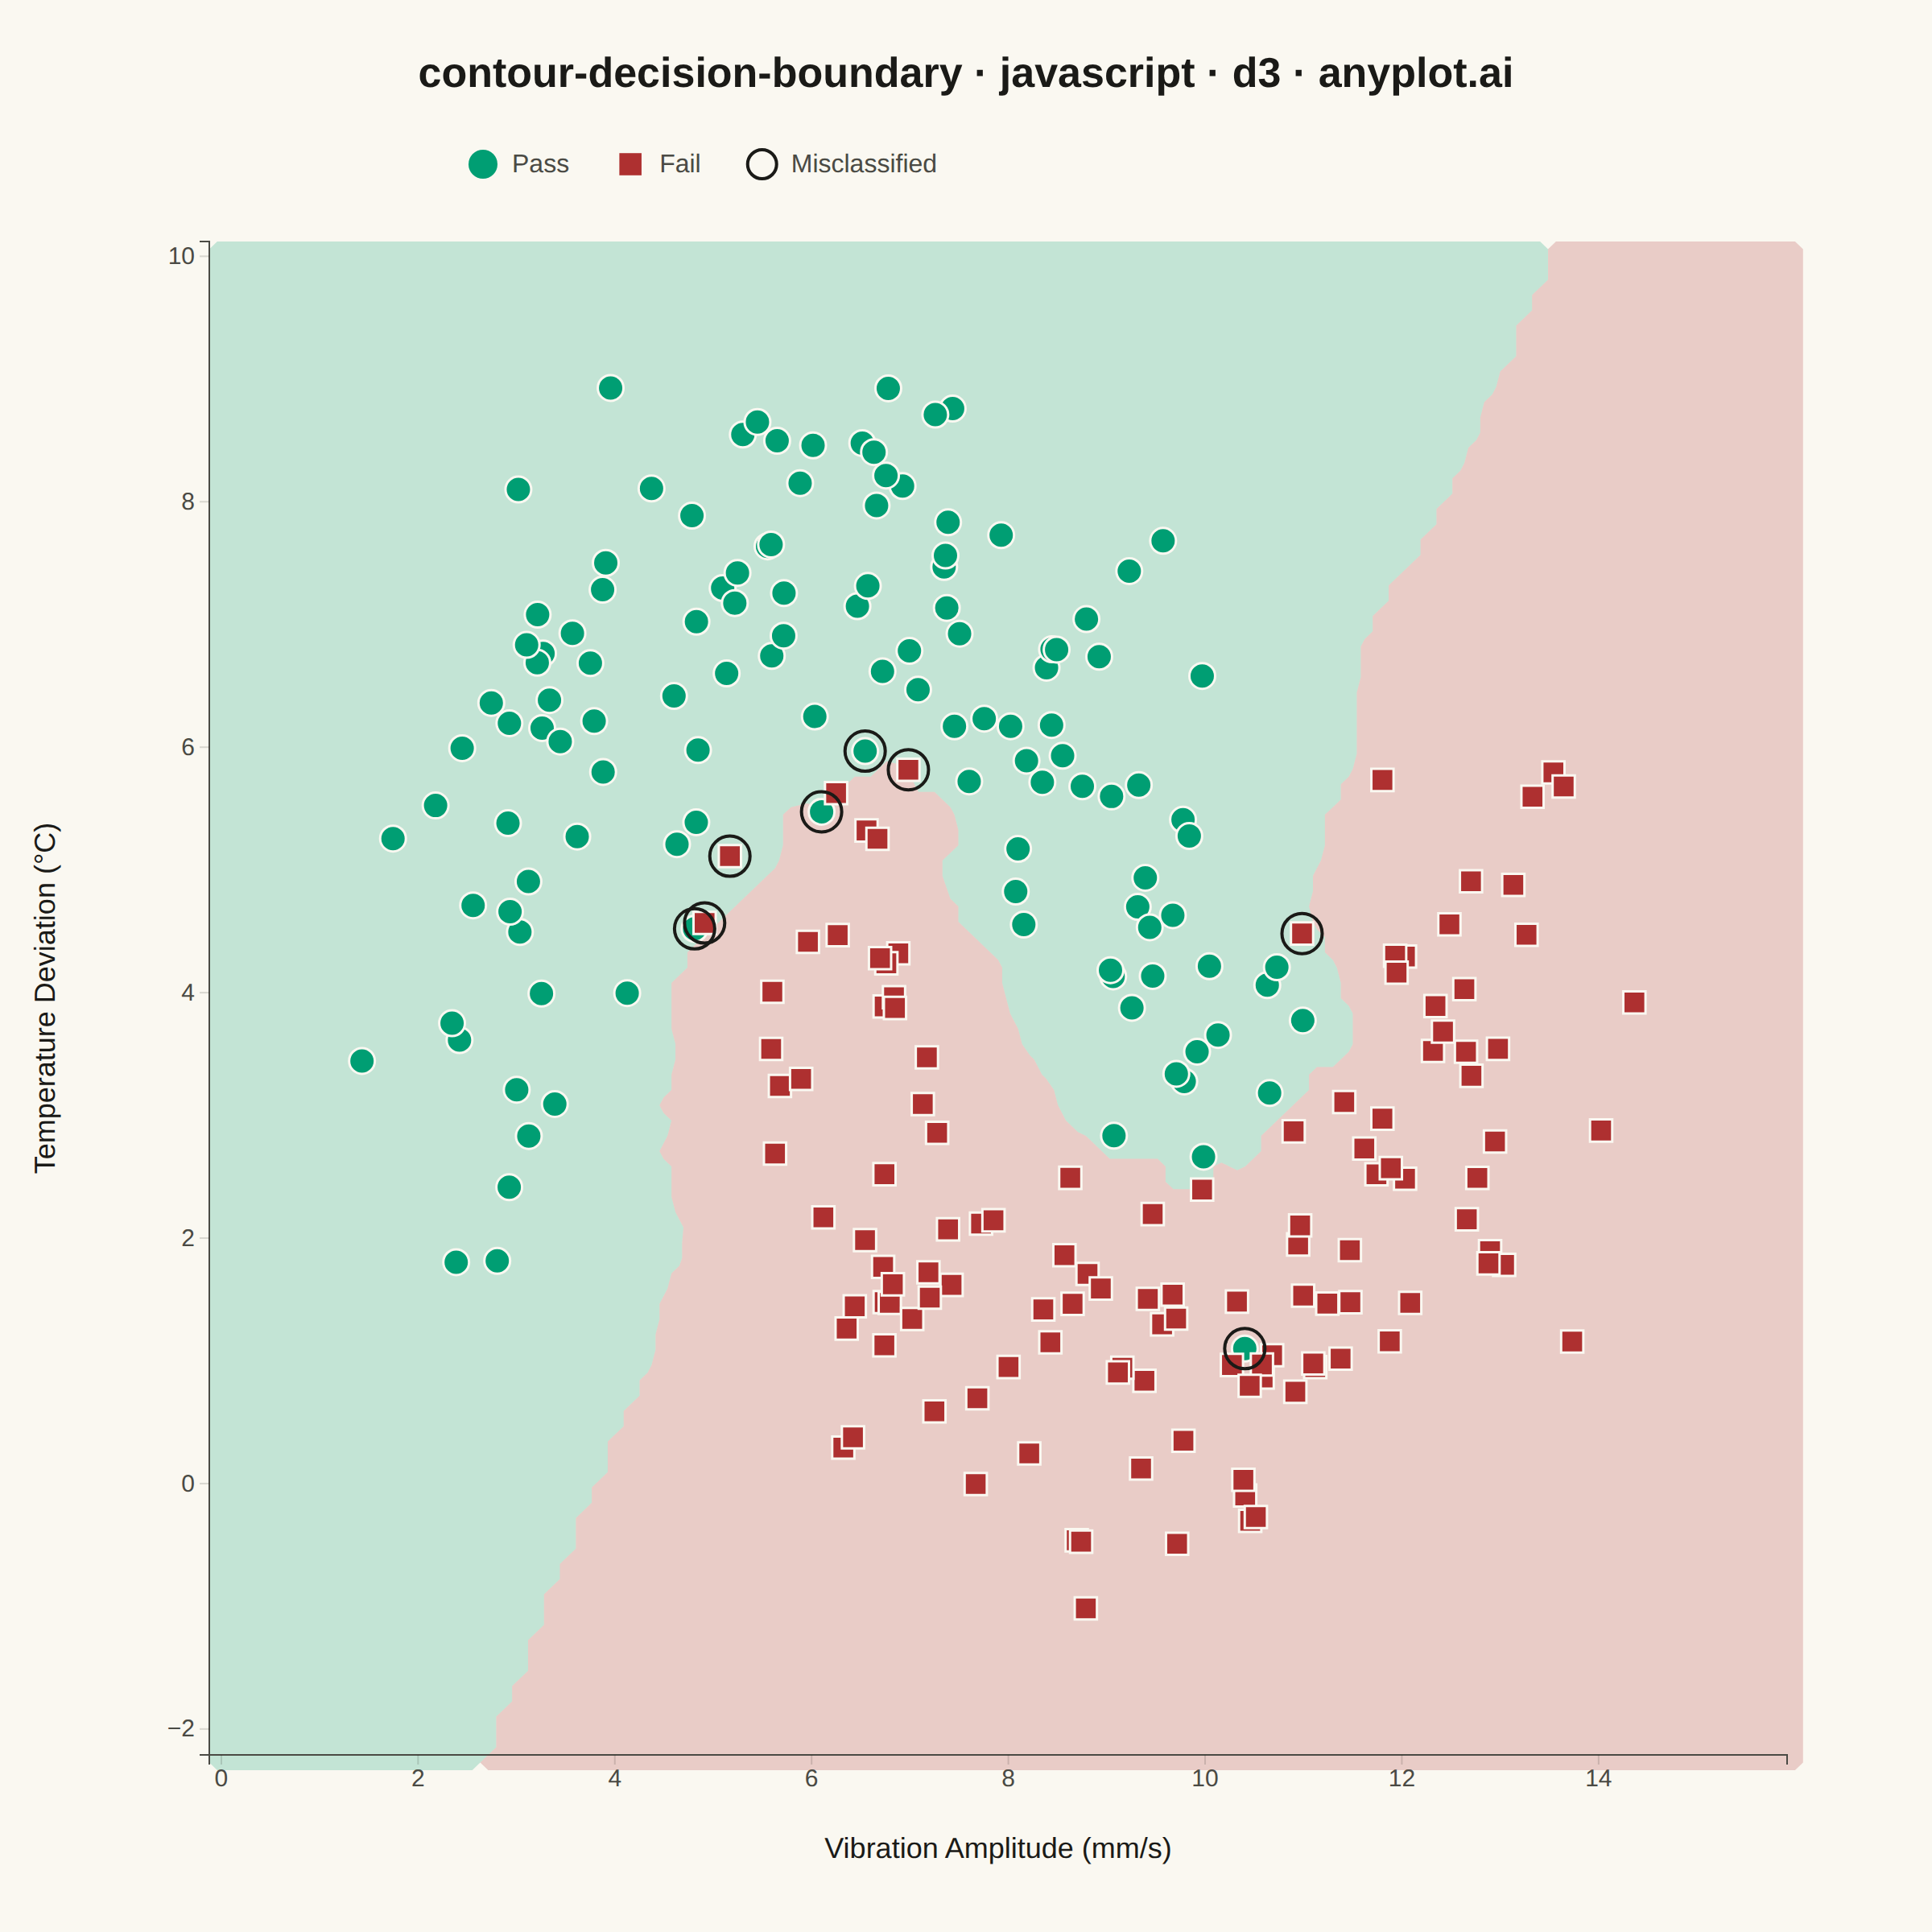
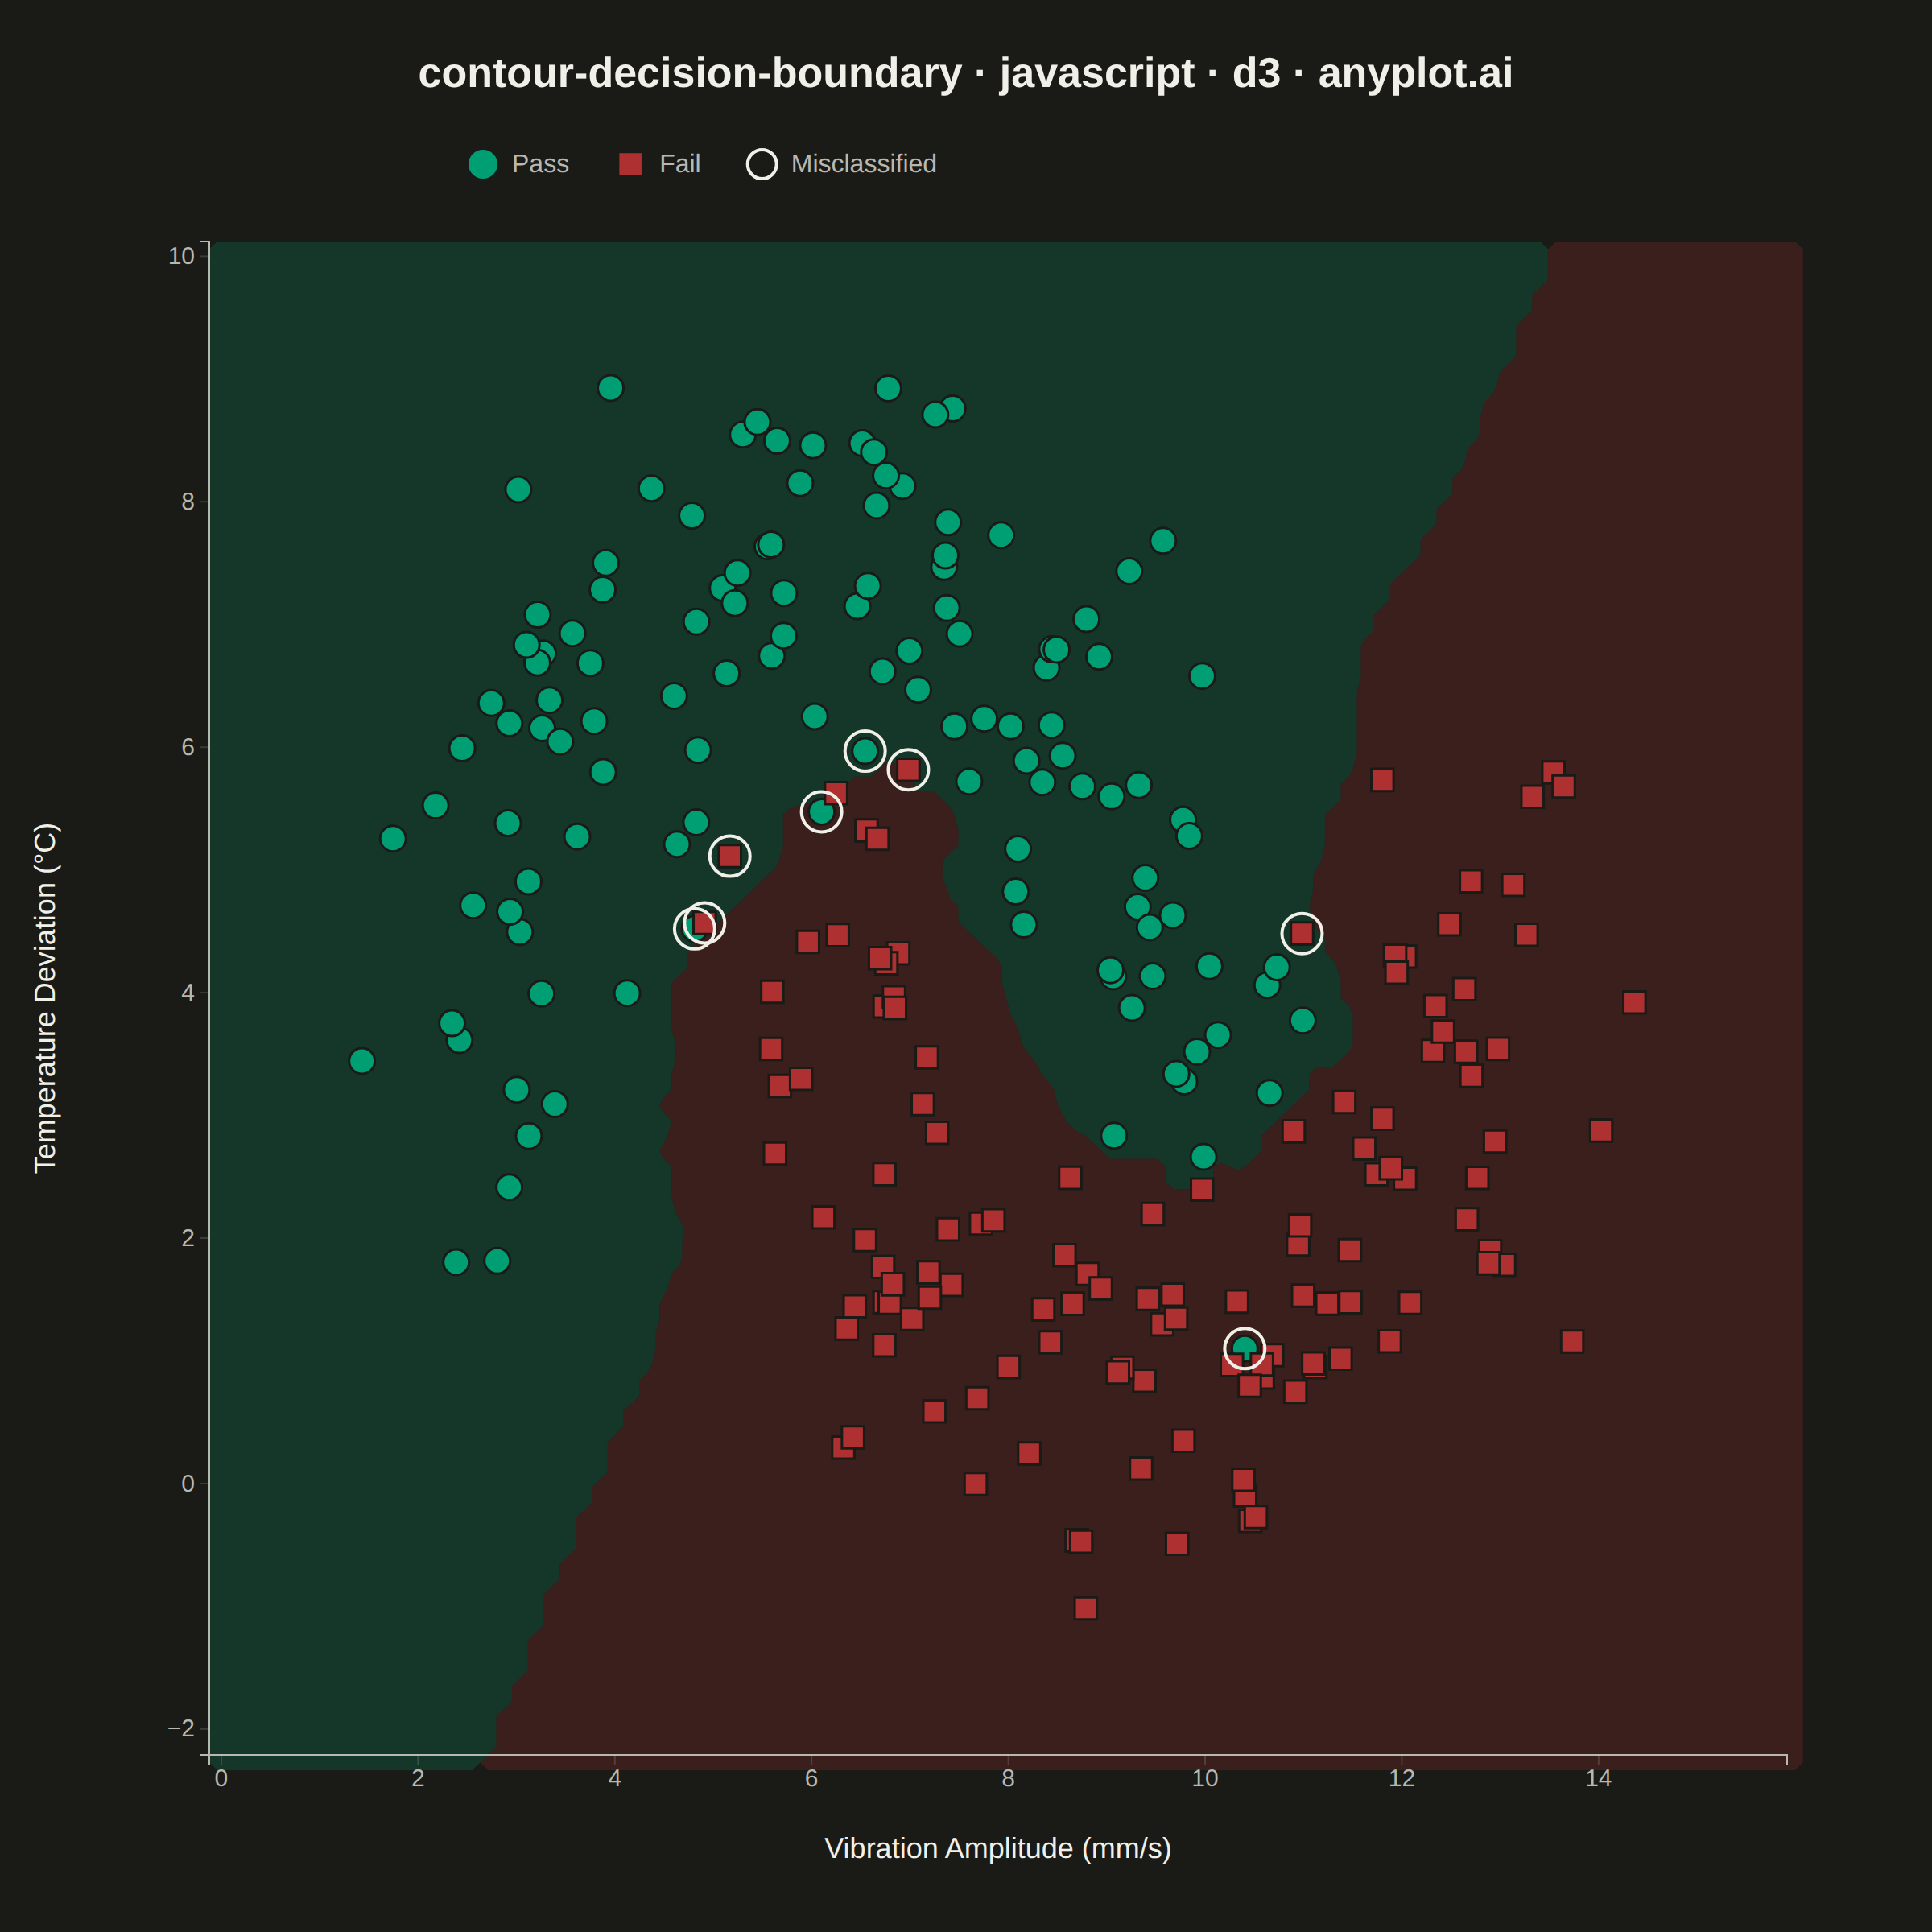
The same plot in 14 other libraries — JavaScript: Chart.js, Apache ECharts, Highcharts, MUI X Charts; Python: Altair, Bokeh, lets-plot, Matplotlib, Plotly, plotnine, Pygal, Seaborn; R: ggplot2; Julia: Makie.jl. Compare all 15 side by side: Decision Boundary Classifier Visualization in Python, R, Julia and JavaScript.
A decision boundary visualization showing how a classifier partitions 2D feature space into predicted class regions. Colored regions indicate the predicted class at each point in the feature space, with training data points overlaid to show how well the classifier separates different classes. This visualization is essential for understanding classifier behavior, identifying decision boundaries, and evaluating classification accuracy in machine learning.
// anyplot.ai
// contour-decision-boundary: Decision Boundary Classifier Visualization
// Library: d3 7.9.0 | JavaScript 22.23.2
// Quality: 91/100 | Created: 2026-09-04

//# anyplot-orientation: square

const t = window.ANYPLOT_TOKENS;
const { width, height } = window.ANYPLOT_SIZE;
const margin = { top: 150, right: 90, bottom: 110, left: 130 };
const iw = width - margin.left - margin.right;
const ih = height - margin.top - margin.bottom;

// --- Deterministic data: two interleaving quality-inspection clusters ------
// A tiny fixed-seed LCG stands in for a seeded RNG (the browser has none).
function makeLcg(seed) {
  let state = seed >>> 0;
  return () => {
    state = (state * 1664525 + 1013904223) >>> 0;
    return state / 4294967296;
  };
}
const rand = makeLcg(42);
function gaussian() {
  const u1 = Math.max(rand(), 1e-9);
  const u2 = rand();
  return Math.sqrt(-2 * Math.log(u1)) * Math.cos(2 * Math.PI * u2);
}

// Two crescent-shaped clusters (classic nonlinear separation) rescaled onto
// realistic inspection measurements: vibration amplitude vs. temperature
// deviation from two batches of manufactured parts (Pass / Fail).
const PER_CLASS = 125;
const NOISE = 0.22;
const X1_SCALE = 3.4;
const X1_OFFSET = 6.2;
const X2_SCALE = 4.6;
const X2_OFFSET = 3.0;

const points = [];
for (let i = 0; i < PER_CLASS; i++) {
  const angle = (Math.PI * i) / (PER_CLASS - 1);
  points.push({
    x1: (Math.cos(angle) + gaussian() * NOISE) * X1_SCALE + X1_OFFSET,
    x2: (Math.sin(angle) + gaussian() * NOISE) * X2_SCALE + X2_OFFSET,
    label: 0, // Pass
  });
}
for (let i = 0; i < PER_CLASS; i++) {
  const angle = (Math.PI * i) / (PER_CLASS - 1);
  points.push({
    x1: (1 - Math.cos(angle) + gaussian() * NOISE) * X1_SCALE + X1_OFFSET,
    x2: (1 - Math.sin(angle) - 0.5 + gaussian() * NOISE) * X2_SCALE + X2_OFFSET,
    label: 1, // Fail
  });
}

// --- k-NN classifier (standardized feature space, k=5) ----------------------
const K = 5;
const mean1 = d3.mean(points, (d) => d.x1);
const mean2 = d3.mean(points, (d) => d.x2);
const std1 = d3.deviation(points, (d) => d.x1);
const std2 = d3.deviation(points, (d) => d.x2);
const trainZ = points.map((d) => ({
  zx: (d.x1 - mean1) / std1,
  zy: (d.x2 - mean2) / std2,
  label: d.label,
}));

// Fraction of the k nearest neighbors labeled Fail — a continuous field
// suitable for marching-squares contouring (0 = unanimous Pass, 1 = unanimous Fail).
function knnFailFraction(zx, zy, excludeIdx) {
  const dists = [];
  for (let i = 0; i < trainZ.length; i++) {
    if (i === excludeIdx) continue;
    const dx = zx - trainZ[i].zx;
    const dy = zy - trainZ[i].zy;
    dists.push([dx * dx + dy * dy, trainZ[i].label]);
  }
  dists.sort((a, b) => a[0] - b[0]);
  let fail = 0;
  for (let i = 0; i < K; i++) {
    if (dists[i][1] === 1) fail++;
  }
  return fail / K;
}

function classify(zx, zy, excludeIdx) {
  return knnFailFraction(zx, zy, excludeIdx) > 0.5 ? 1 : 0;
}

// Leave-one-out prediction flags which training points the classifier misses.
const trainWithPred = points.map((d, i) => {
  const zx = (d.x1 - mean1) / std1;
  const zy = (d.x2 - mean2) / std2;
  return { ...d, correct: classify(zx, zy, i) === d.label };
});

// --- Scales -------------------------------------------------------------
const x1Pad = (d3.max(points, (d) => d.x1) - d3.min(points, (d) => d.x1)) * 0.12;
const x2Pad = (d3.max(points, (d) => d.x2) - d3.min(points, (d) => d.x2)) * 0.12;
const x = d3
  .scaleLinear()
  .domain([d3.min(points, (d) => d.x1) - x1Pad, d3.max(points, (d) => d.x1) + x1Pad])
  .range([0, iw]);
const y = d3
  .scaleLinear()
  .domain([d3.min(points, (d) => d.x2) - x2Pad, d3.max(points, (d) => d.x2) + x2Pad])
  .range([ih, 0]);

// --- Decision regions: marching-squares contour of the classifier field ----
// Sample a dense grid (edge-to-edge, so the contoured fill reaches the plot
// borders) of the continuous Fail-fraction field, then let d3.contours()
// trace a single smooth boundary per class instead of a raster mesh of rects.
const GRID = 100;
const cellW = iw / (GRID - 1);
const cellH = ih / (GRID - 1);
const classColors = [t.palette[0], t.palette[4]]; // Pass -> brand green, Fail -> semantic red

const failField = new Float64Array(GRID * GRID);
for (let row = 0; row < GRID; row++) {
  const dataX2 = y.invert(row * cellH);
  const zy = (dataX2 - mean2) / std2;
  for (let col = 0; col < GRID; col++) {
    const dataX1 = x.invert(col * cellW);
    const zx = (dataX1 - mean1) / std1;
    failField[row * GRID + col] = knnFailFraction(zx, zy, -1);
  }
}
const passField = failField.map((v) => 1 - v);

const contourGen = d3.contours().size([GRID, GRID]);
const failGeo = contourGen.contour(failField, 0.5);
const passGeo = contourGen.contour(passField, 0.5);

// Grid-index space -> plot-pixel space (grid samples are cellW/cellH apart).
const gridToPixel = d3.geoTransform({
  point(gx, gy) {
    this.stream.point(gx * cellW, gy * cellH);
  },
});
const contourPath = d3.geoPath(gridToPixel);

// A distinct marker shape for Fail (in addition to color) so class is never
// signaled by color alone.
const failSymbol = d3.symbol().type(d3.symbolSquare).size(190);

// --- SVG mount ----------------------------------------------------------
const svg = d3.select("#container").append("svg").attr("width", width).attr("height", height);
const g = svg.append("g").attr("transform", `translate(${margin.left},${margin.top})`);

// Decision regions (drawn first, everything else layers on top)
const regionsG = g.append("g");
regionsG
  .append("path")
  .datum(passGeo)
  .attr("d", contourPath)
  .attr("fill", classColors[0])
  .attr("stroke", "none")
  .attr("opacity", 0.22);
regionsG
  .append("path")
  .datum(failGeo)
  .attr("d", contourPath)
  .attr("fill", classColors[1])
  .attr("stroke", "none")
  .attr("opacity", 0.22);

// --- Axes -----------------------------------------------------------------
const xAxis = g
  .append("g")
  .attr("transform", `translate(0,${ih})`)
  .call(d3.axisBottom(x).ticks(8));
const yAxis = g.append("g").call(d3.axisLeft(y).ticks(8));
for (const ax of [xAxis, yAxis]) {
  ax.selectAll("text").attr("fill", t.inkSoft).style("font-size", "15px");
  ax.selectAll("line").attr("stroke", t.grid);
  ax.select(".domain").attr("stroke", t.inkSoft);
}

g.append("text")
  .attr("x", iw / 2)
  .attr("y", ih + 64)
  .attr("text-anchor", "middle")
  .attr("fill", t.ink)
  .style("font-size", "18px")
  .text("Vibration Amplitude (mm/s)");

g.append("text")
  .attr("transform", "rotate(-90)")
  .attr("x", -ih / 2)
  .attr("y", -96)
  .attr("text-anchor", "middle")
  .attr("fill", t.ink)
  .style("font-size", "18px")
  .text("Temperature Deviation (°C)");

// --- Training points: Pass = filled circle, Fail = filled square (shape
// carries the class distinction alongside color); misclassified points also
// get an ink ring -------------------------------------------------------
const pointsG = g.append("g");
pointsG
  .selectAll("circle.sample")
  .data(trainWithPred.filter((d) => d.label === 0))
  .join("circle")
  .attr("class", "sample")
  .attr("cx", (d) => x(d.x1))
  .attr("cy", (d) => y(d.x2))
  .attr("r", 8)
  .attr("fill", classColors[0])
  .attr("stroke", t.pageBg)
  .attr("stroke-width", 1.5);

pointsG
  .selectAll("path.sample")
  .data(trainWithPred.filter((d) => d.label === 1))
  .join("path")
  .attr("class", "sample")
  .attr("d", failSymbol())
  .attr("transform", (d) => `translate(${x(d.x1)},${y(d.x2)})`)
  .attr("fill", classColors[1])
  .attr("stroke", t.pageBg)
  .attr("stroke-width", 1.5);

pointsG
  .selectAll("circle.flag")
  .data(trainWithPred.filter((d) => !d.correct))
  .join("circle")
  .attr("class", "flag")
  .attr("cx", (d) => x(d.x1))
  .attr("cy", (d) => y(d.x2))
  .attr("r", 12.5)
  .attr("fill", "none")
  .attr("stroke", t.ink)
  .attr("stroke-width", 2);

// --- Legend ---------------------------------------------------------------
const legend = svg.append("g").attr("transform", `translate(${width / 2 - 300},${102})`);
const legendItems = [
  { label: "Pass", color: classColors[0], shape: "dot" },
  { label: "Fail", color: classColors[1], shape: "square" },
  { label: "Misclassified", color: t.ink, shape: "ring" },
];
let lx = 0;
for (const item of legendItems) {
  const entry = legend.append("g").attr("transform", `translate(${lx},0)`);
  if (item.shape === "dot") {
    entry.append("circle").attr("r", 9).attr("fill", item.color);
  } else if (item.shape === "square") {
    entry.append("path").attr("d", failSymbol()).attr("fill", item.color);
  } else {
    entry.append("circle").attr("r", 9).attr("fill", "none").attr("stroke", item.color).attr("stroke-width", 2);
  }
  const label = entry
    .append("text")
    .attr("x", 18)
    .attr("y", 5)
    .attr("fill", t.inkSoft)
    .style("font-size", "16px")
    .text(item.label);
  lx += 18 + label.node().getComputedTextLength() + 38;
}

// --- Title ------------------------------------------------------------------
svg
  .append("text")
  .attr("x", width / 2)
  .attr("y", 54)
  .attr("text-anchor", "middle")
  .attr("fill", t.ink)
  .style("font-size", "26px")
  .style("font-weight", "600")
  .text("contour-decision-boundary · javascript · d3 · anyplot.ai");
Runnable source as JSON, for any HTTP client: https://api.anyplot.ai/specs/contour-decision-boundary/d3/code. Any spec id and library id listed in llms-full.txt fit the same URL shape; every URL below is complete and callable.
{
  "spec_id": "contour-decision-boundary",
  "language": "javascript",
  "library": "d3",
  "page": "https://anyplot.ai/contour-decision-boundary/javascript/d3",
  "hub": "https://anyplot.ai/contour-decision-boundary",
  "code_json": "https://api.anyplot.ai/specs/contour-decision-boundary/d3/code",
  "spec_json": "https://api.anyplot.ai/specs/contour-decision-boundary",
  "render_light_png": "https://storage.googleapis.com/anyplot-images/plots/contour-decision-boundary/javascript/d3/plot-light.png",
  "render_dark_png": "https://storage.googleapis.com/anyplot-images/plots/contour-decision-boundary/javascript/d3/plot-dark.png",
  "interactive_light_html": "https://storage.googleapis.com/anyplot-images/plots/contour-decision-boundary/javascript/d3/plot-light.html",
  "interactive_dark_html": "https://storage.googleapis.com/anyplot-images/plots/contour-decision-boundary/javascript/d3/plot-dark.html",
  "quality_score": 91.0,
  "license": "MIT",
  "guide": "https://anyplot.ai/llms.txt"
}
Part of Decision Boundary Classifier Visualization on anyplot.ai.