The same plot in 14 other libraries — JavaScript: Chart.js, D3.js, Highcharts, MUI X Charts; Python: Altair, Bokeh, lets-plot, Matplotlib, Plotly, plotnine, Pygal, Seaborn; R: ggplot2; Julia: Makie.jl. Compare all 15 side by side: Decision Boundary Classifier Visualization in Python, R, Julia and JavaScript.
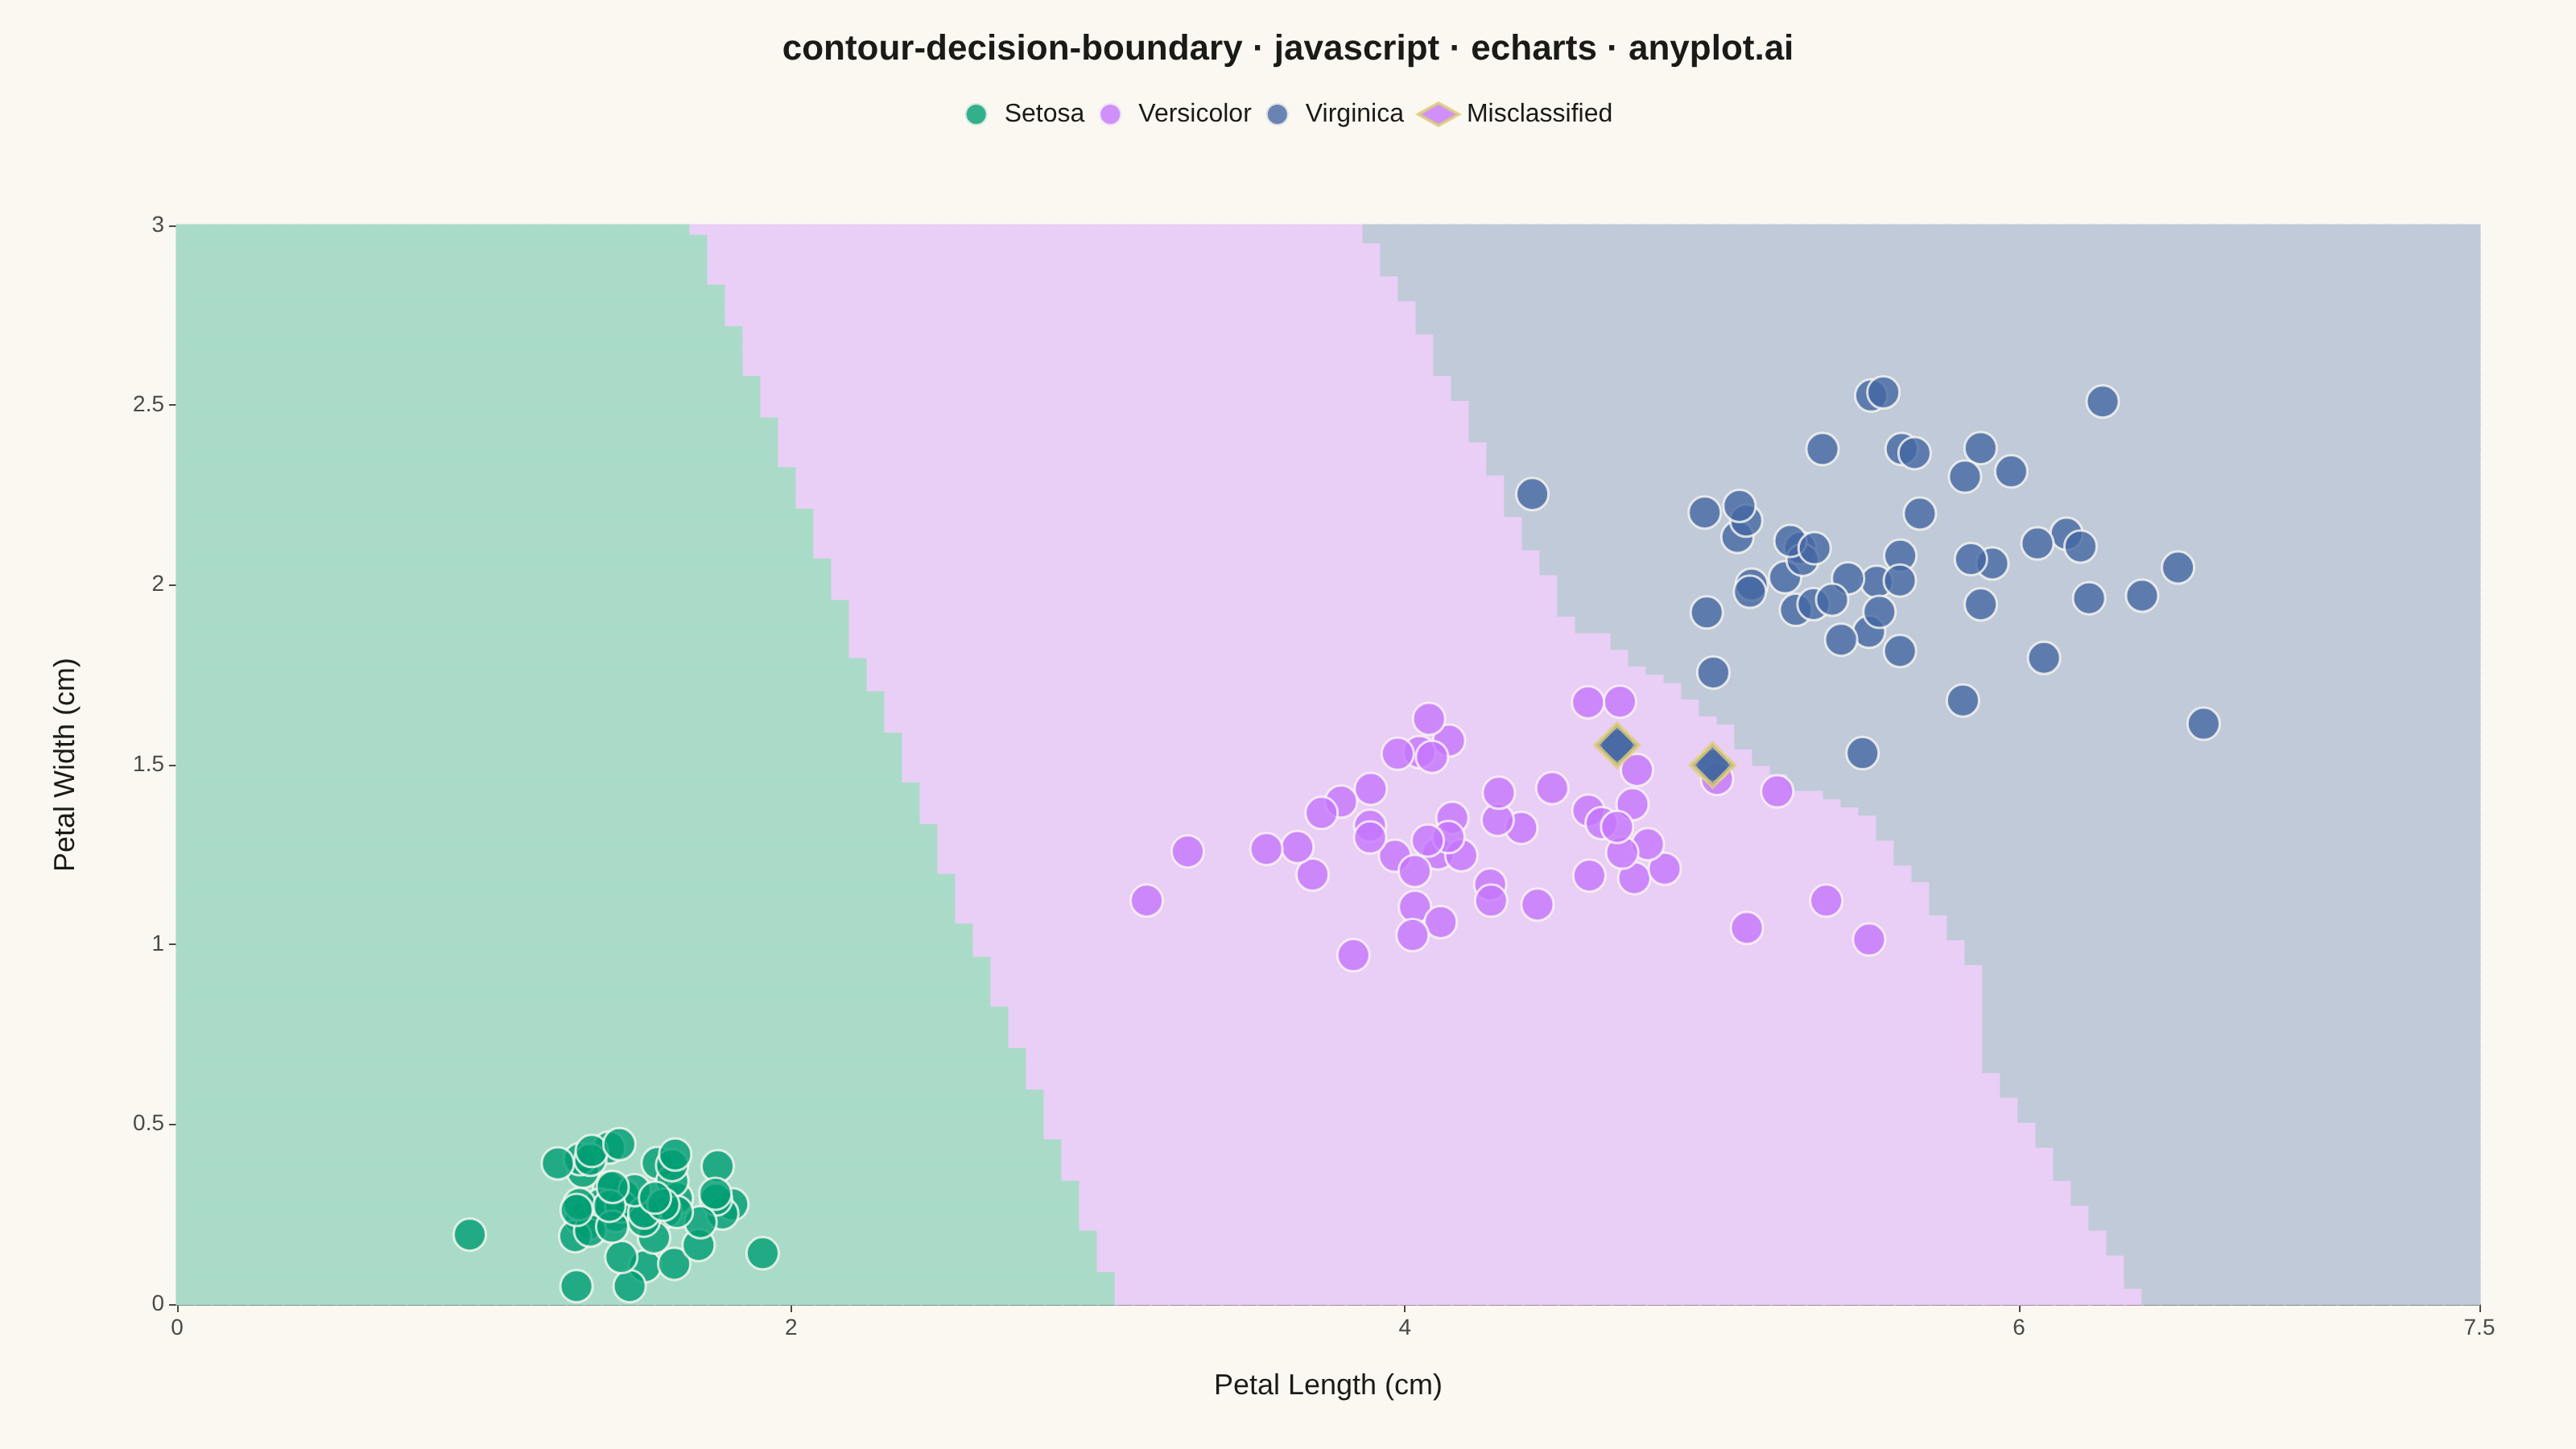
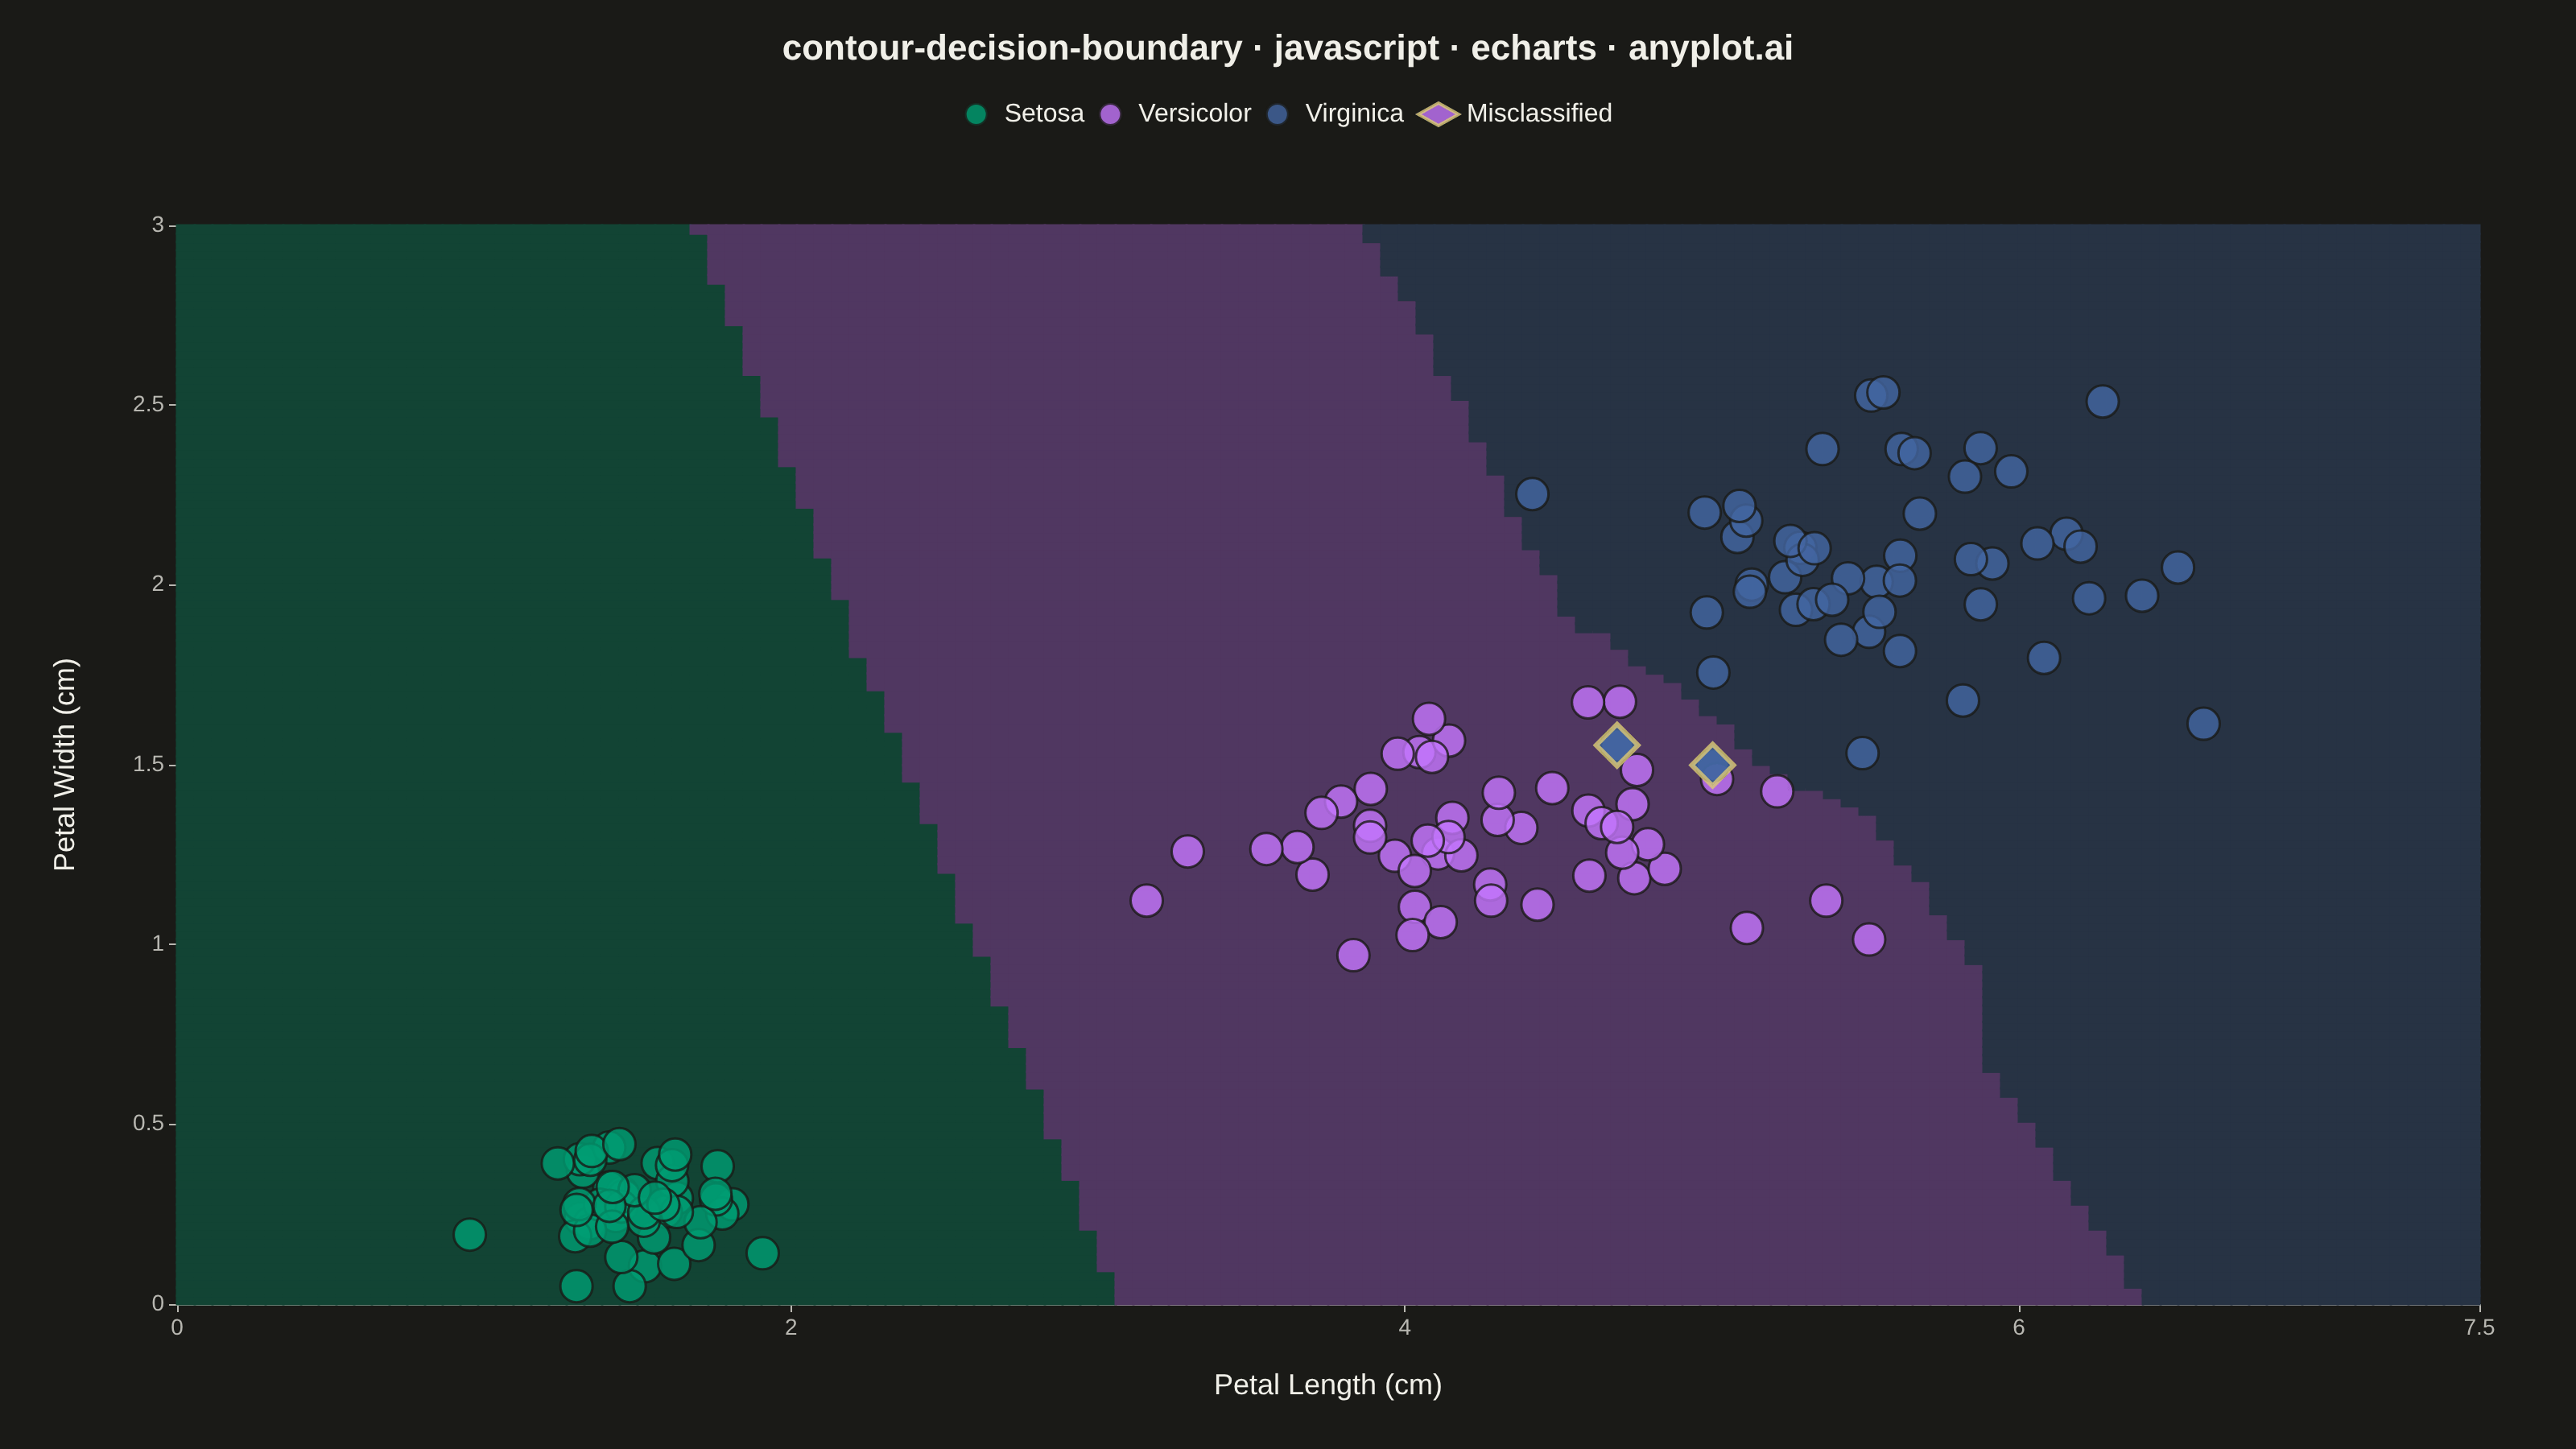
A decision boundary visualization showing how a classifier partitions 2D feature space into predicted class regions. Colored regions indicate the predicted class at each point in the feature space, with training data points overlaid to show how well the classifier separates different classes. This visualization is essential for understanding classifier behavior, identifying decision boundaries, and evaluating classification accuracy in machine learning.
// anyplot.ai
// contour-decision-boundary: Decision Boundary Classifier Visualization
// Library: echarts 6.1.0 | JavaScript 22.23.2
// Quality: 91/100 | Created: 2026-09-04
//# anyplot-orientation: landscape

const t = window.ANYPLOT_TOKENS;

// --- Deterministic PRNG (LCG + Box-Muller) ----------------------------------
let seed = 42;
function rand() {
  seed = (seed * 1103515245 + 12345) & 0x7fffffff;
  return seed / 0x7fffffff;
}
function gaussian(mean, std) {
  const u1 = Math.max(rand(), 1e-9);
  const u2 = rand();
  return mean + std * Math.sqrt(-2 * Math.log(u1)) * Math.cos(2 * Math.PI * u2);
}
function blend(hex, bgHex, weight) {
  const c1 = [1, 3, 5].map((i) => parseInt(hex.slice(i, i + 2), 16));
  const c2 = [1, 3, 5].map((i) => parseInt(bgHex.slice(i, i + 2), 16));
  const [r, g, b] = c1.map((v, i) => Math.round(v * weight + c2[i] * (1 - weight)));
  return `rgb(${r}, ${g}, ${b})`;
}

// --- Training data: synthetic petal measurements, 3 overlapping species -----
const classColors = [t.palette[0], t.palette[1], t.palette[2]];
const classSpecs = [
  { name: "Setosa", n: 50, lengthMean: 1.5, lengthStd: 0.18, widthMean: 0.25, widthStd: 0.09 },
  { name: "Versicolor", n: 50, lengthMean: 4.3, lengthStd: 0.5, widthMean: 1.3, widthStd: 0.2 },
  { name: "Virginica", n: 50, lengthMean: 5.6, lengthStd: 0.55, widthMean: 2.0, widthStd: 0.27 },
];

const trainingPoints = []; // [length, width, classIdx]
classSpecs.forEach((spec, classIdx) => {
  for (let i = 0; i < spec.n; i++) {
    const length = Math.max(0.1, gaussian(spec.lengthMean, spec.lengthStd));
    const width = Math.max(0.05, gaussian(spec.widthMean, spec.widthStd));
    trainingPoints.push([length, width, classIdx]);
  }
});

// --- k-nearest-neighbors classifier ------------------------------------------
// Trained on `trainingPoints`; `excludeIdx` supports leave-one-out evaluation
// so a training point never votes for itself.
const K = 9;
function knnPredict(px, py, excludeIdx) {
  const neighbors = [];
  for (let i = 0; i < trainingPoints.length; i++) {
    if (i === excludeIdx) continue;
    const [x, y, label] = trainingPoints[i];
    const dx = x - px;
    const dy = y - py;
    neighbors.push({ d: dx * dx + dy * dy, label });
  }
  neighbors.sort((a, b) => a.d - b.d);
  const votes = new Map();
  let bestLabel = neighbors[0].label;
  let bestVotes = -1;
  for (let i = 0; i < K; i++) {
    const label = neighbors[i].label;
    const count = (votes.get(label) || 0) + 1;
    votes.set(label, count);
    if (count > bestVotes) {
      bestVotes = count;
      bestLabel = label;
    }
  }
  return bestLabel;
}

// --- Decision surface: dense mesh classified by the trained model -----------
const lengths = trainingPoints.map((p) => p[0]);
const widths = trainingPoints.map((p) => p[1]);
const xMin = Math.floor((Math.min(...lengths) - 0.6) * 2) / 2;
const xMax = Math.ceil((Math.max(...lengths) + 0.6) * 2) / 2;
const yMin = Math.max(0, Math.floor((Math.min(...widths) - 0.35) * 2) / 2);
const yMax = Math.ceil((Math.max(...widths) + 0.35) * 2) / 2;

const MESH_NX = 130;
const MESH_NY = 130;
const cellW = (xMax - xMin) / MESH_NX;
const cellH = (yMax - yMin) / MESH_NY;

const meshData = [];
for (let ix = 0; ix < MESH_NX; ix++) {
  const mx = xMin + (ix + 0.5) * cellW;
  for (let iy = 0; iy < MESH_NY; iy++) {
    const my = yMin + (iy + 0.5) * cellH;
    meshData.push([mx, my, knnPredict(mx, my, -1)]);
  }
}
// Pre-blended flat colors (not canvas alpha) so overlapping mesh cells never
// stack opacity into a visible seam grid.
const regionColors = classColors.map((c) => blend(c, t.pageBg, 0.32));

// --- Training points split into per-class series + leave-one-out errors -----
const pointsByClass = [[], [], []];
const misclassified = [];
trainingPoints.forEach((p, idx) => {
  const [x, y, trueLabel] = p;
  pointsByClass[trueLabel].push([x, y]);
  if (knnPredict(x, y, idx) !== trueLabel) {
    misclassified.push({ value: [x, y], itemStyle: { color: classColors[trueLabel] } });
  }
});

// --- Init ---------------------------------------------------------------
const chart = echarts.init(document.getElementById("container"));

// --- Option ---------------------------------------------------------------
chart.setOption({
  animation: false,
  backgroundColor: "transparent",
  color: [...classColors, t.amber],
  title: {
    text: "contour-decision-boundary · javascript · echarts · anyplot.ai",
    left: "center",
    textStyle: { color: t.ink, fontSize: 22 },
  },
  legend: {
    data: [...classSpecs.map((s) => s.name), "Misclassified"],
    top: 58,
    textStyle: { color: t.ink, fontSize: 16 },
  },
  grid: { left: 110, right: 60, top: 140, bottom: 90 },
  xAxis: {
    type: "value",
    name: "Petal Length (cm)",
    nameLocation: "middle",
    nameGap: 42,
    nameTextStyle: { color: t.ink, fontSize: 18 },
    min: xMin,
    max: xMax,
    axisLabel: { color: t.inkSoft, fontSize: 14 },
    axisLine: { lineStyle: { color: t.inkSoft } },
    splitLine: { show: false },
  },
  yAxis: {
    type: "value",
    name: "Petal Width (cm)",
    nameLocation: "middle",
    nameGap: 60,
    nameTextStyle: { color: t.ink, fontSize: 18 },
    min: yMin,
    max: yMax,
    axisLabel: { color: t.inkSoft, fontSize: 14 },
    axisLine: { lineStyle: { color: t.inkSoft } },
    splitLine: { show: false },
  },
  series: [
    {
      type: "custom",
      coordinateSystem: "cartesian2d",
      encode: { x: 0, y: 1 },
      silent: true,
      z: 1,
      tooltip: { show: false },
      renderItem: (params, api) => {
        const point = api.coord([api.value(0), api.value(1)]);
        const size = api.size([cellW, cellH]);
        return {
          type: "rect",
          shape: {
            x: point[0] - size[0] / 2 - 0.75,
            y: point[1] - size[1] / 2 - 0.75,
            width: size[0] + 1.5,
            height: size[1] + 1.5,
          },
          style: { fill: regionColors[api.value(2)] },
        };
      },
      data: meshData,
    },
    ...classSpecs.map((spec, classIdx) => ({
      name: spec.name,
      type: "scatter",
      z: 3,
      symbol: "circle",
      symbolSize: 20,
      itemStyle: { color: classColors[classIdx], borderColor: t.pageBg, borderWidth: 1.5 },
      data: pointsByClass[classIdx],
    })),
    {
      name: "Misclassified",
      type: "scatter",
      z: 4,
      symbol: "diamond",
      symbolSize: 26,
      itemStyle: { borderColor: t.amber, borderWidth: 3 },
      data: misclassified,
    },
  ],
});
Runnable source as JSON, for any HTTP client: https://api.anyplot.ai/specs/contour-decision-boundary/echarts/code. Any spec id and library id listed in llms-full.txt fit the same URL shape; every URL below is complete and callable.
{
  "spec_id": "contour-decision-boundary",
  "language": "javascript",
  "library": "echarts",
  "page": "https://anyplot.ai/contour-decision-boundary/javascript/echarts",
  "hub": "https://anyplot.ai/contour-decision-boundary",
  "code_json": "https://api.anyplot.ai/specs/contour-decision-boundary/echarts/code",
  "spec_json": "https://api.anyplot.ai/specs/contour-decision-boundary",
  "render_light_png": "https://storage.googleapis.com/anyplot-images/plots/contour-decision-boundary/javascript/echarts/plot-light.png",
  "render_dark_png": "https://storage.googleapis.com/anyplot-images/plots/contour-decision-boundary/javascript/echarts/plot-dark.png",
  "interactive_light_html": "https://storage.googleapis.com/anyplot-images/plots/contour-decision-boundary/javascript/echarts/plot-light.html",
  "interactive_dark_html": "https://storage.googleapis.com/anyplot-images/plots/contour-decision-boundary/javascript/echarts/plot-dark.html",
  "quality_score": 91.0,
  "license": "MIT",
  "guide": "https://anyplot.ai/llms.txt"
}
Part of Decision Boundary Classifier Visualization on anyplot.ai.