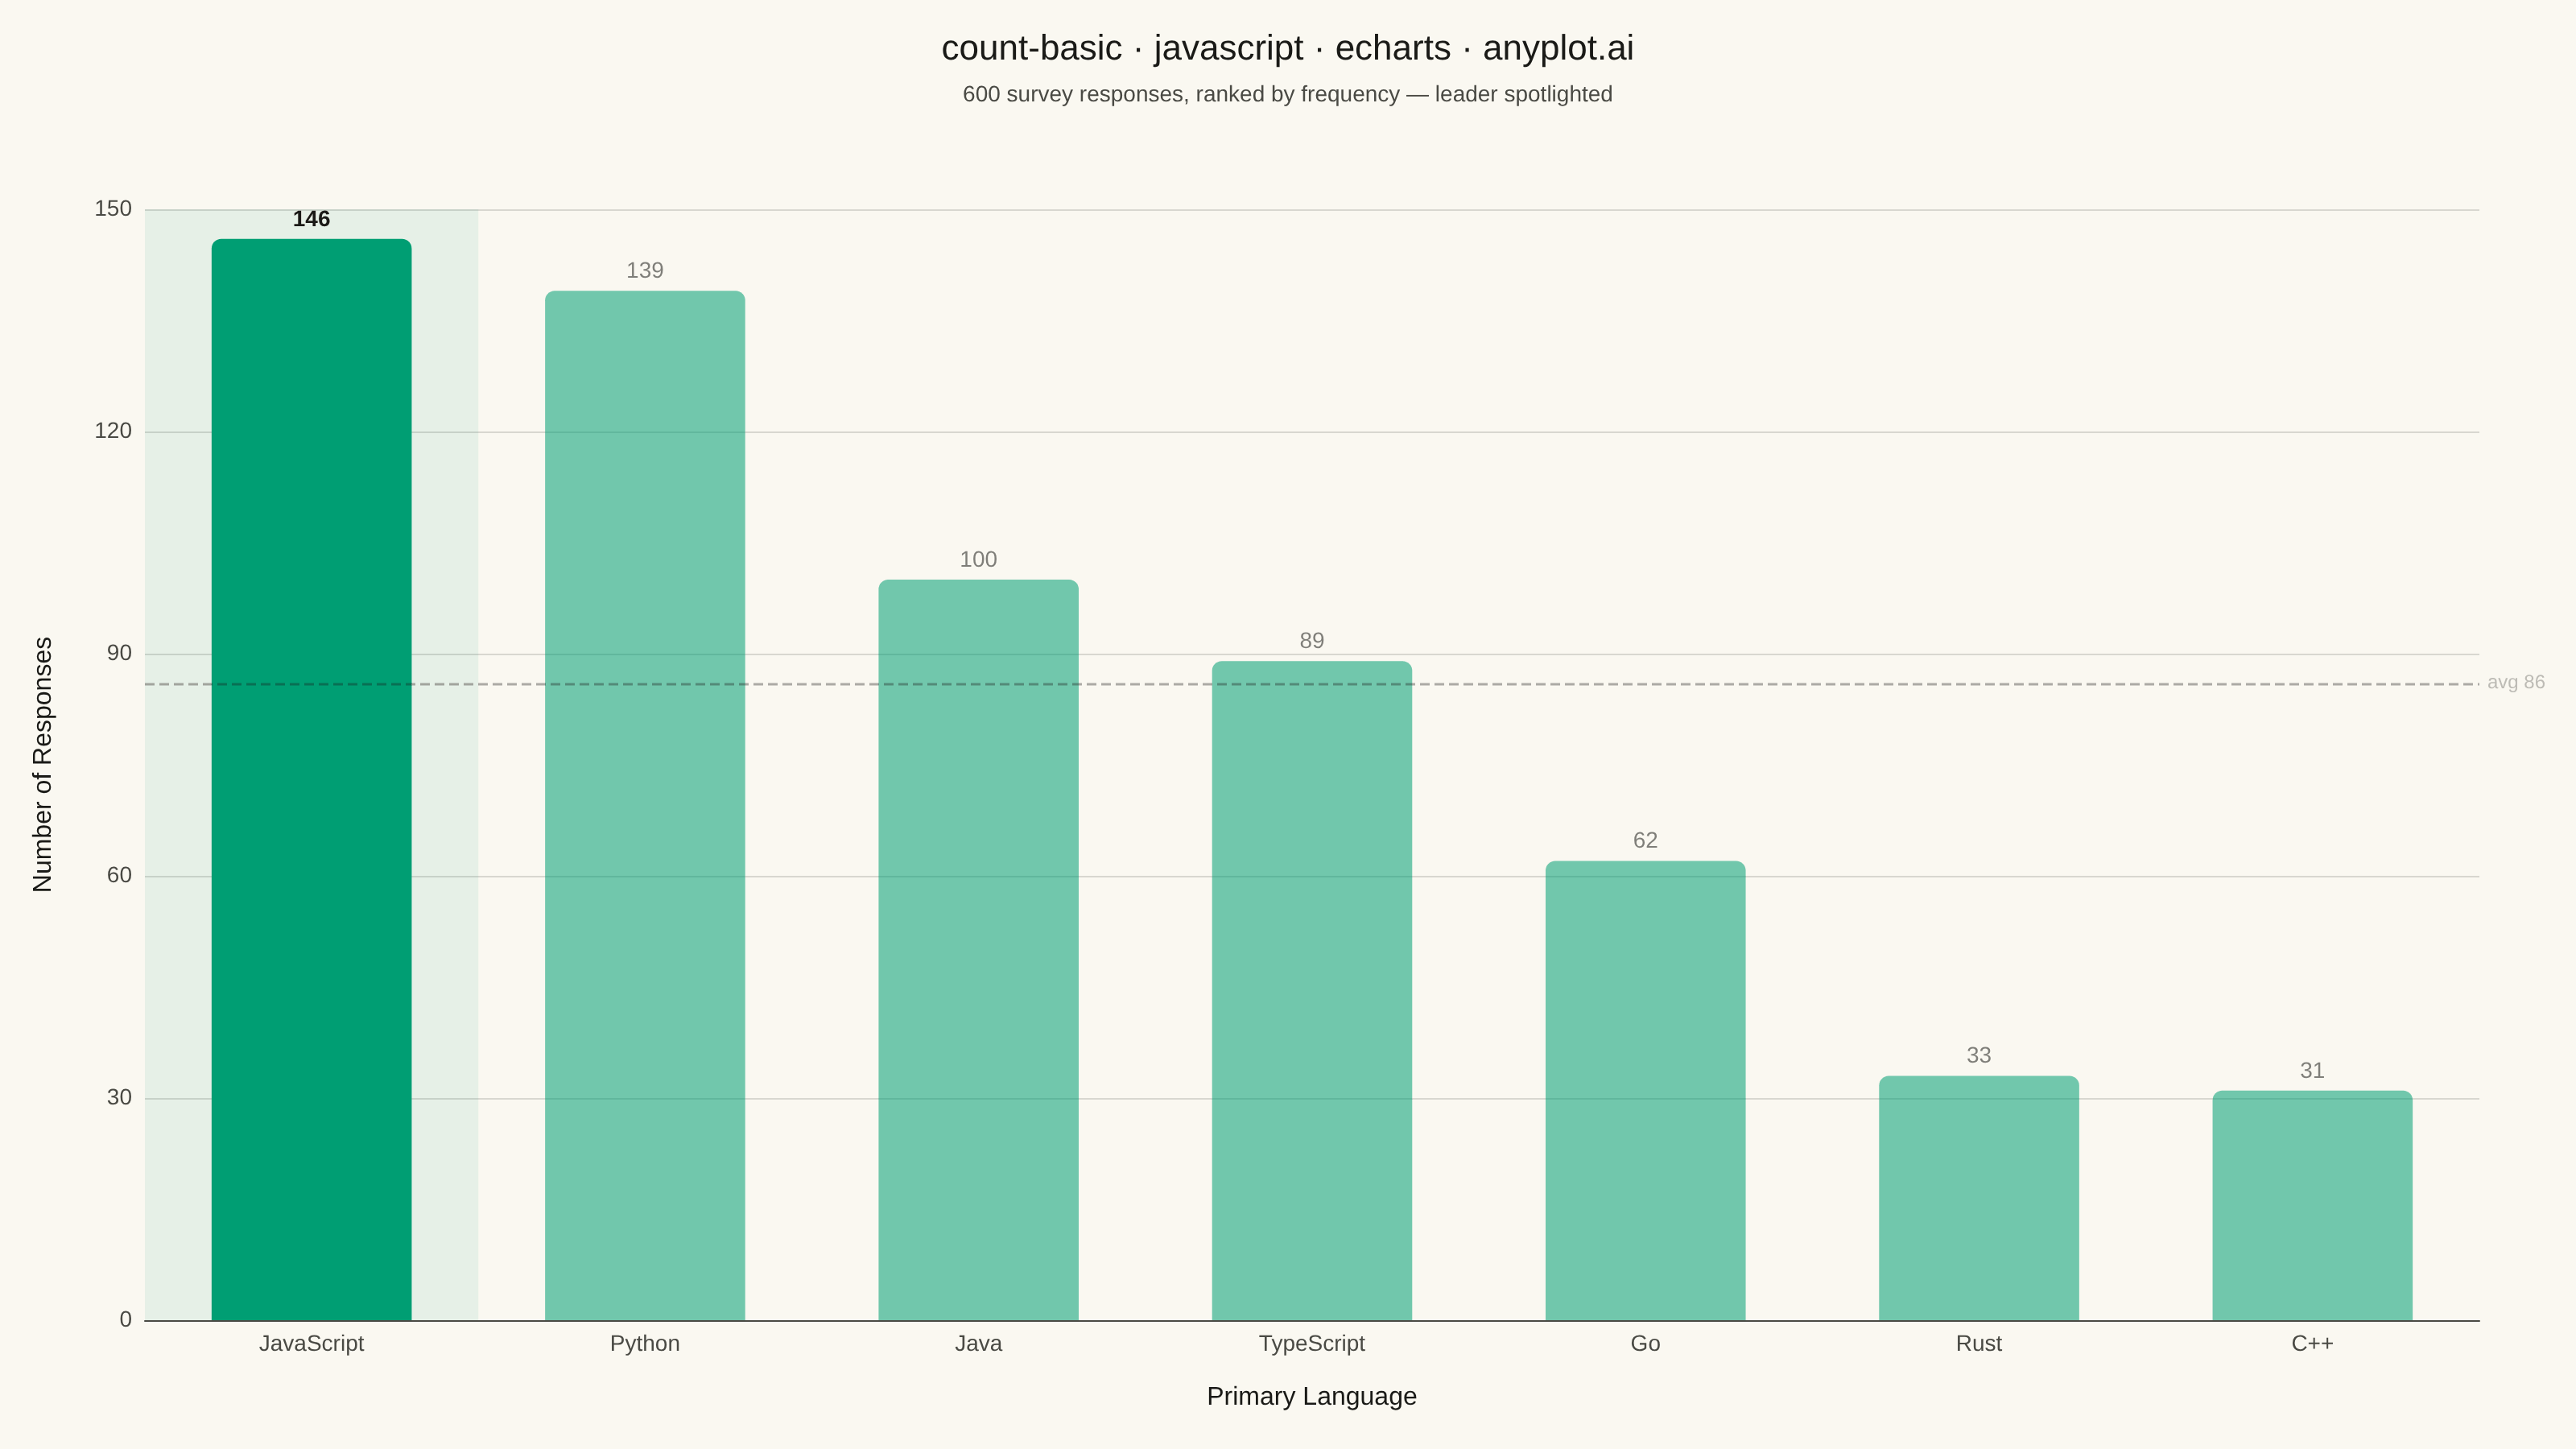
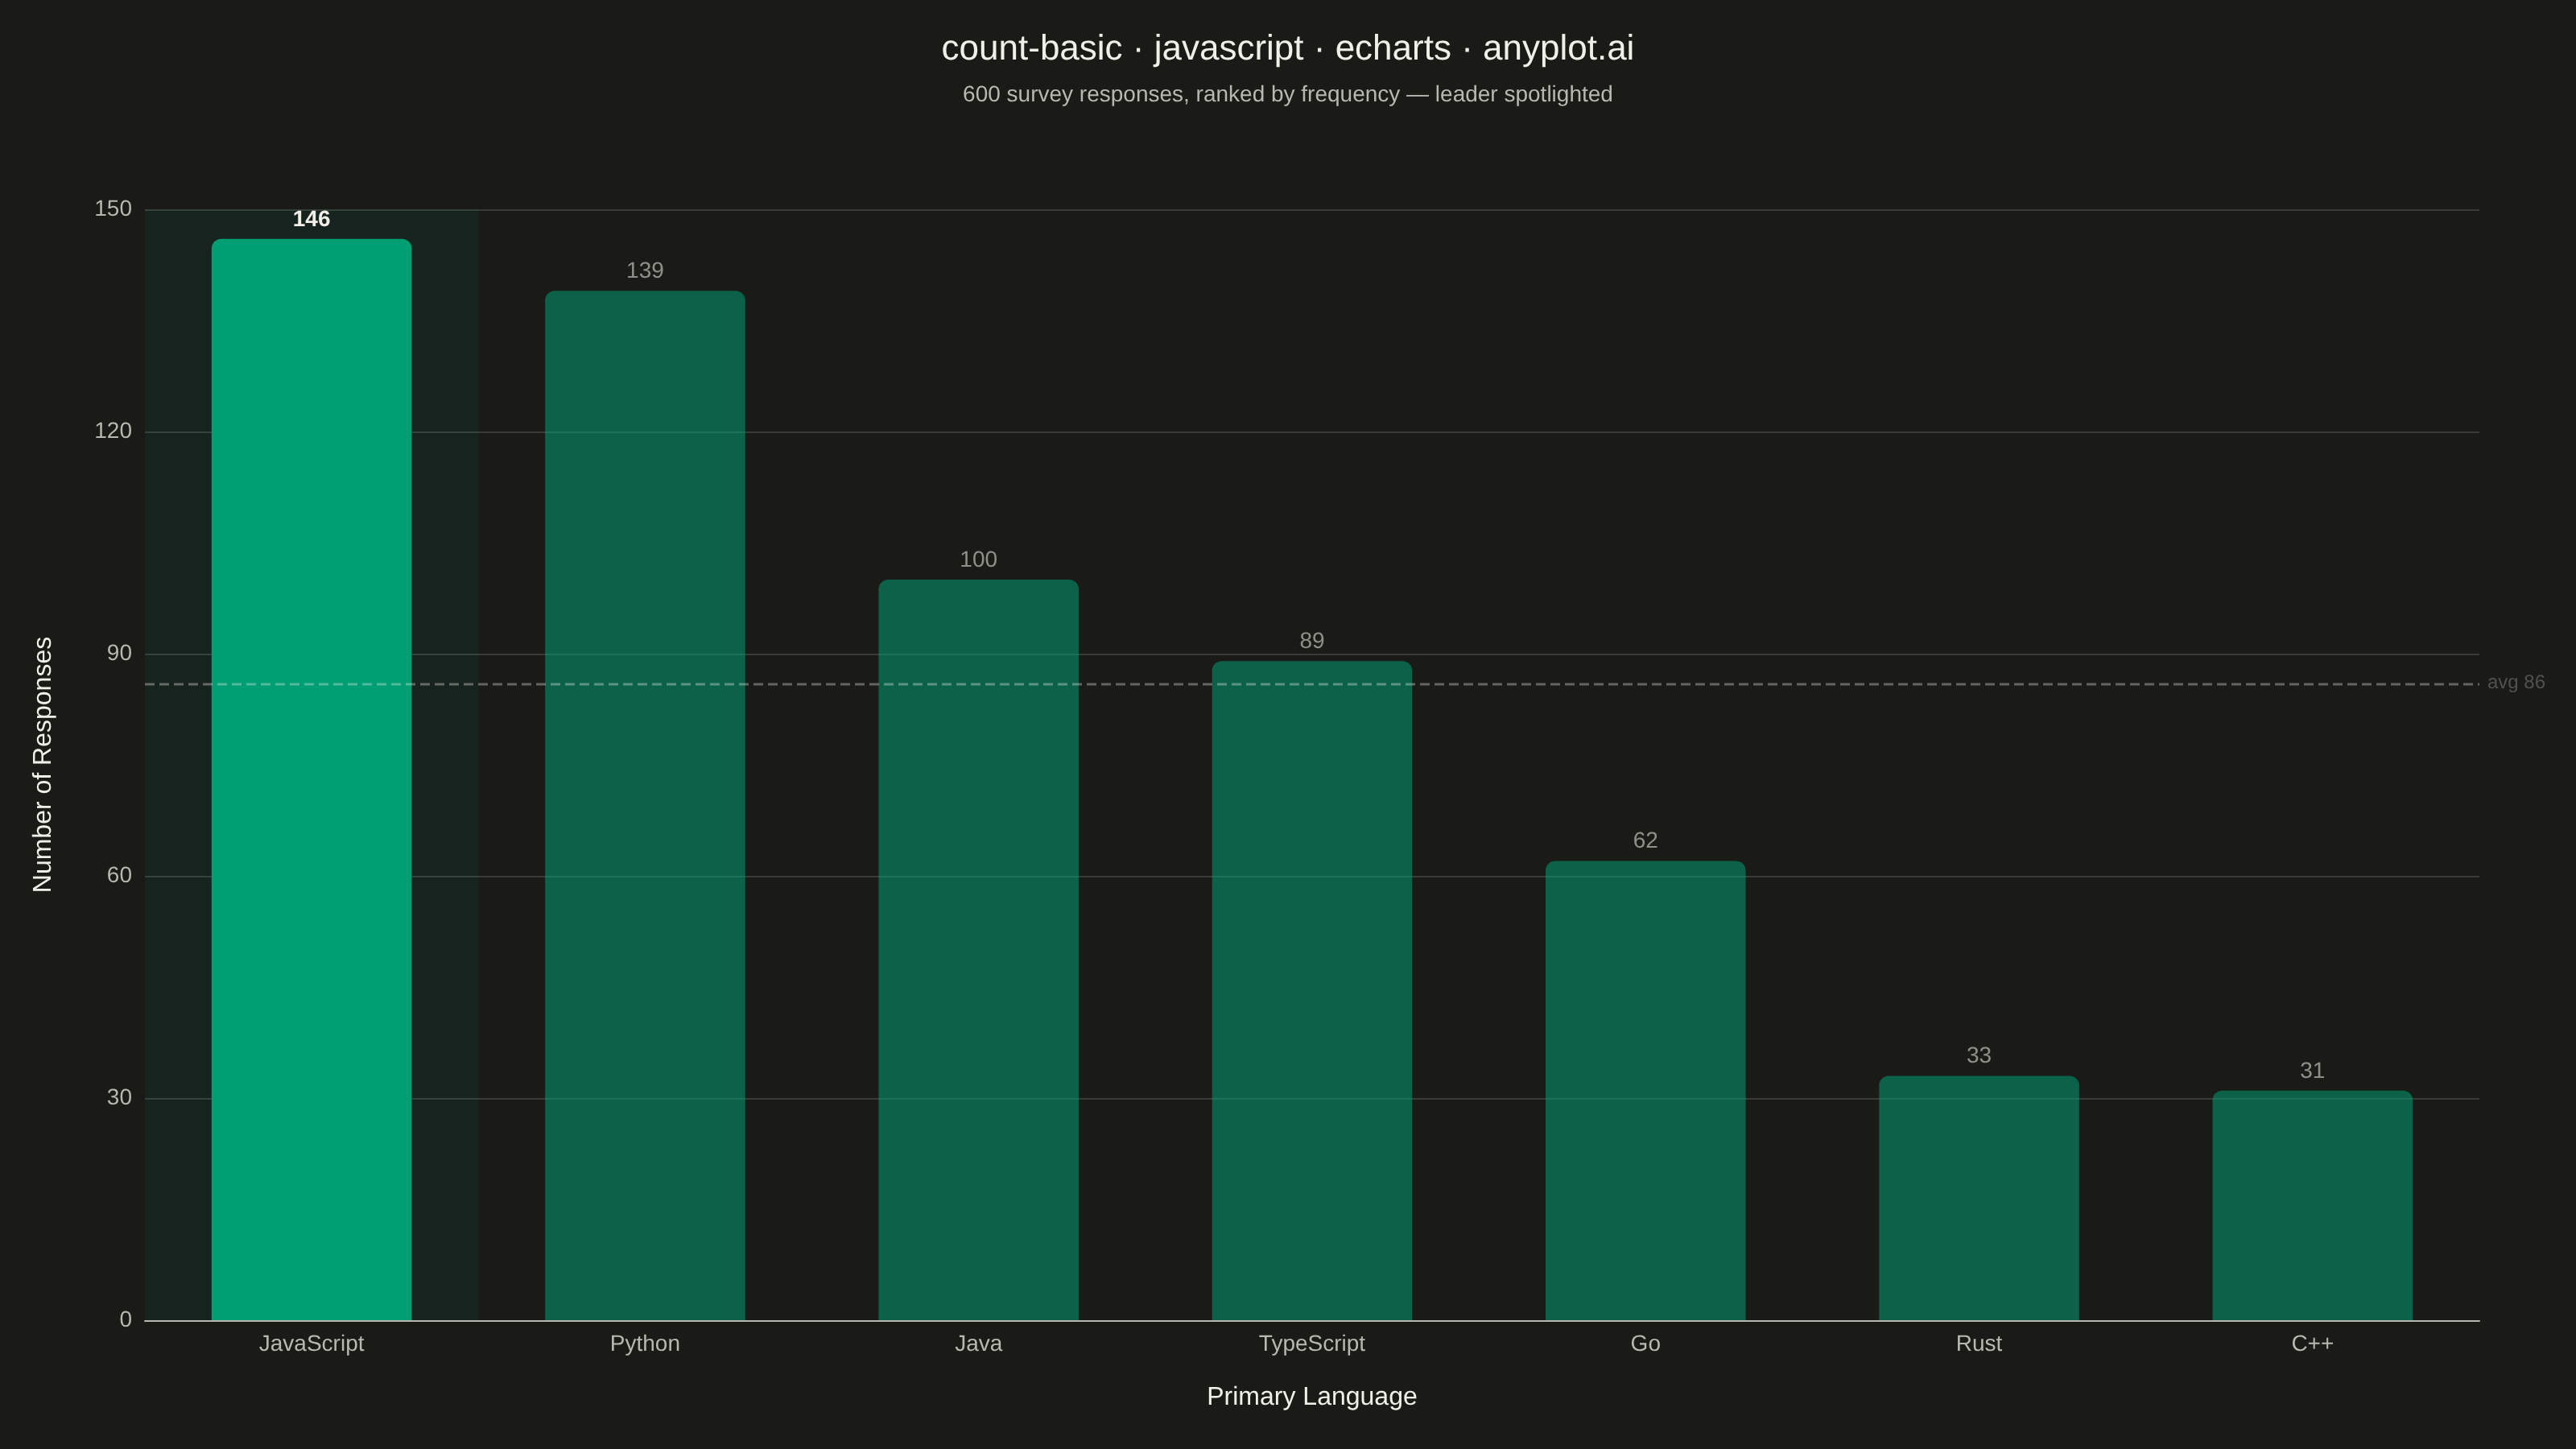
A count plot displays the frequency of observations in each category of a categorical variable using vertical bars. Unlike a basic bar chart that requires pre-computed values, a count plot automatically counts occurrences from raw data. This makes it ideal for quick exploratory analysis of categorical distributions without manual aggregation.
Preview render from the Apache ECharts implementation.