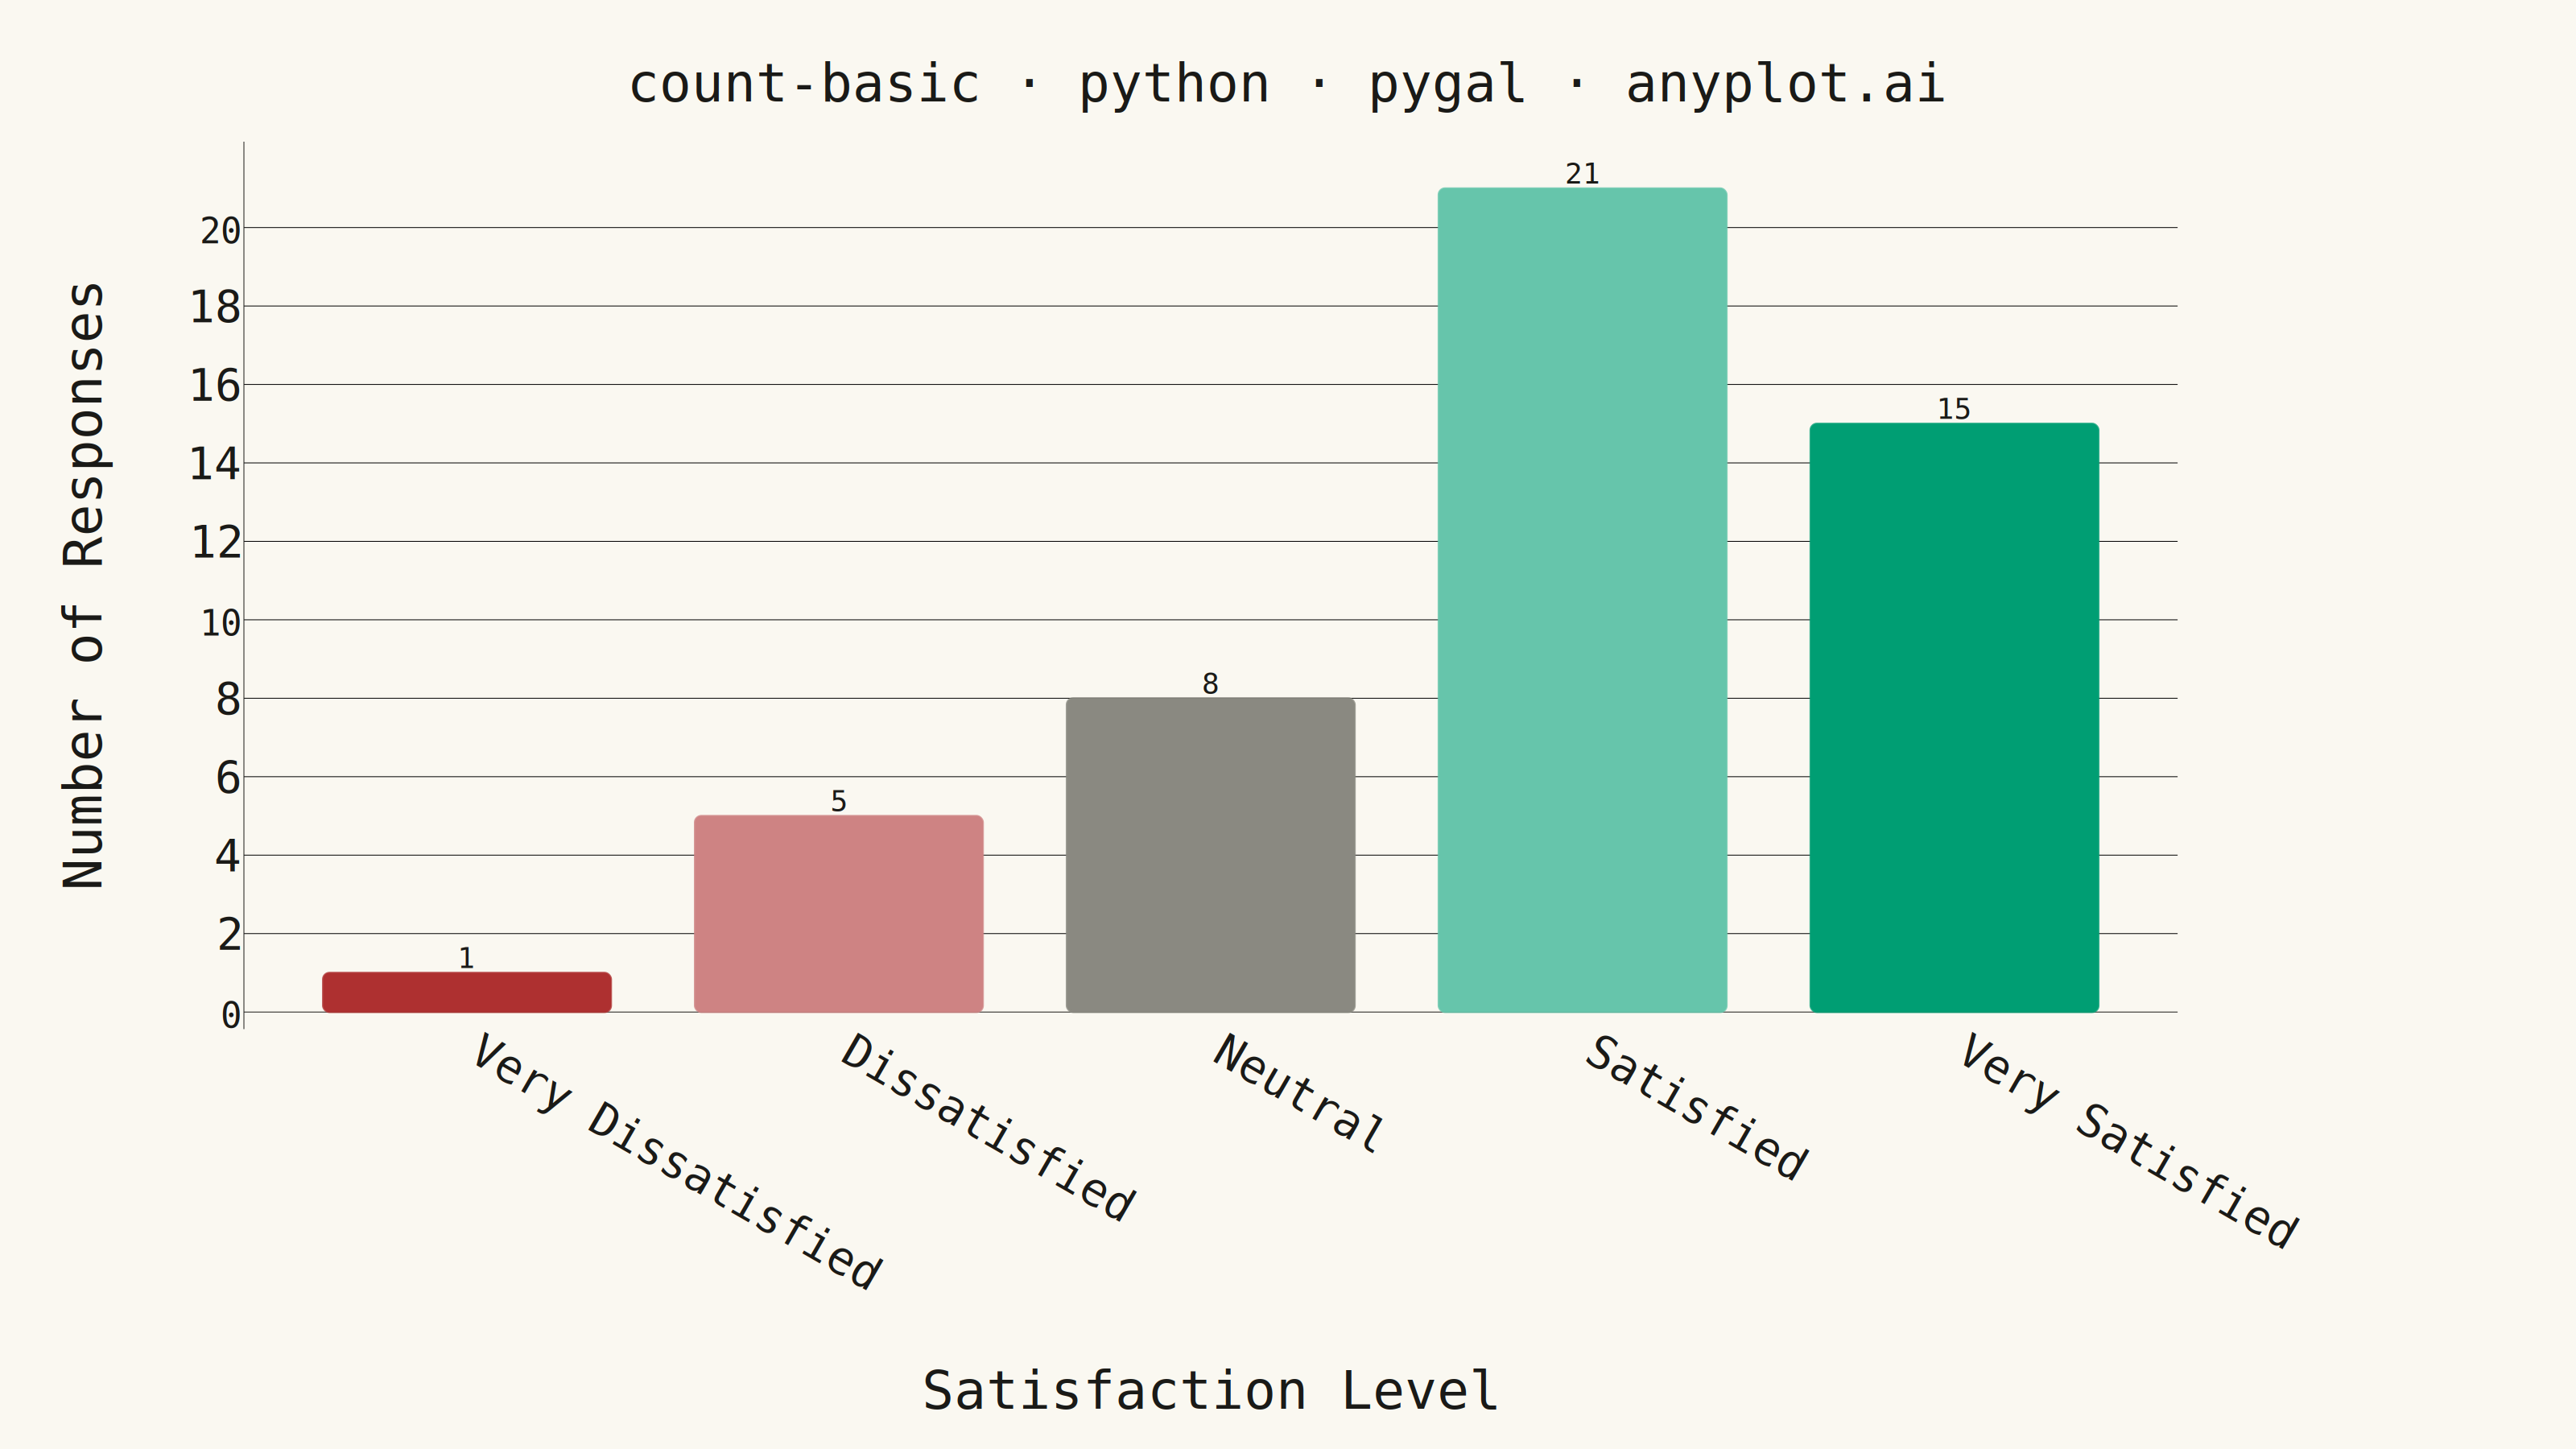
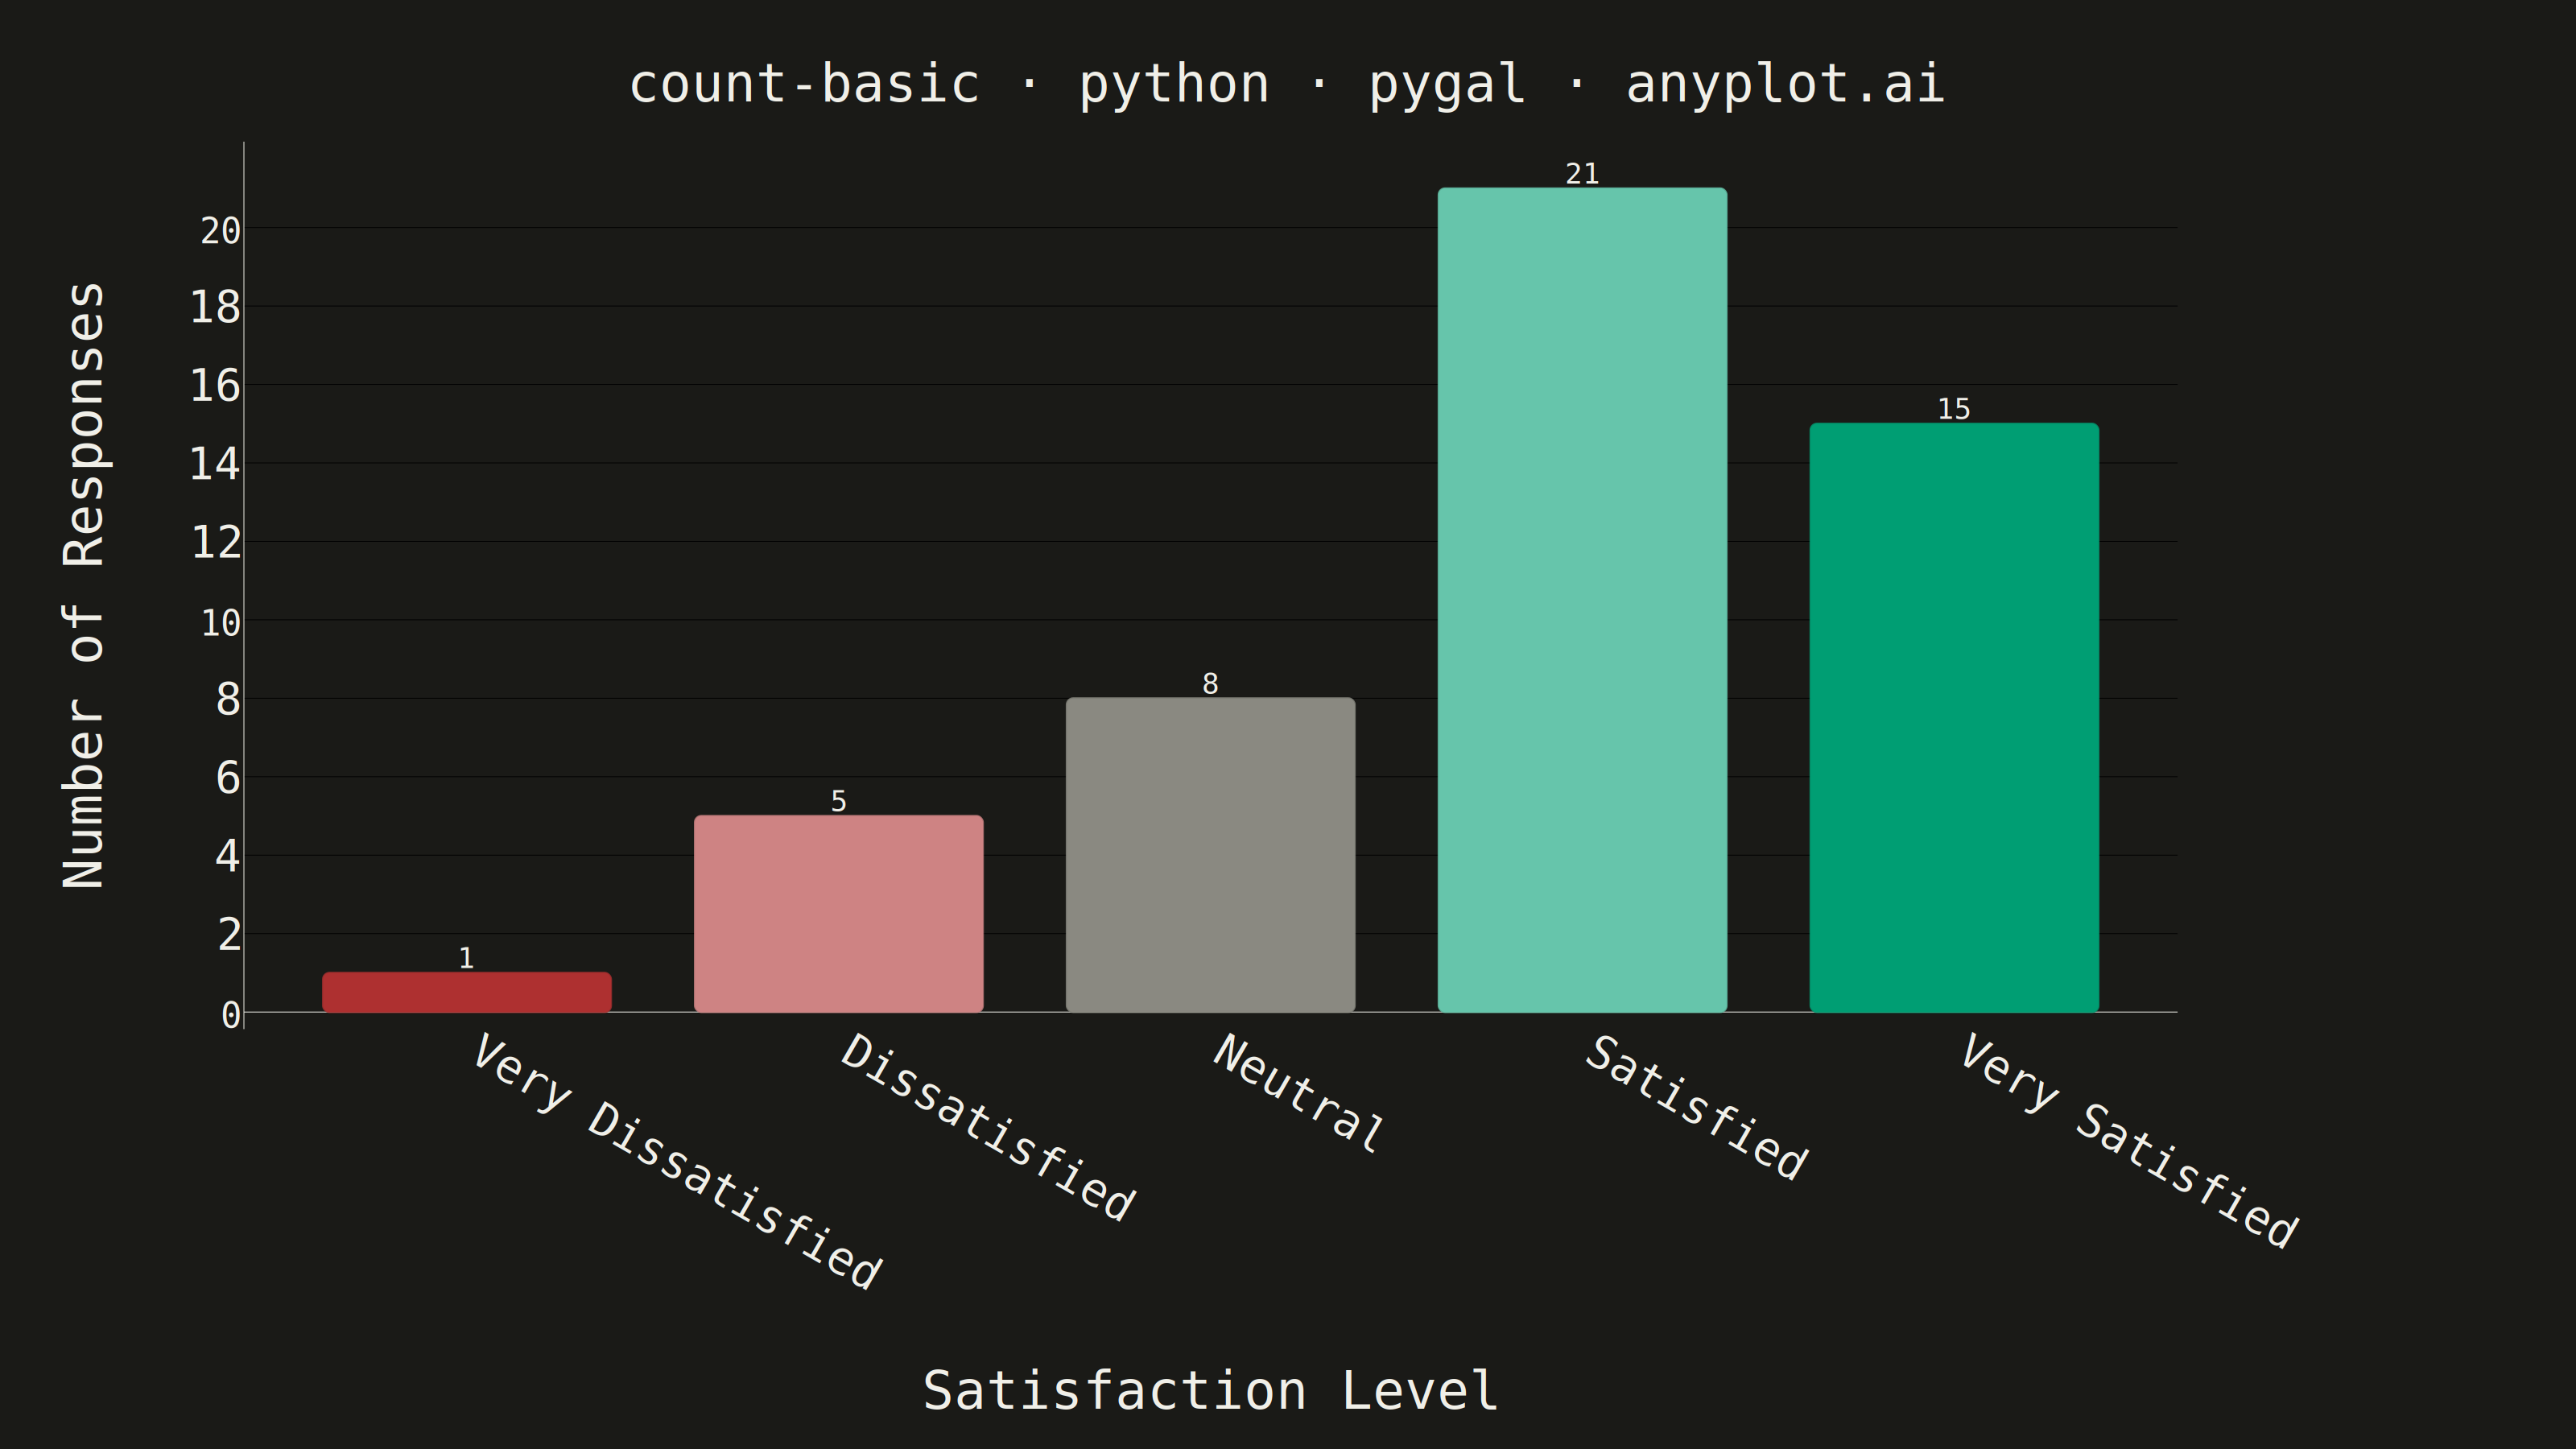
A count plot displays the frequency of observations in each category of a categorical variable using vertical bars. Unlike a basic bar chart that requires pre-computed values, a count plot automatically counts occurrences from raw data. This makes it ideal for quick exploratory analysis of categorical distributions without manual aggregation.
""" anyplot.ai
count-basic: Basic Count Plot
Library: pygal 3.1.3 | Python 3.13.14
Quality: 89/100 | Updated: 2026-08-11
"""

import os
import sys
from collections import Counter


# Work around naming conflict: pygal.py filename shadows pygal package
sys.path.pop(0)

import pygal
from pygal.style import Style


THEME = os.getenv("ANYPLOT_THEME", "light")
PAGE_BG = "#FAF8F1" if THEME == "light" else "#1A1A17"
INK = "#1A1A17" if THEME == "light" else "#F0EFE8"
INK_MUTED = "#6B6A63" if THEME == "light" else "#A8A79F"

IMPRINT = ("#009E73", "#C475FD", "#4467A3", "#BD8233", "#AE3030", "#2ABCCD", "#954477")


# Semantic anchors reused for the sentiment scale below (Imprint palette
# "Semantic exception": positive -> green, negative -> red, neutral -> muted).
# Each polarity gets two shades so the two intensity levels ("Dissatisfied"
# vs "Very Dissatisfied", "Satisfied" vs "Very Satisfied") stay visually
# distinguishable while keeping the hue. The lighter shade is a precomputed
# *opaque* hex (Imprint hex blended 60% over white) rather than an rgba()
# with embedded alpha -- an alpha-carrying fill would composite against
# plot_background, which flips between themes and breaks palette identity
# (VQ-07); the full-strength hex is reserved for the "Very" (most intense)
# category.
POSITIVE = "#66C5AB"  # brand green blended 60% over white, "Satisfied"
POSITIVE_STRONG = IMPRINT[0]  # full-strength brand green, "Very Satisfied"
NEGATIVE = "#CE8383"  # matte red blended 60% over white, "Dissatisfied"
NEGATIVE_STRONG = IMPRINT[4]  # full-strength matte red, "Very Dissatisfied"
# Fixed muted gray (average of the light/dark INK_MUTED tones) rather than
# the theme-adaptive INK_MUTED itself: this is a *data* series color, so it
# must stay palette-identical across themes like the other four bars (VQ-07)
# -- only chrome (title, ticks, gridlines) is allowed to flip with the theme.
NEUTRAL = "#8A8981"

# Data - Survey responses from customer feedback
responses = [
    "Satisfied",
    "Very Satisfied",
    "Satisfied",
    "Neutral",
    "Dissatisfied",
    "Very Satisfied",
    "Satisfied",
    "Satisfied",
    "Very Satisfied",
    "Neutral",
    "Satisfied",
    "Neutral",
    "Very Satisfied",
    "Satisfied",
    "Very Satisfied",
    "Dissatisfied",
    "Satisfied",
    "Very Satisfied",
    "Neutral",
    "Satisfied",
    "Very Satisfied",
    "Satisfied",
    "Satisfied",
    "Very Dissatisfied",
    "Satisfied",
    "Neutral",
    "Very Satisfied",
    "Satisfied",
    "Dissatisfied",
    "Satisfied",
    "Very Satisfied",
    "Satisfied",
    "Neutral",
    "Satisfied",
    "Very Satisfied",
    "Satisfied",
    "Very Satisfied",
    "Neutral",
    "Dissatisfied",
    "Satisfied",
    "Very Satisfied",
    "Satisfied",
    "Satisfied",
    "Very Satisfied",
    "Neutral",
    "Satisfied",
    "Dissatisfied",
    "Very Satisfied",
    "Satisfied",
    "Very Satisfied",
]

# Count occurrences
counts = Counter(responses)
total = len(responses)

# Define category order (logical satisfaction order) and its sentiment color
category_order = ["Very Dissatisfied", "Dissatisfied", "Neutral", "Satisfied", "Very Satisfied"]
category_sentiment = {
    "Very Dissatisfied": NEGATIVE_STRONG,
    "Dissatisfied": NEGATIVE,
    "Neutral": NEUTRAL,
    "Satisfied": POSITIVE,
    "Very Satisfied": POSITIVE_STRONG,
}

# Custom style, sized for the 3200x1800 canvas (see prompts/library/pygal.md
# "Sizing + Theme" - unitless pygal sizes map ~1:1 onto source pixels)
custom_style = Style(
    background=PAGE_BG,
    plot_background=PAGE_BG,
    foreground=INK,
    foreground_strong=INK,
    foreground_subtle=INK_MUTED,
    colors=IMPRINT,
    # Pin fill opacity so literal-hex bars render at full strength instead of
    # compositing against plot_background (which flips between themes and
    # would otherwise break palette identity across light/dark, VQ-07).
    opacity="1",
    # Print-value text otherwise defaults to black/white per bar-fill
    # luminance (pygal's Style.value_colors heuristic) rather than the
    # theme-adaptive ink used everywhere else -- pin it to INK so the counts
    # stay legible against the plot background in both themes.
    value_colors=(INK,),
    title_font_size=66,
    label_font_size=56,
    major_label_font_size=44,
    legend_font_size=44,
    value_font_size=36,
    tooltip_font_size=32,
    stroke_width=2.5,
    # Style guide requires solid (not dashed) y-guides at low opacity;
    # pygal defaults to a dashed stroke, so force it off here.
    guide_stroke_dasharray="none",
    major_guide_stroke_dasharray="none",
)

# Create chart
chart = pygal.Bar(
    width=3200,
    height=1800,
    style=custom_style,
    title="count-basic · python · pygal · anyplot.ai",
    x_title="Satisfaction Level",
    y_title="Number of Responses",
    show_legend=False,
    show_y_guides=True,
    show_x_guides=False,
    print_values=True,
    print_values_position="top",
    value_formatter=lambda x: str(int(x)),
    rounded_bars=8,
    margin=50,
    spacing=60,
    x_label_rotation=30,
)

# Set x-axis labels
chart.x_labels = category_order

# Advanced pygal technique: per-bar metadata gives each category a sentiment
# color (Imprint semantic exception: positive->green, negative->red,
# neutral->muted) and a hover tooltip with the response share, instead of a
# single flat series color.
chart.add(
    "Responses",
    [
        {
            "value": counts.get(cat, 0),
            "color": category_sentiment[cat],
            "tooltip": f"{cat}: {counts.get(cat, 0)} responses ({counts.get(cat, 0) / total:.0%})",
        }
        for cat in category_order
    ],
)

# Save outputs
chart.render_to_png(f"plot-{THEME}.png")
with open(f"plot-{THEME}.html", "wb") as f:
    f.write(chart.render())
Runnable source as JSON, for any HTTP client: https://api.anyplot.ai/specs/count-basic/pygal/code. Any spec id and library id listed in llms-full.txt fit the same URL shape; every URL below is complete and callable.
{
  "spec_id": "count-basic",
  "language": "python",
  "library": "pygal",
  "page": "https://anyplot.ai/count-basic/python/pygal",
  "hub": "https://anyplot.ai/count-basic",
  "code_json": "https://api.anyplot.ai/specs/count-basic/pygal/code",
  "spec_json": "https://api.anyplot.ai/specs/count-basic",
  "render_light_png": "https://storage.googleapis.com/anyplot-images/plots/count-basic/python/pygal/plot-light.png",
  "render_dark_png": "https://storage.googleapis.com/anyplot-images/plots/count-basic/python/pygal/plot-dark.png",
  "interactive_light_html": "https://storage.googleapis.com/anyplot-images/plots/count-basic/python/pygal/plot-light.html",
  "interactive_dark_html": "https://storage.googleapis.com/anyplot-images/plots/count-basic/python/pygal/plot-dark.html",
  "quality_score": 89.0,
  "license": "MIT",
  "guide": "https://anyplot.ai/llms.txt"
}
Part of Basic Count Plot on anyplot.ai.