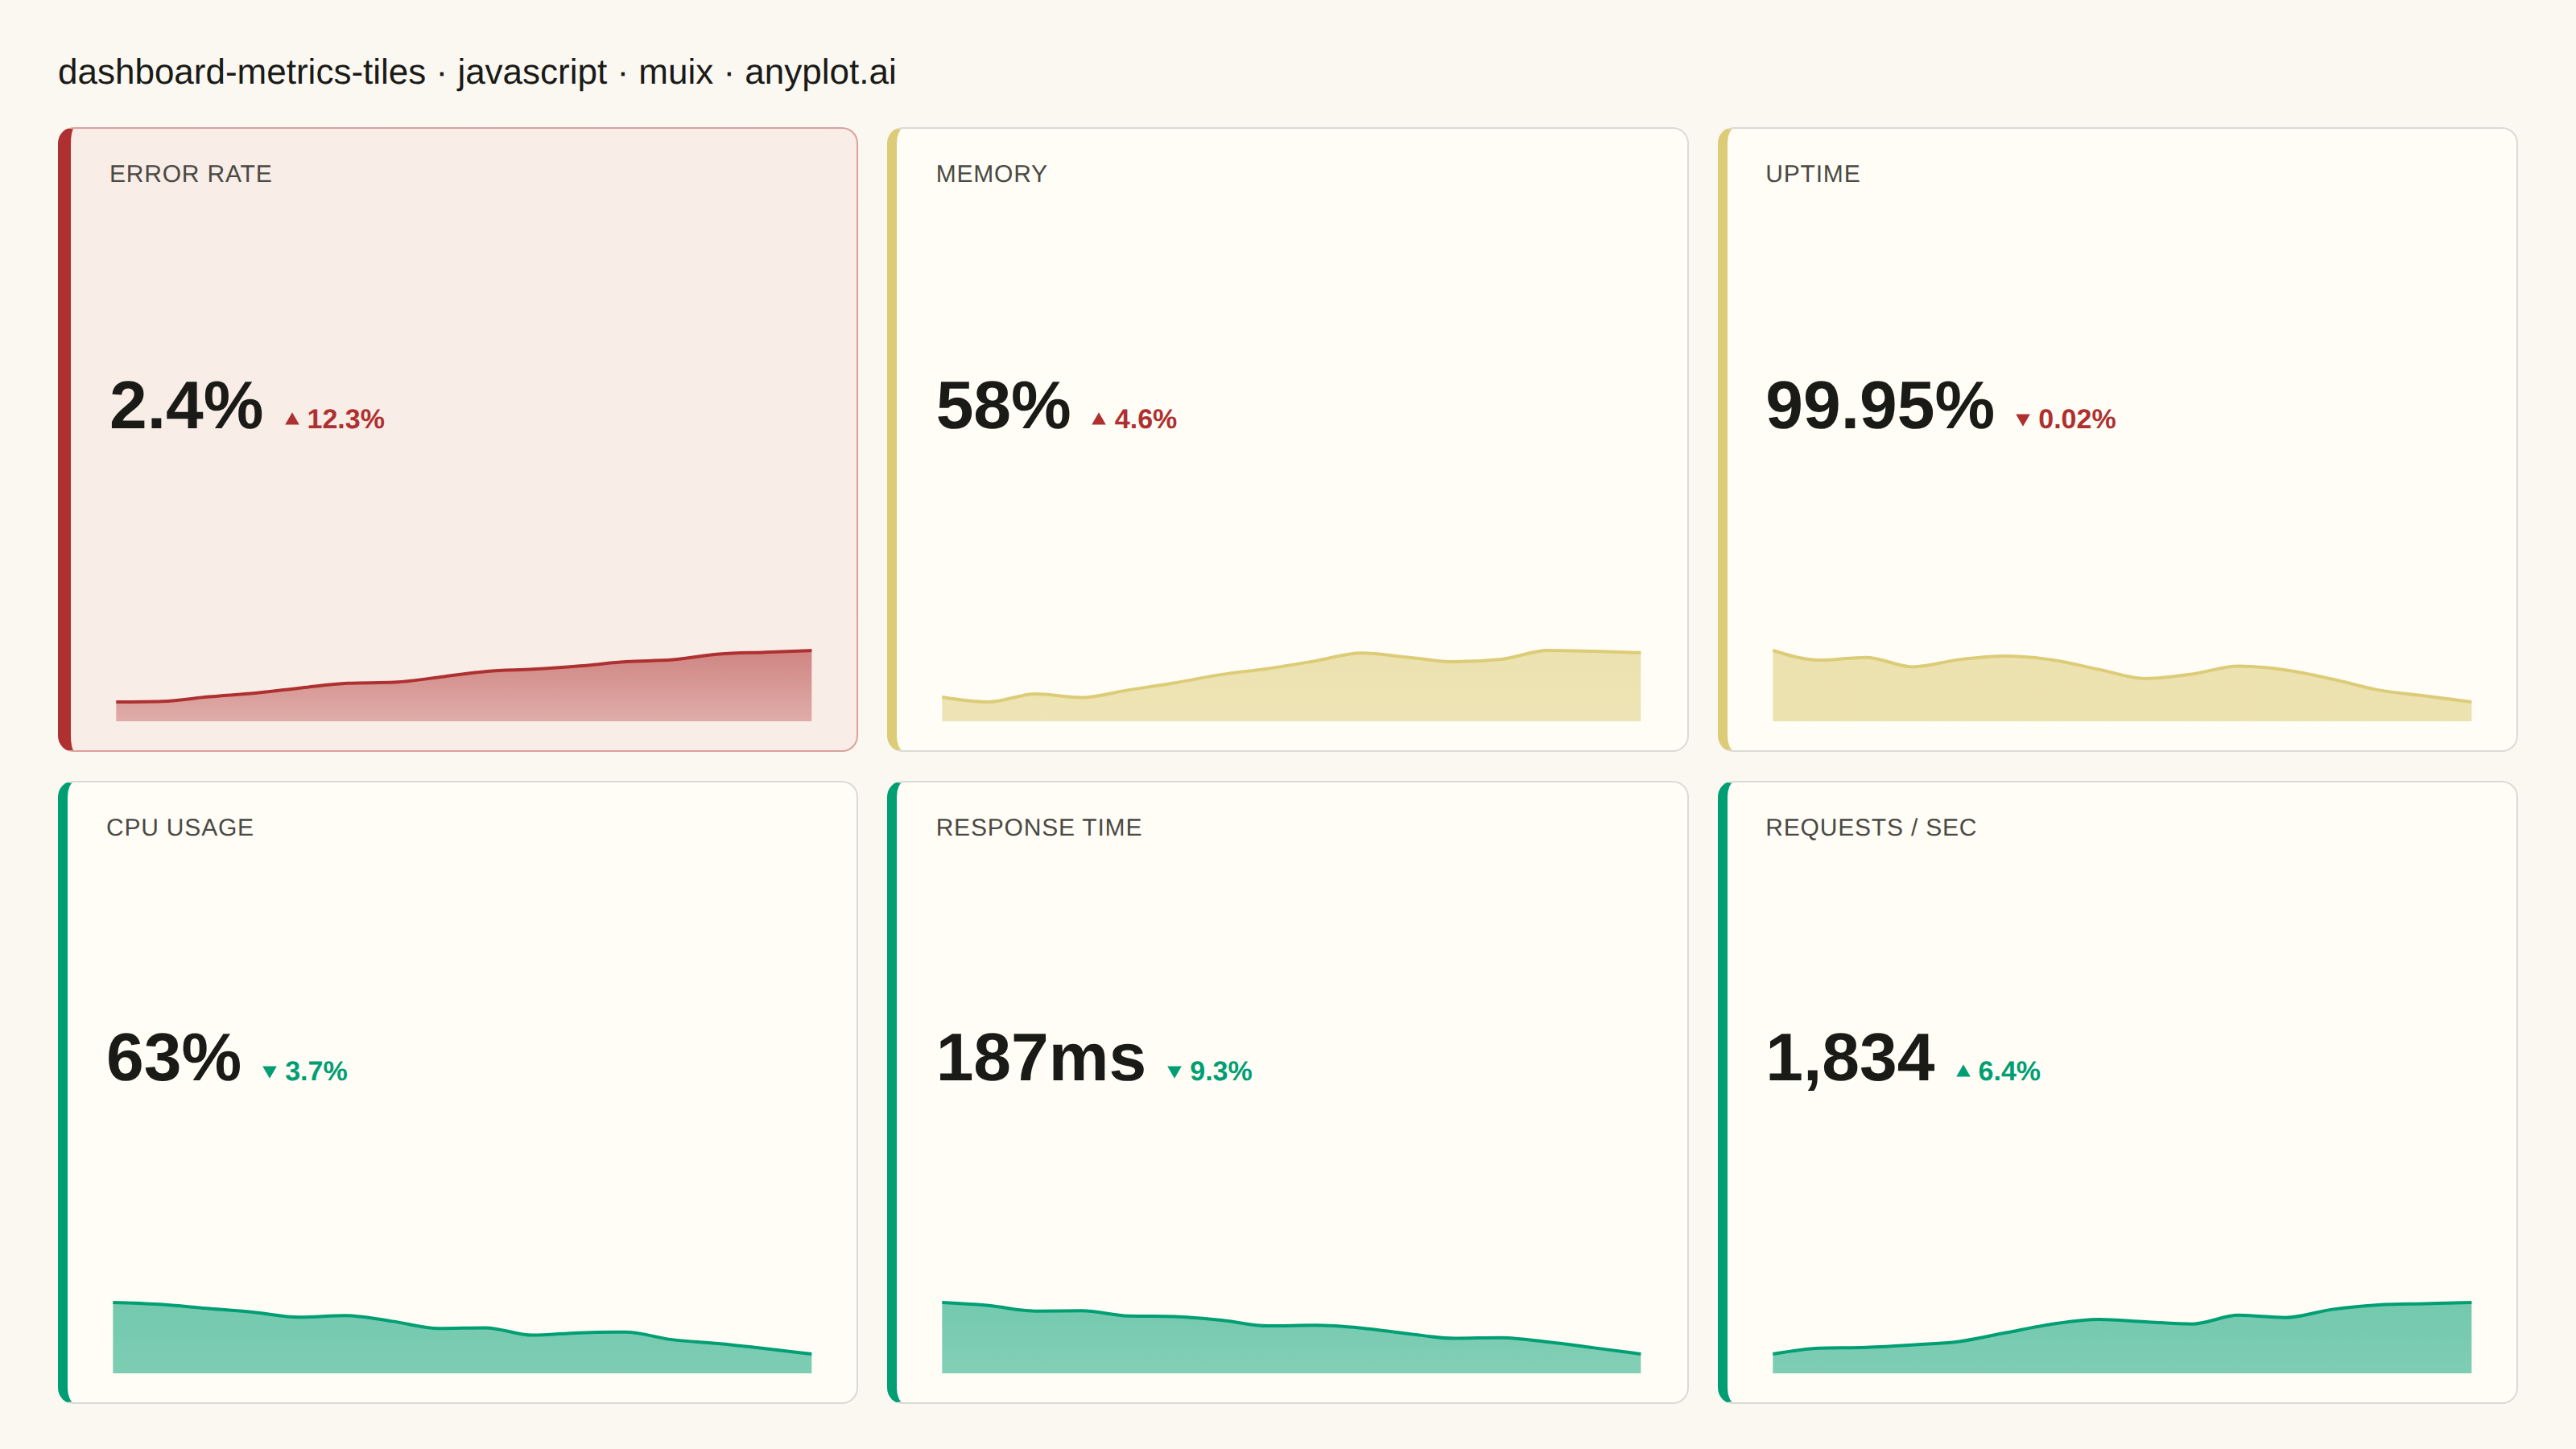
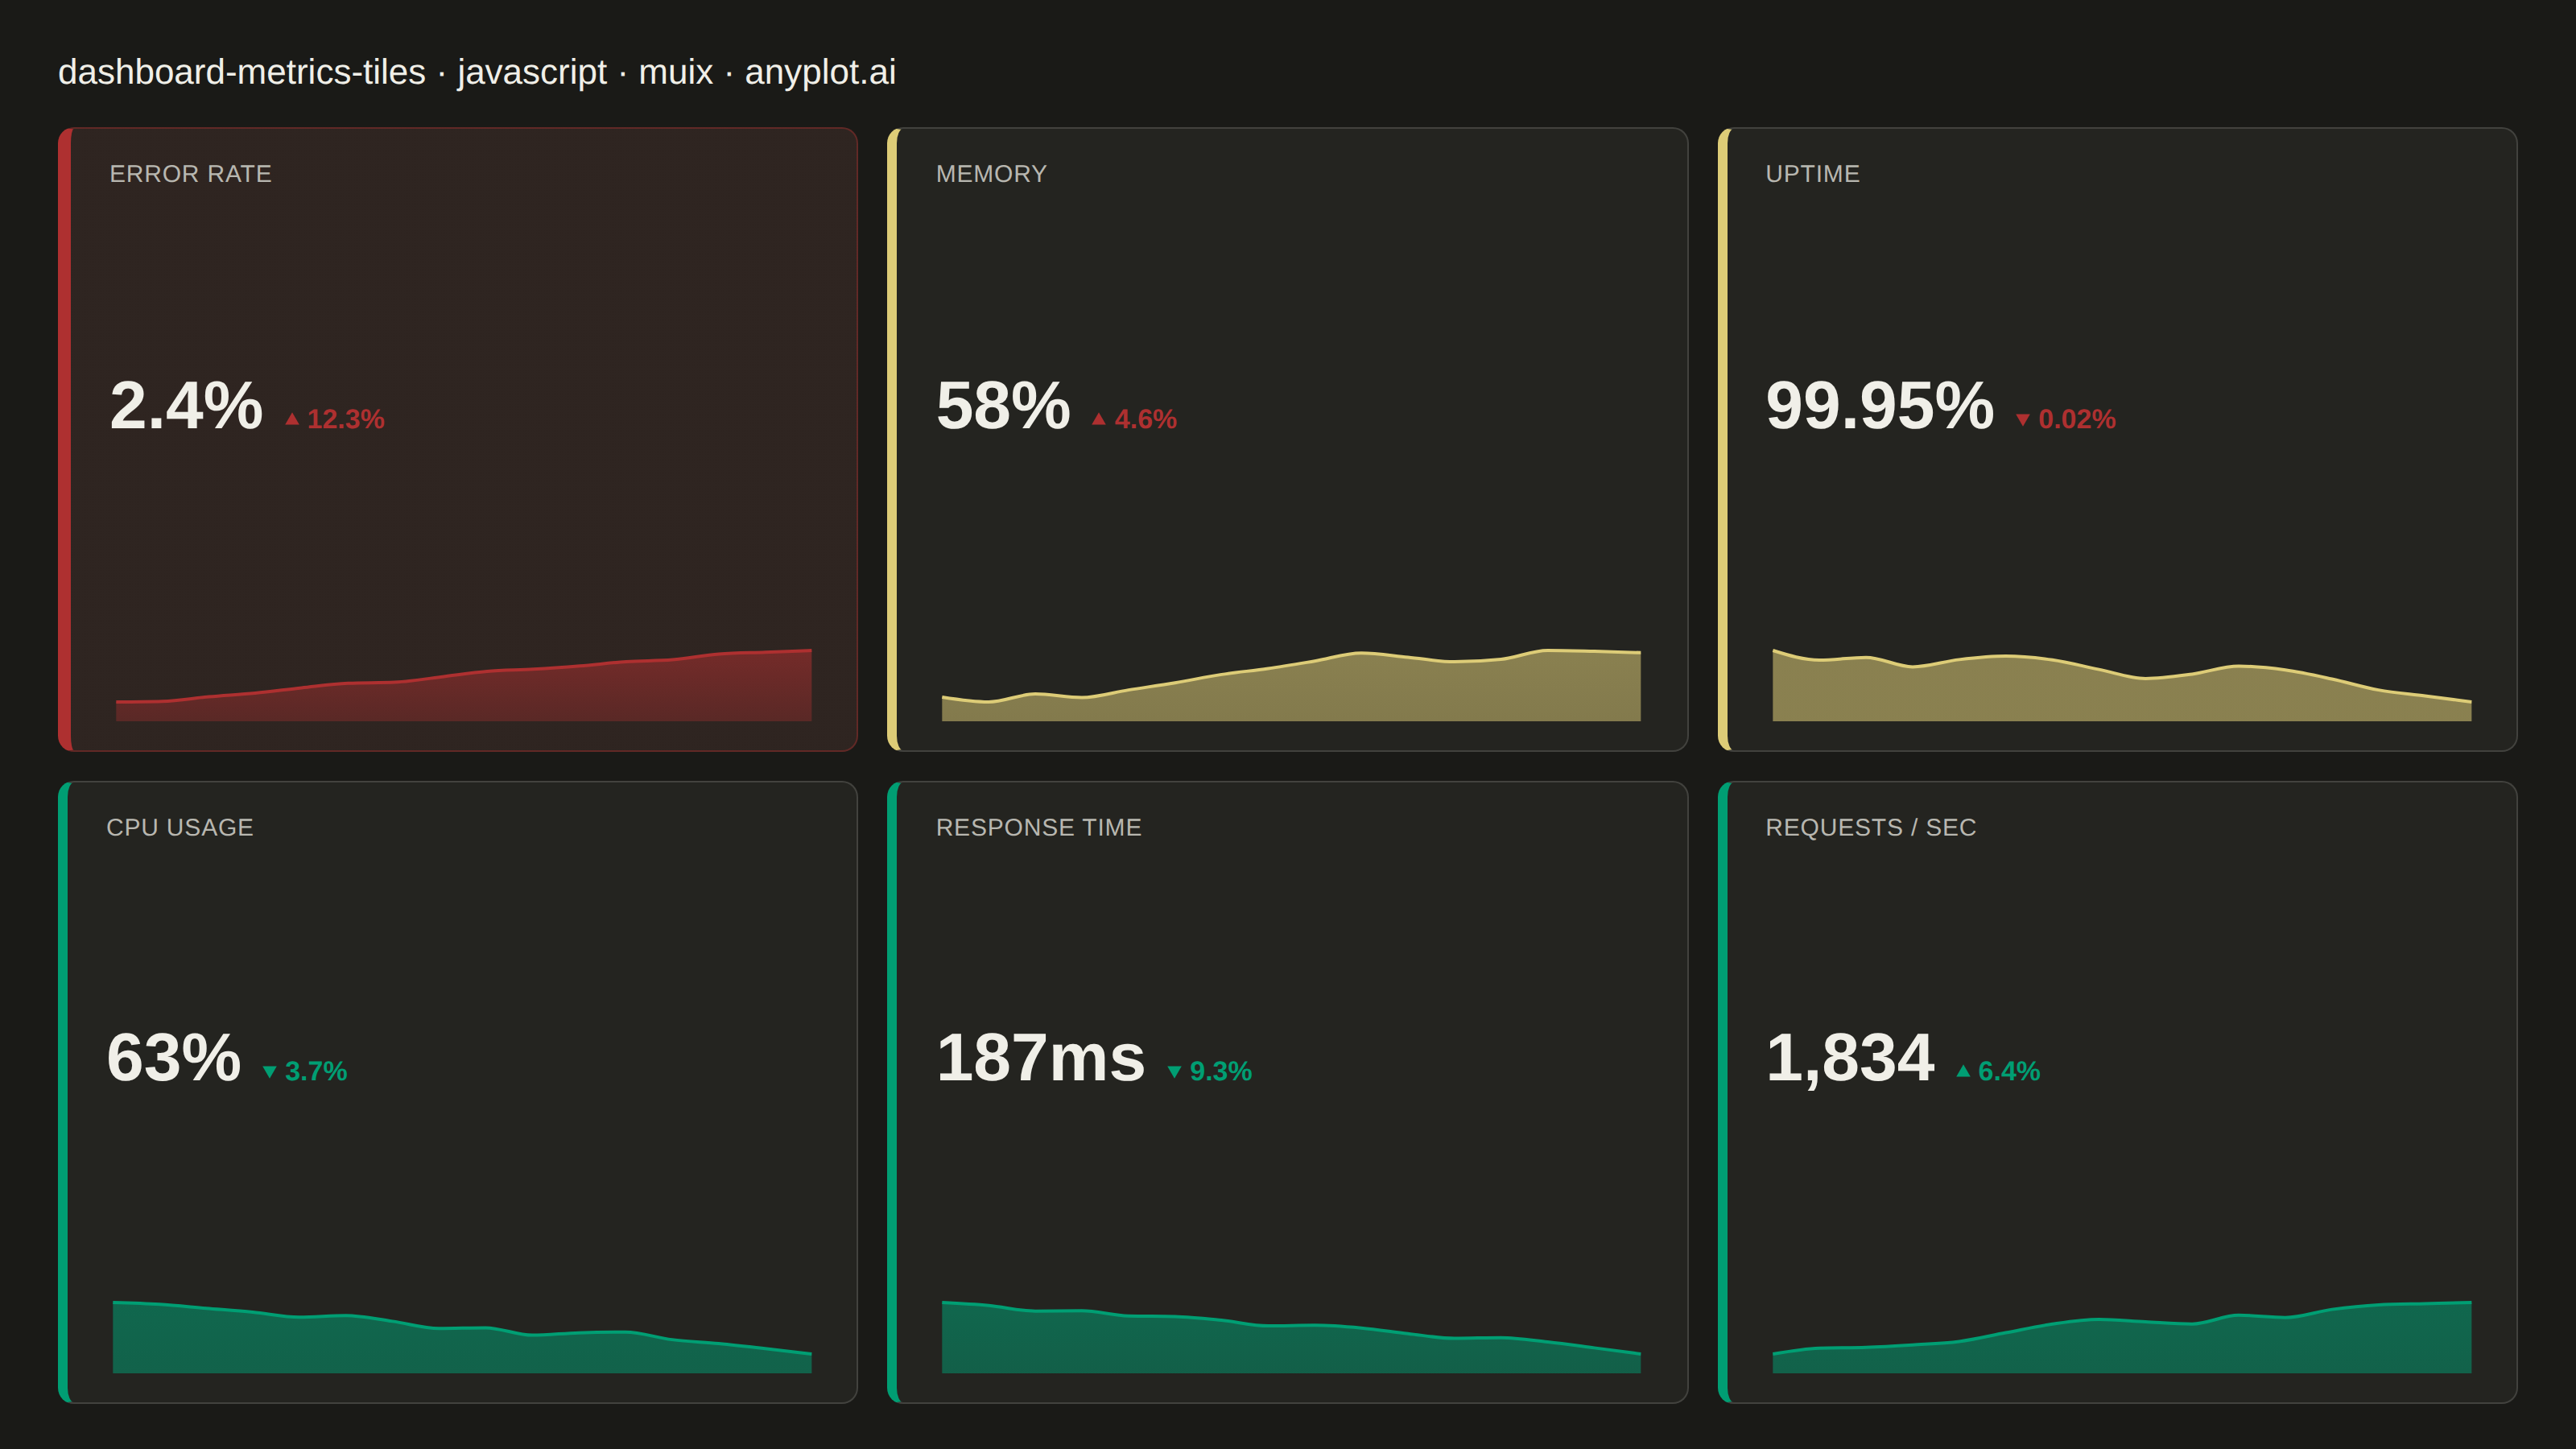
A dashboard layout displaying multiple metric tiles in a responsive grid, where each tile shows a KPI value with its label, an embedded sparkline showing recent trend, and a change indicator (up/down arrow with percentage). This visualization is essential for operations monitoring and business dashboards where multiple metrics need to be tracked simultaneously at a glance. The combination of current value, trend visualization, and change direction provides comprehensive metric context in a compact format.
Preview render from the MUI X Charts implementation.