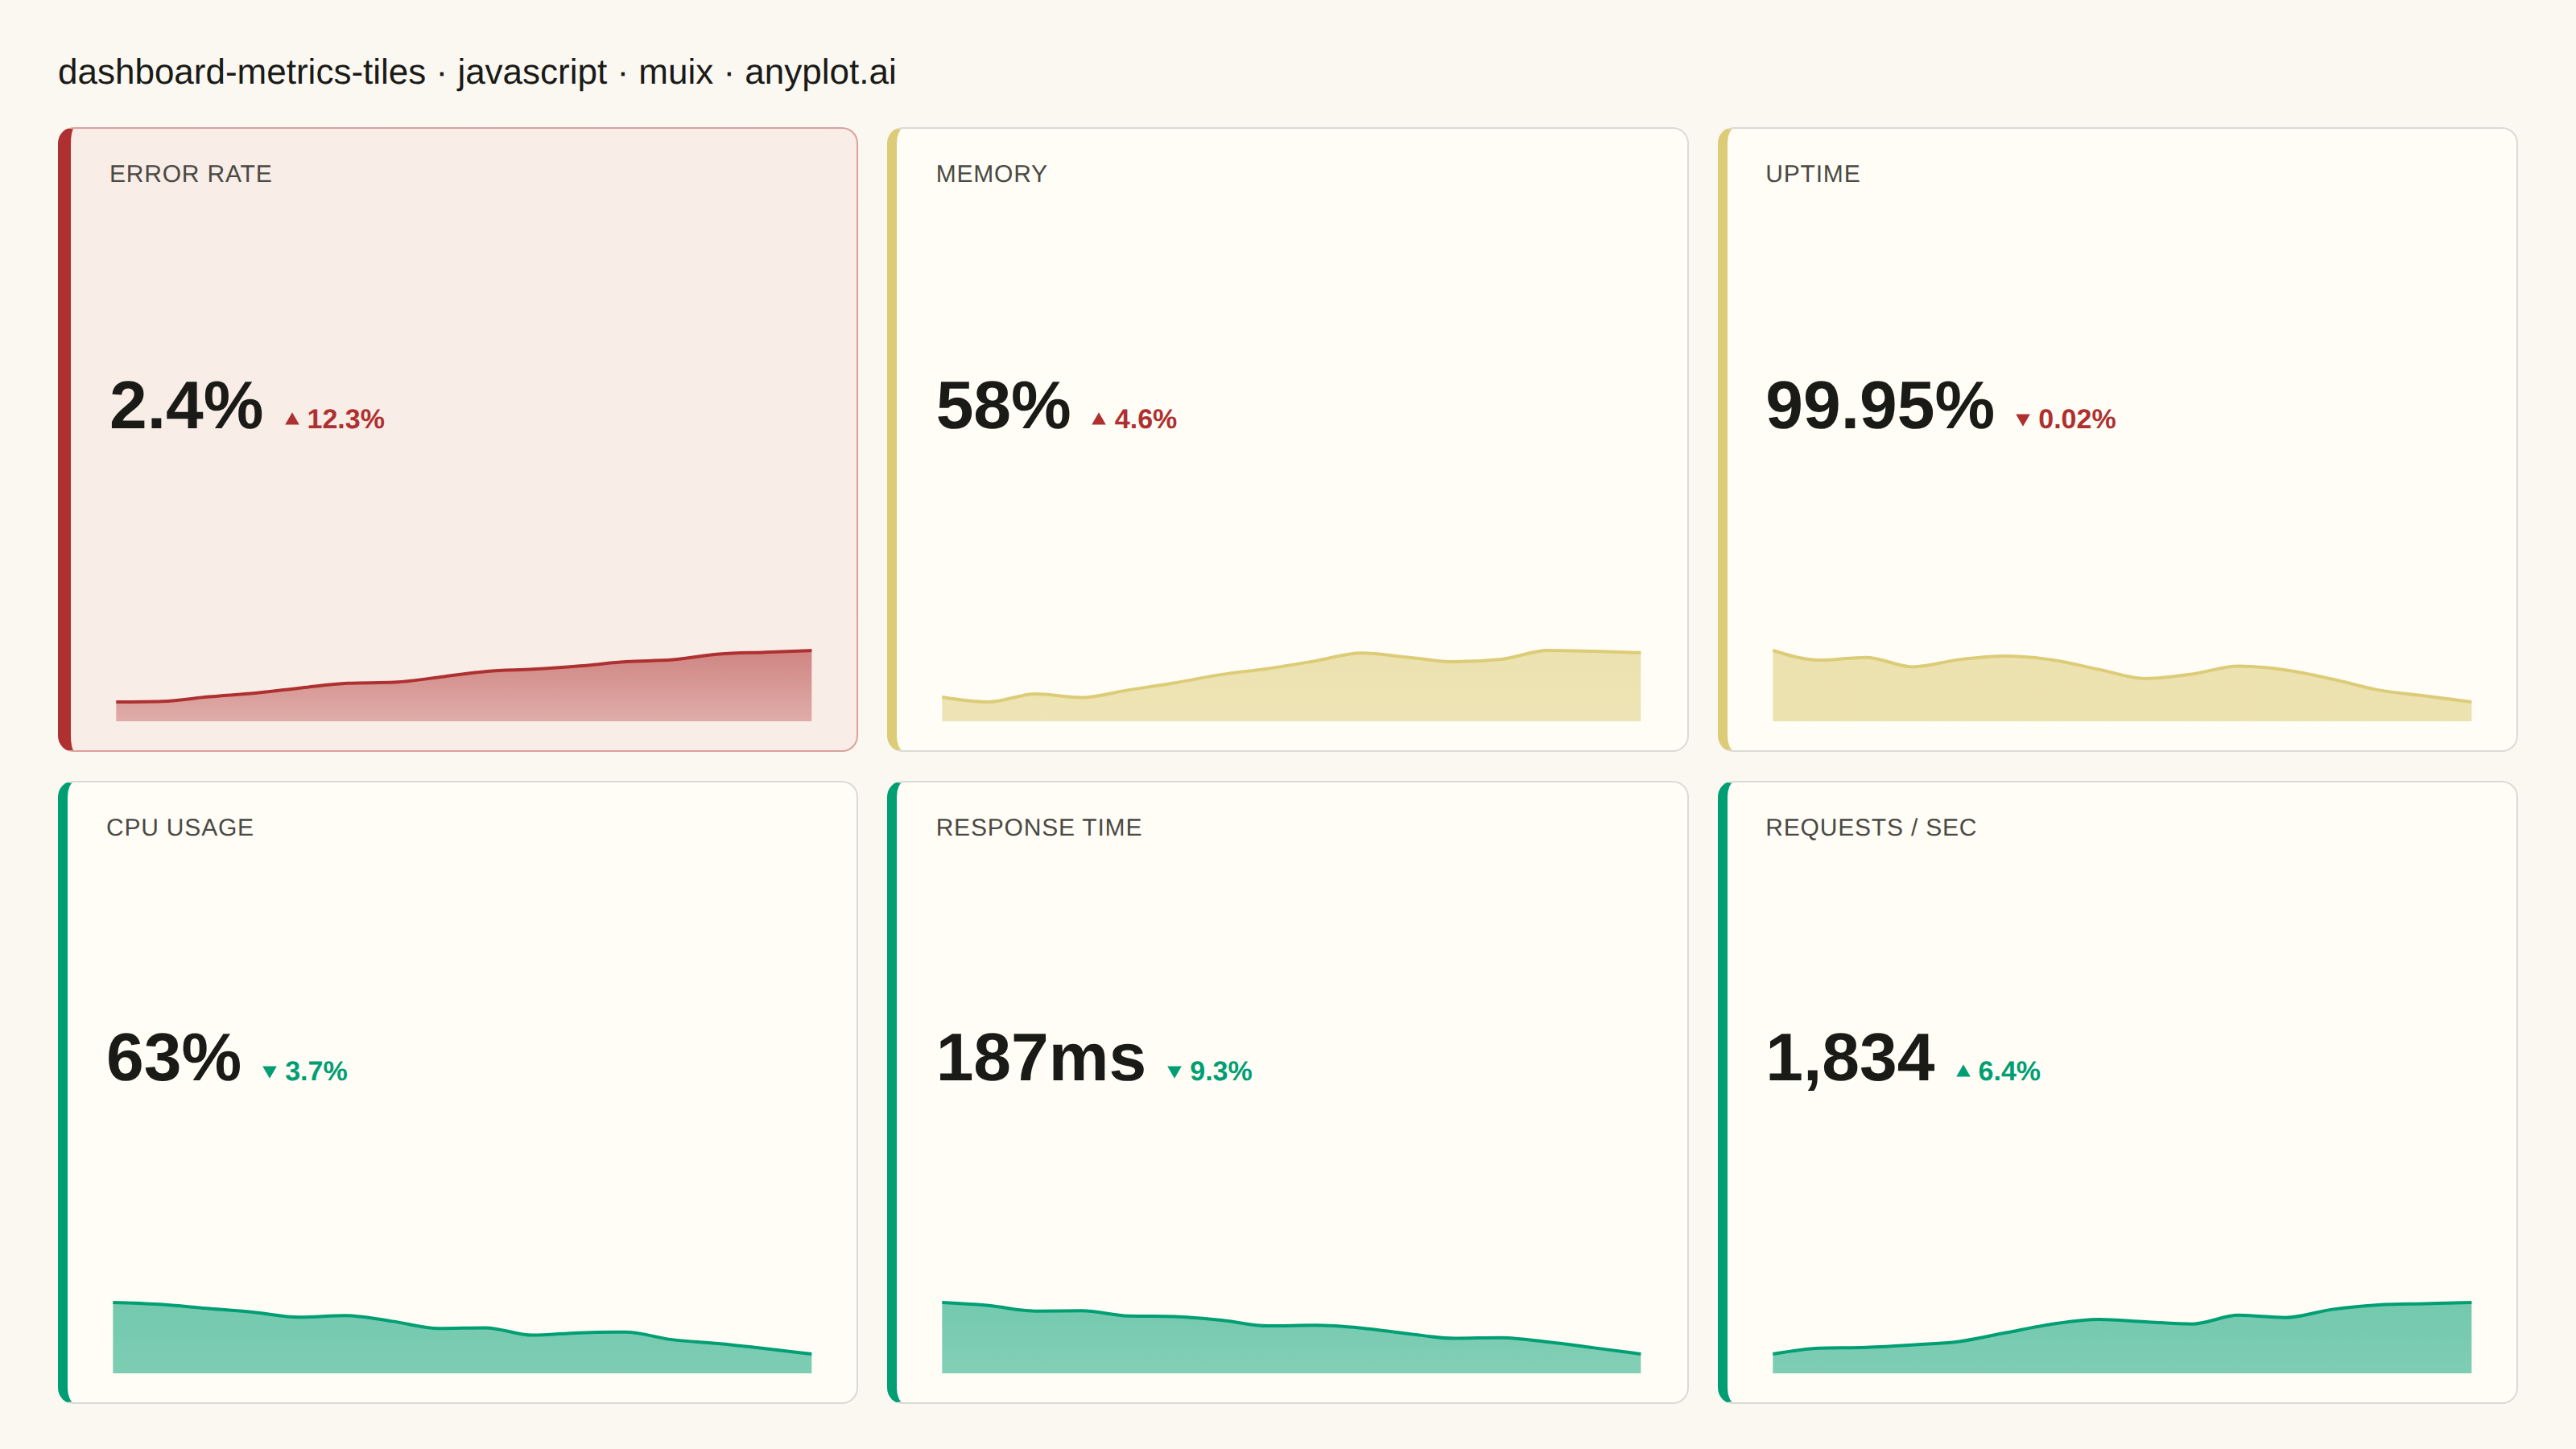
The same plot in 14 other libraries — JavaScript: Chart.js, D3.js, Apache ECharts, Highcharts; Python: Altair, Bokeh, lets-plot, Matplotlib, Plotly, plotnine, Pygal, Seaborn; R: ggplot2; Julia: Makie.jl. Compare all 15 side by side: Real-Time Dashboard Tiles in Python, R, Julia and JavaScript.
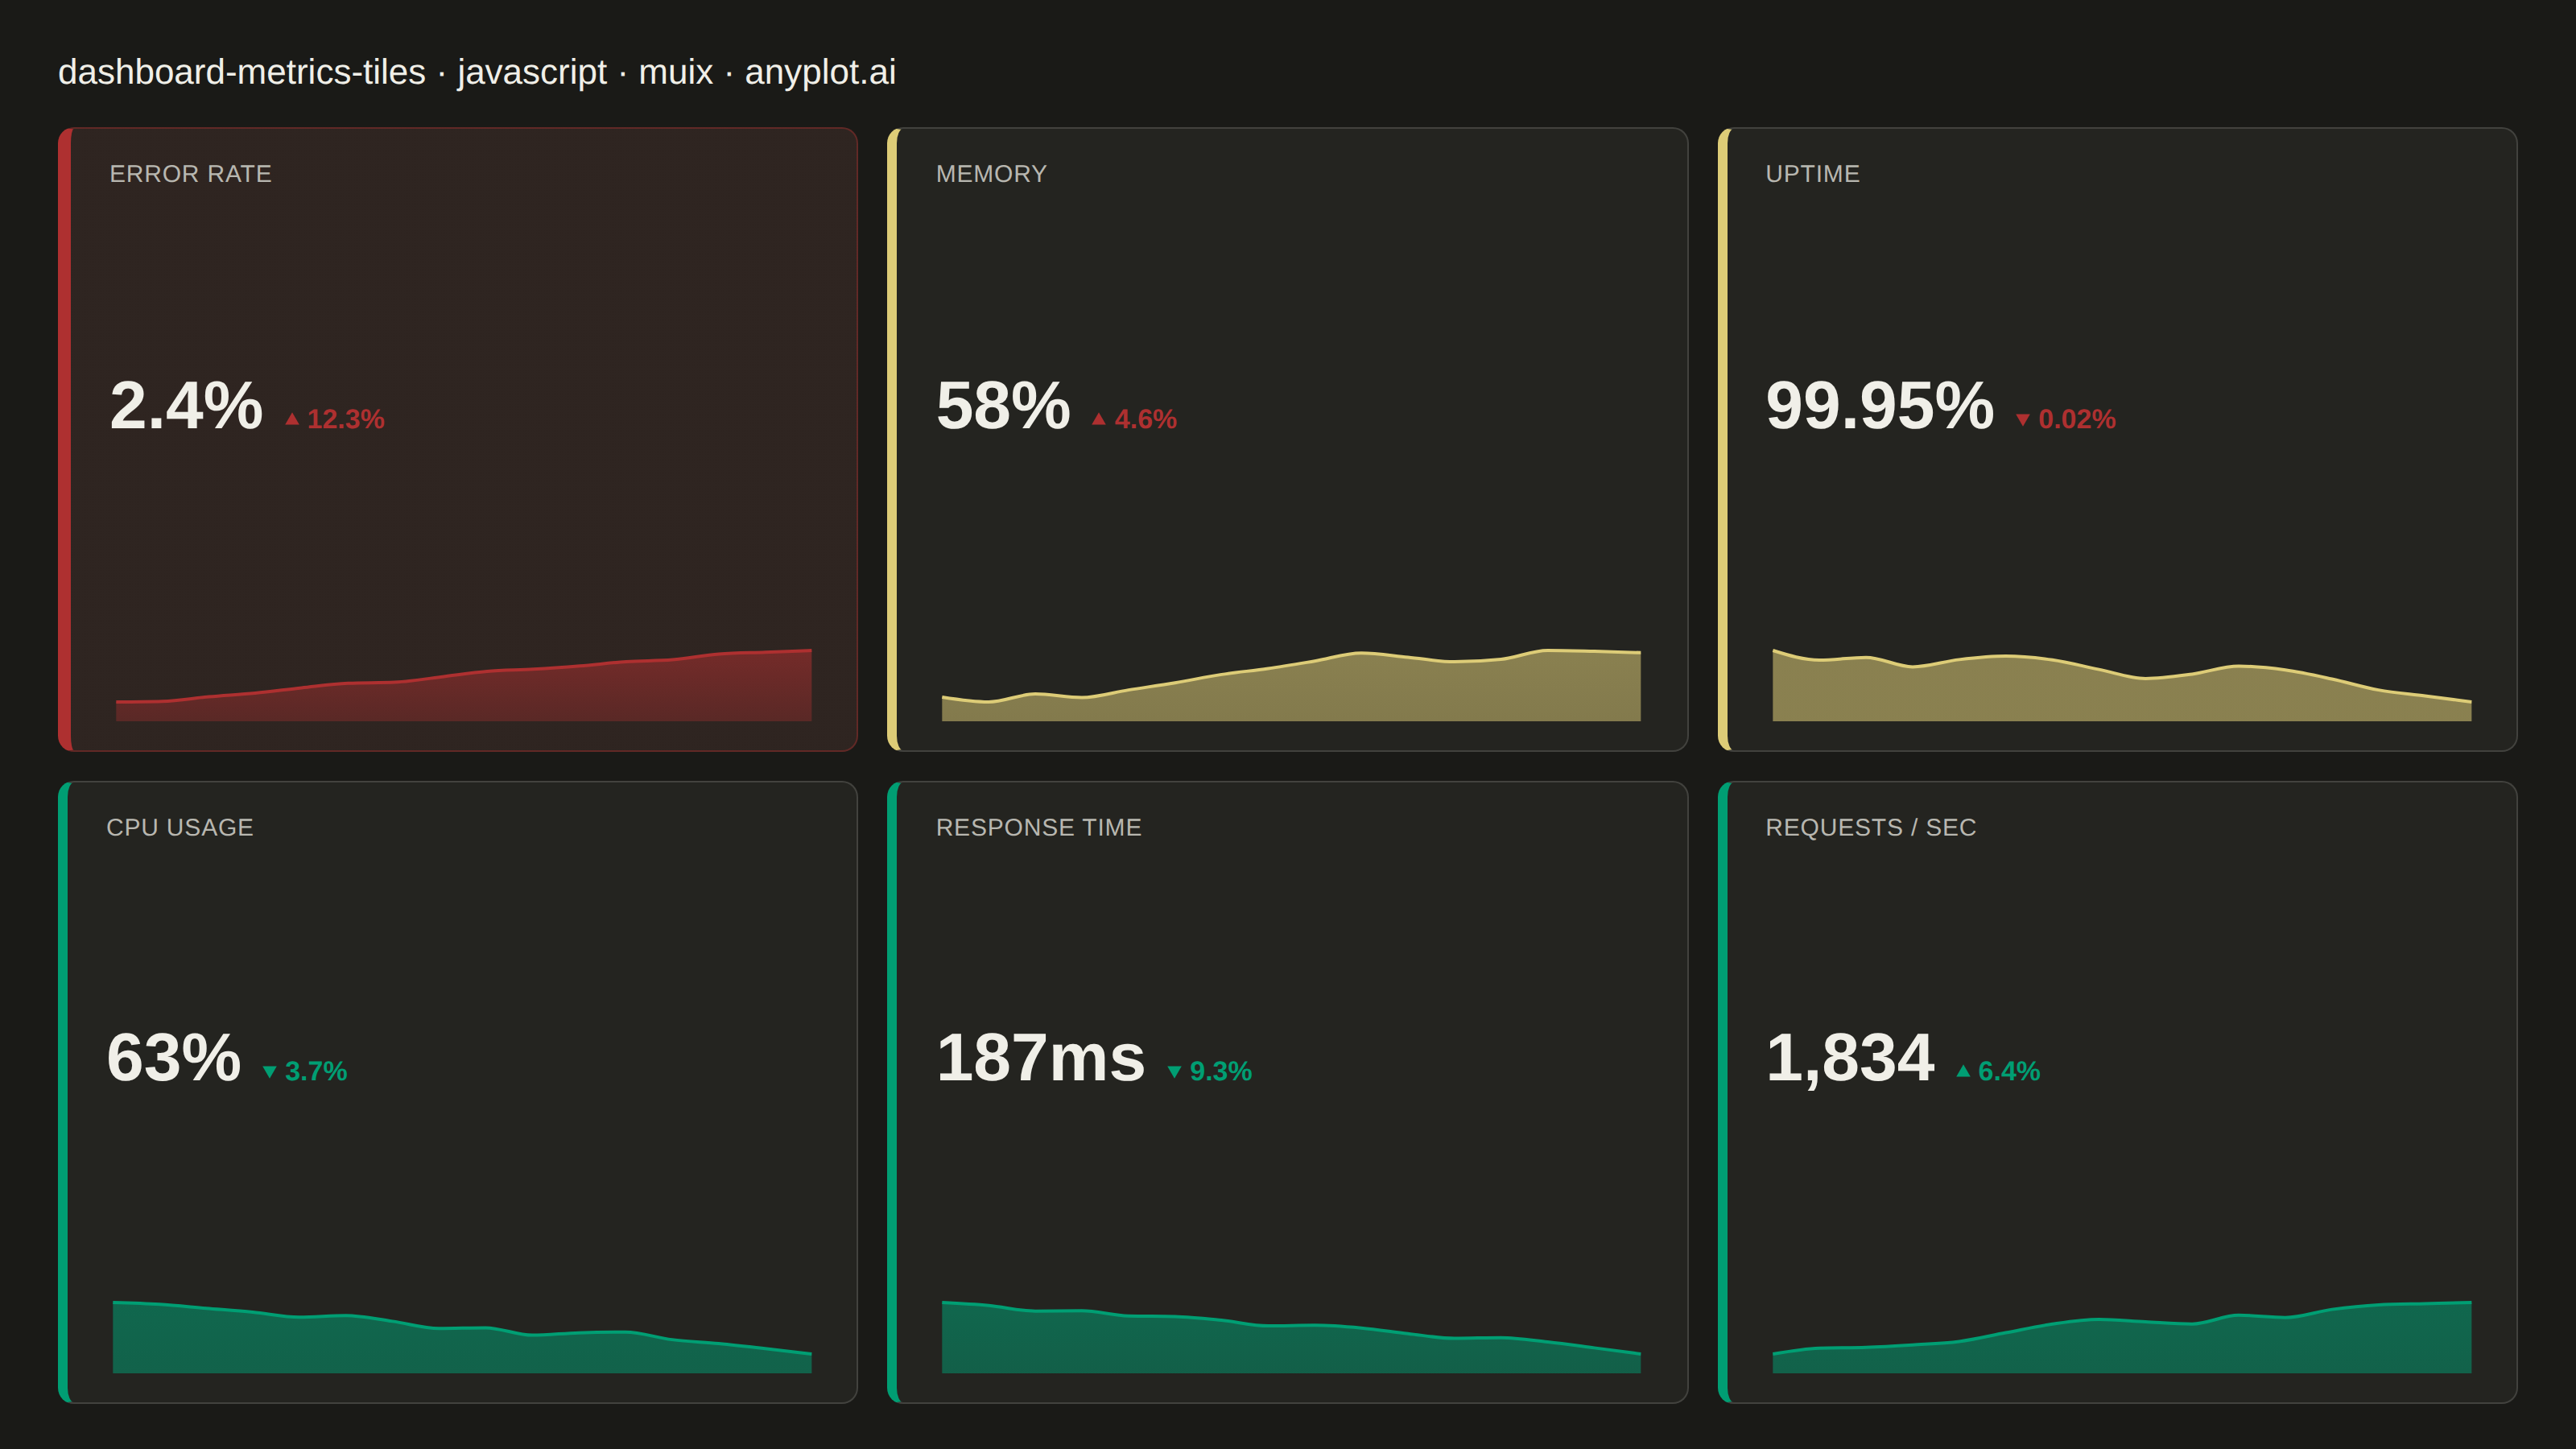
A dashboard layout displaying multiple metric tiles in a responsive grid, where each tile shows a KPI value with its label, an embedded sparkline showing recent trend, and a change indicator (up/down arrow with percentage). This visualization is essential for operations monitoring and business dashboards where multiple metrics need to be tracked simultaneously at a glance. The combination of current value, trend visualization, and change direction provides comprehensive metric context in a compact format.
// anyplot.ai
// dashboard-metrics-tiles: Real-Time Dashboard Tiles
// Library: muix 7.29.1 | JavaScript 22.23.2
// Quality: 94/100 | Created: 2026-09-02
import { Box, Typography } from "@mui/material";
import { SparkLineChart } from "@mui/x-charts/SparkLineChart";

const t = window.ANYPLOT_TOKENS;

// --- Data (in-memory, deterministic) ---------------------------------------
// Tiny LCG so the sparkline noise is reproducible without a browser RNG.
function lcg(seed) {
  let state = seed;
  return () => {
    state = (state * 1664525 + 1013904223) % 4294967296;
    return state / 4294967296;
  };
}

// Builds history backward from the current value so the sparkline always
// ends exactly on the tile's headline number, trending in the direction
// implied by trendPerStep.
function buildHistory(end, trendPerStep, noiseScale, seed, points = 16) {
  const rand = lcg(seed);
  const values = [end];
  let value = end;
  for (let i = 1; i < points; i += 1) {
    value -= trendPerStep + (rand() - 0.5) * noiseScale;
    values.unshift(Math.max(0, value));
  }
  return values;
}

const STATUS_COLOR = {
  good: t.palette[0],
  warning: t.amber,
  critical: t.palette[4],
};

// Higher-severity statuses sort first so the dashboard's eye-order surfaces
// the most urgent metric before the routine ones.
const SEVERITY_RANK = { critical: 0, warning: 1, good: 2 };

const RAW_METRICS = [
  {
    name: "CPU Usage",
    status: "good",
    increaseIsGood: false,
    changePercent: -3.7,
    currentValue: 63,
    format: (v) => `${v.toFixed(0)}%`,
    history: buildHistory(63, -0.16, 1.0, 11),
  },
  {
    name: "Memory",
    status: "warning",
    increaseIsGood: false,
    changePercent: 4.6,
    currentValue: 58,
    format: (v) => `${v.toFixed(0)}%`,
    history: buildHistory(58, 0.17, 1.0, 22),
  },
  {
    name: "Response Time",
    status: "good",
    increaseIsGood: false,
    changePercent: -9.3,
    currentValue: 187,
    format: (v) => `${v.toFixed(0)}ms`,
    history: buildHistory(187, -1.28, 4.0, 33),
  },
  {
    name: "Error Rate",
    status: "critical",
    increaseIsGood: false,
    changePercent: 12.3,
    currentValue: 2.4,
    format: (v) => `${v.toFixed(1)}%`,
    history: buildHistory(2.4, 0.045, 0.08, 44),
  },
  {
    name: "Requests / sec",
    status: "good",
    increaseIsGood: true,
    changePercent: 6.4,
    currentValue: 1834,
    format: (v) => v.toLocaleString("en-US", { maximumFractionDigits: 0 }),
    history: buildHistory(1834, 11, 35, 55),
  },
  {
    name: "Uptime",
    status: "warning",
    increaseIsGood: true,
    changePercent: -0.02,
    currentValue: 99.95,
    format: (v) => `${v.toFixed(2)}%`,
    history: buildHistory(99.95, -0.001, 0.015, 66),
  },
];

const metrics = [...RAW_METRICS].sort((a, b) => SEVERITY_RANK[a.status] - SEVERITY_RANK[b.status]);

function changeColor(metric) {
  const favorable = metric.changePercent > 0 === metric.increaseIsGood;
  return favorable ? t.palette[0] : t.palette[4];
}

// Small-magnitude metrics (e.g. uptime) need 2 decimals so a badge like the
// arrow direction never contradicts a percentage that rounded down to "0.0%".
function formatChangePercent(value) {
  const abs = Math.abs(value);
  return `${abs.toFixed(abs < 1 ? 2 : 1)}%`;
}

function hexToRgba(hex, alpha) {
  const value = hex.replace("#", "");
  const r = parseInt(value.slice(0, 2), 16);
  const g = parseInt(value.slice(2, 4), 16);
  const b = parseInt(value.slice(4, 6), 16);
  return `rgba(${r}, ${g}, ${b}, ${alpha})`;
}

// A crisp vector arrow (instead of a Unicode glyph) for the change badge.
function ChangeArrow({ up, color }) {
  return (
    <svg width="11" height="11" viewBox="0 0 10 10" style={{ display: "block", flexShrink: 0 }} aria-hidden="true">
      <path d={up ? "M5 1 L9 8 L1 8 Z" : "M5 9 L9 2 L1 2 Z"} fill={color} />
    </svg>
  );
}

// --- Sparkline area fill: a subtle top-to-bottom alpha fade instead of a ----
// flat opaque fill. One gradient per status is declared once (below) and
// referenced by each tile's SparkLineChart via the `area` slot.
const GRADIENT_IDS = {
  good: "spark-gradient-good",
  warning: "spark-gradient-warning",
  critical: "spark-gradient-critical",
};

function AreaGradientFill({ d, gradientId, className }) {
  return <path d={d} className={className} fill={`url(#${gradientId})`} stroke="none" />;
}

function SparklineGradientDefs() {
  return (
    <svg width={0} height={0} style={{ position: "absolute" }} aria-hidden="true">
      <defs>
        {Object.entries(STATUS_COLOR).map(([status, color]) => (
          <linearGradient key={status} id={GRADIENT_IDS[status]} x1="0" y1="0" x2="0" y2="1">
            <stop offset="0%" stopColor={color} stopOpacity={0.55} />
            <stop offset="100%" stopColor={color} stopOpacity={0.05} />
          </linearGradient>
        ))}
      </defs>
    </svg>
  );
}

// --- Tile --------------------------------------------------------------------

function MetricTile({ metric }) {
  const accent = STATUS_COLOR[metric.status];
  const isCritical = metric.status === "critical";
  const arrowUp = metric.changePercent > 0;
  const lo = Math.min(...metric.history);
  const hi = Math.max(...metric.history);
  const pad = (hi - lo) * 0.25 || hi * 0.05 || 1;

  return (
    <Box
      sx={{
        display: "flex",
        flexDirection: "column",
        justifyContent: "space-between",
        height: "100%",
        boxSizing: "border-box",
        borderRadius: "10px",
        border: `1px solid ${isCritical ? hexToRgba(accent, 0.4) : t.grid}`,
        borderLeft: `${isCritical ? 8 : 6}px solid ${accent}`,
        background: isCritical
          ? `linear-gradient(${hexToRgba(accent, 0.08)}, ${hexToRgba(accent, 0.08)}), ${t.elevatedBg}`
          : t.elevatedBg,
        padding: "18px 24px",
      }}
    >
      <Typography sx={{ fontSize: 15, fontWeight: 500, color: t.inkSoft, letterSpacing: "0.4px" }}>
        {metric.name.toUpperCase()}
      </Typography>

      <Box sx={{ display: "flex", alignItems: "baseline", gap: "12px", marginTop: "4px" }}>
        <Typography sx={{ fontSize: 42, fontWeight: 700, color: t.ink, lineHeight: 1 }}>
          {metric.format(metric.currentValue)}
        </Typography>
        <Box sx={{ display: "flex", alignItems: "center", gap: "4px" }}>
          <ChangeArrow up={arrowUp} color={changeColor(metric)} />
          <Typography sx={{ fontSize: 17, fontWeight: 600, color: changeColor(metric) }}>
            {formatChangePercent(metric.changePercent)}
          </Typography>
        </Box>
      </Box>

      <Box sx={{ height: 60, marginTop: "8px" }}>
        <SparkLineChart
          data={metric.history}
          yAxis={{ min: lo - pad, max: hi + pad }}
          colors={[accent]}
          area
          curve="monotoneX"
          showHighlight
          skipAnimation
          resolveSizeBeforeRender
          height={60}
          margin={{ top: 8, bottom: 4, left: 4, right: 4 }}
          slots={{ area: AreaGradientFill }}
          slotProps={{ area: { gradientId: GRADIENT_IDS[metric.status] } }}
        />
      </Box>
    </Box>
  );
}

// --- Dashboard (default-exported component — the harness mounts it) --------

export default function Chart() {
  return (
    <Box
      sx={{
        width: window.ANYPLOT_SIZE.width,
        height: window.ANYPLOT_SIZE.height,
        boxSizing: "border-box",
        backgroundColor: t.pageBg,
        padding: "28px 36px",
        display: "flex",
        flexDirection: "column",
        gap: "18px",
      }}
    >
      <SparklineGradientDefs />

      <Typography sx={{ fontSize: 22, fontWeight: 500, color: t.ink }}>
        dashboard-metrics-tiles · javascript · muix · anyplot.ai
      </Typography>

      <Box
        sx={{
          flex: 1,
          display: "grid",
          gridTemplateColumns: "repeat(3, 1fr)",
          gridTemplateRows: "repeat(2, 1fr)",
          gap: "18px",
        }}
      >
        {metrics.map((metric) => (
          <MetricTile key={metric.name} metric={metric} />
        ))}
      </Box>
    </Box>
  );
}
Runnable source as JSON, for any HTTP client: https://api.anyplot.ai/specs/dashboard-metrics-tiles/muix/code. Any spec id and library id listed in llms-full.txt fit the same URL shape; every URL below is complete and callable.
{
  "spec_id": "dashboard-metrics-tiles",
  "language": "javascript",
  "library": "muix",
  "page": "https://anyplot.ai/dashboard-metrics-tiles/javascript/muix",
  "hub": "https://anyplot.ai/dashboard-metrics-tiles",
  "code_json": "https://api.anyplot.ai/specs/dashboard-metrics-tiles/muix/code",
  "spec_json": "https://api.anyplot.ai/specs/dashboard-metrics-tiles",
  "render_light_png": "https://storage.googleapis.com/anyplot-images/plots/dashboard-metrics-tiles/javascript/muix/plot-light.png",
  "render_dark_png": "https://storage.googleapis.com/anyplot-images/plots/dashboard-metrics-tiles/javascript/muix/plot-dark.png",
  "interactive_light_html": "https://storage.googleapis.com/anyplot-images/plots/dashboard-metrics-tiles/javascript/muix/plot-light.html",
  "interactive_dark_html": "https://storage.googleapis.com/anyplot-images/plots/dashboard-metrics-tiles/javascript/muix/plot-dark.html",
  "quality_score": 94.0,
  "license": "MIT",
  "guide": "https://anyplot.ai/llms.txt"
}
Part of Real-Time Dashboard Tiles on anyplot.ai.