The same plot in 14 other libraries — JavaScript: Chart.js, D3.js, Highcharts, MUI X Charts; Python: Altair, Bokeh, lets-plot, Matplotlib, Plotly, plotnine, Pygal, Seaborn; R: ggplot2; Julia: Makie.jl. Compare all 15 side by side: Real-Time Dashboard Tiles in Python, R, Julia and JavaScript.
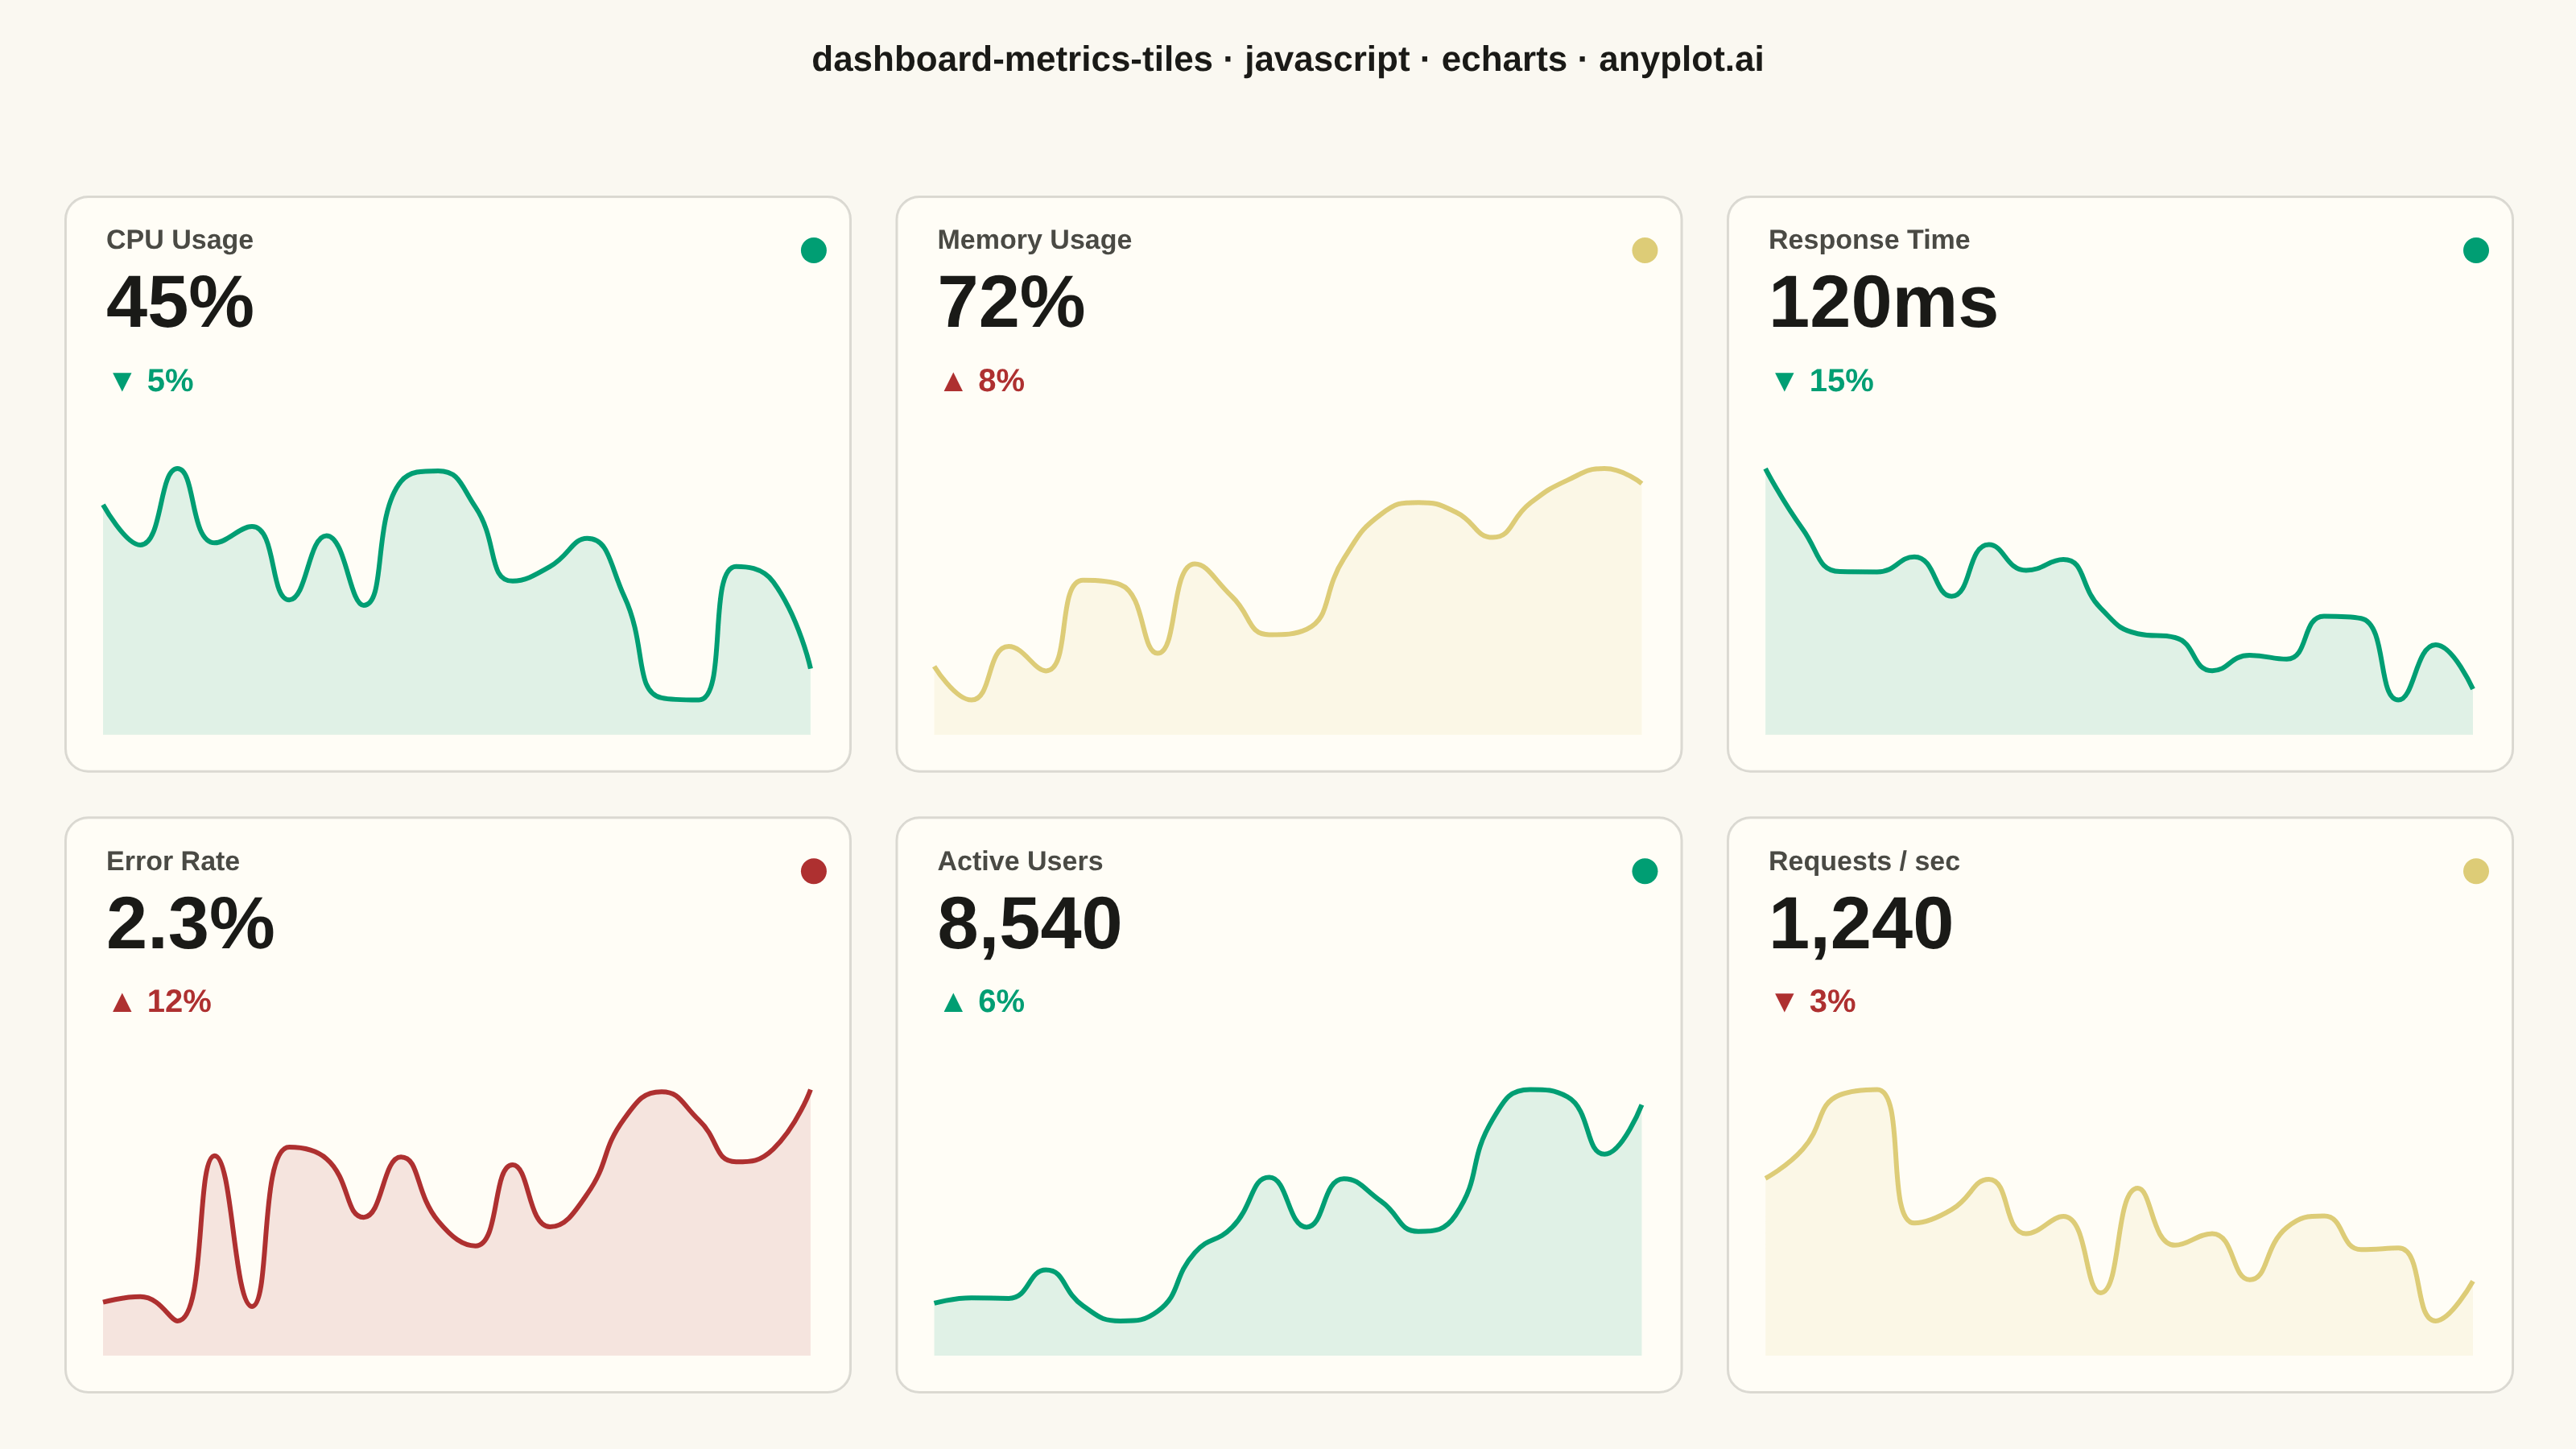
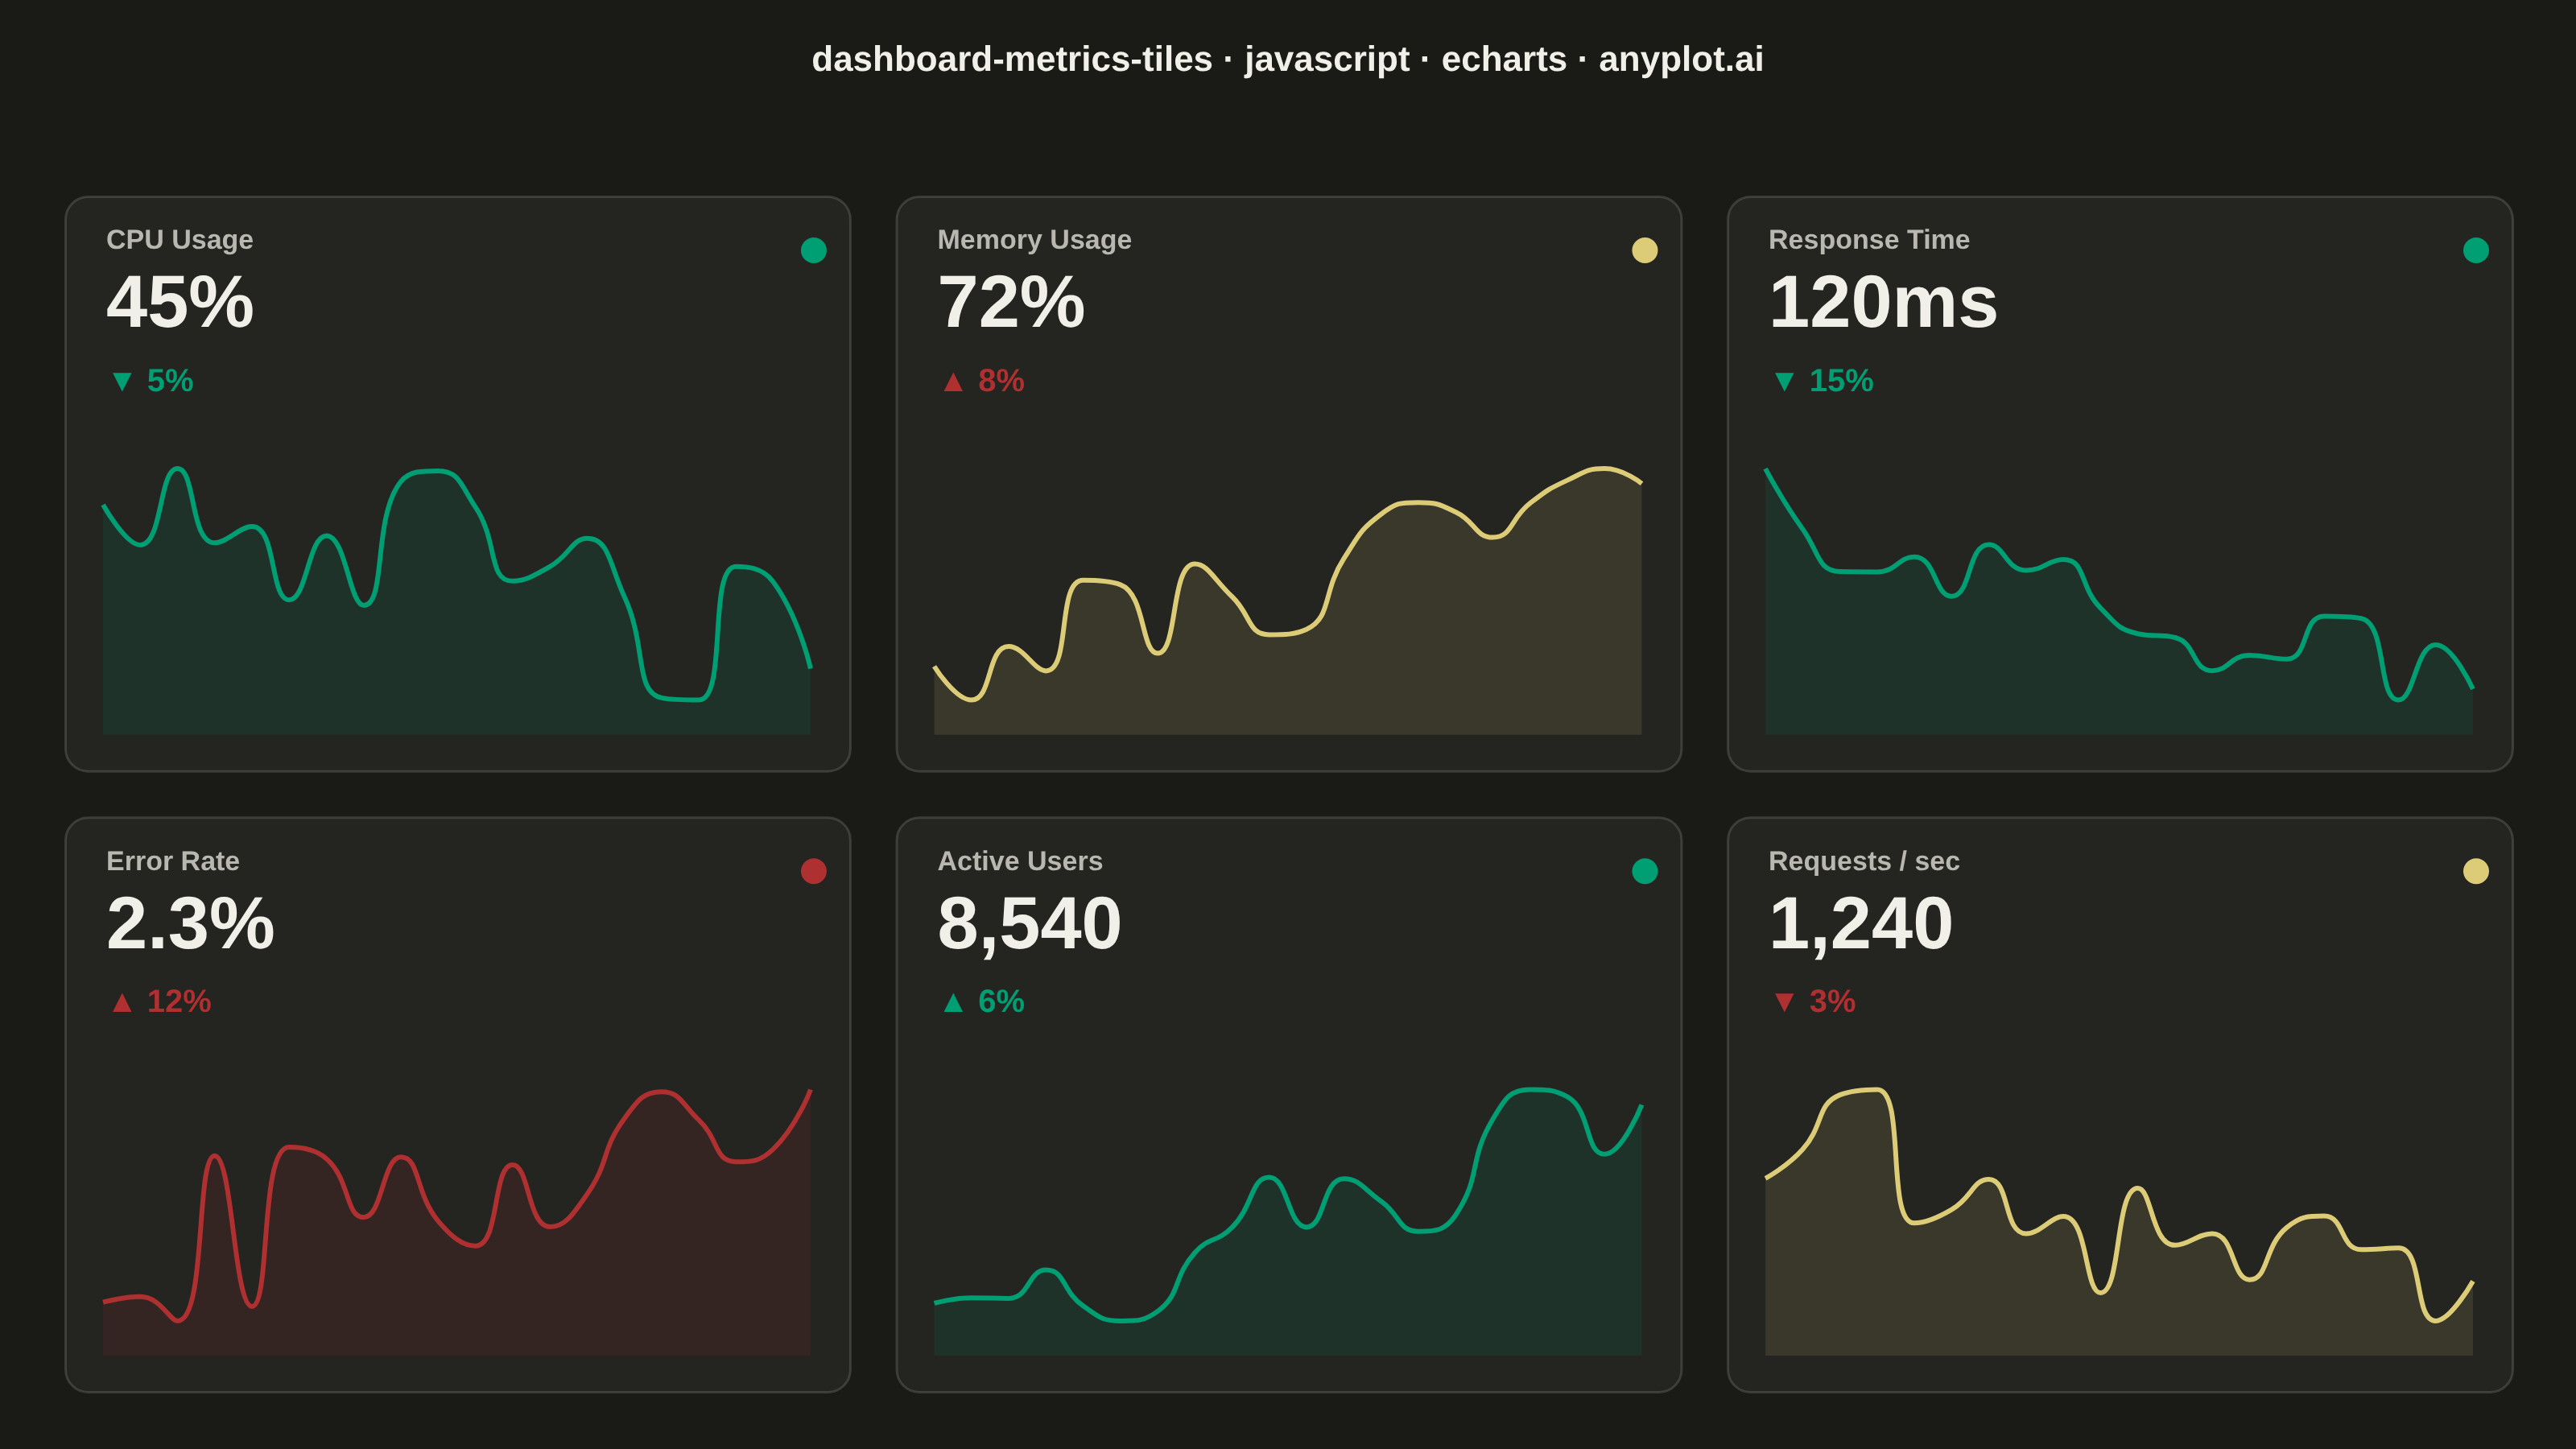
A dashboard layout displaying multiple metric tiles in a responsive grid, where each tile shows a KPI value with its label, an embedded sparkline showing recent trend, and a change indicator (up/down arrow with percentage). This visualization is essential for operations monitoring and business dashboards where multiple metrics need to be tracked simultaneously at a glance. The combination of current value, trend visualization, and change direction provides comprehensive metric context in a compact format.
// anyplot.ai
// dashboard-metrics-tiles: Real-Time Dashboard Tiles
// Library: echarts 6.1.0 | JavaScript 22.23.2
// Quality: 90/100 | Created: 2026-09-02

const t = window.ANYPLOT_TOKENS;
const size = window.ANYPLOT_SIZE;

// --- Data (in-memory, deterministic) ----------------------------------------
// Tiny LCG so sparklines look like real telemetry without a network fetch.
let seed = 42;
function nextRandom() {
  seed = (seed * 1664525 + 1013904223) % 4294967296;
  return seed / 4294967296;
}

function makeHistory(start, end, points, noise) {
  const values = [];
  for (let i = 0; i < points; i += 1) {
    const progress = i / (points - 1);
    const base = start + (end - start) * progress;
    const jitter = (nextRandom() - 0.5) * 2 * noise;
    values.push(Math.max(0, base + jitter));
  }
  values[values.length - 1] = end;
  return values;
}

// status: "good" | "warning" | "critical" — overall health of the metric.
// higherIsBetter: whether a rising value is the favorable direction.
const metrics = [
  {
    name: "CPU Usage",
    value: 45,
    unit: "%",
    changePercent: -5,
    status: "good",
    higherIsBetter: false,
    history: makeHistory(52, 45, 20, 3),
  },
  {
    name: "Memory Usage",
    value: 72,
    unit: "%",
    changePercent: 8,
    status: "warning",
    higherIsBetter: false,
    history: makeHistory(64, 72, 20, 2.5),
  },
  {
    name: "Response Time",
    value: 120,
    unit: "ms",
    changePercent: -15,
    status: "good",
    higherIsBetter: false,
    history: makeHistory(142, 120, 20, 6),
  },
  {
    name: "Error Rate",
    value: 2.3,
    unit: "%",
    changePercent: 12,
    status: "critical",
    higherIsBetter: false,
    history: makeHistory(2.0, 2.3, 20, 0.15),
  },
  {
    name: "Active Users",
    value: 8540,
    unit: "",
    changePercent: 6,
    status: "good",
    higherIsBetter: true,
    history: makeHistory(8020, 8540, 20, 120),
  },
  {
    name: "Requests / sec",
    value: 1240,
    unit: "",
    changePercent: -3,
    status: "warning",
    higherIsBetter: true,
    history: makeHistory(1280, 1240, 20, 25),
  },
];

const STATUS_COLOR = {
  good: t.palette[0], // #009E73 brand green
  warning: t.amber, // #DDCC77
  critical: t.palette[4], // #AE3030 matte red
};

function formatValue(m) {
  const rounded = Number.isInteger(m.value) ? m.value : Math.round(m.value * 10) / 10;
  const grouped = rounded.toLocaleString("en-US");
  return `${grouped}${m.unit}`;
}

function isFavorable(m) {
  return m.higherIsBetter ? m.changePercent > 0 : m.changePercent < 0;
}

// --- Layout -------------------------------------------------------------
const cols = 3;
const rows = 2;
const outerX = size.width * 0.025;
const outerTop = size.height * 0.135;
const outerBottom = size.height * 0.04;
const gutter = size.width * 0.018;

const gridAreaWidth = size.width - 2 * outerX;
const gridAreaHeight = size.height - outerTop - outerBottom;
const tileWidth = (gridAreaWidth - (cols - 1) * gutter) / cols;
const tileHeight = (gridAreaHeight - (rows - 1) * gutter) / rows;

const grids = [];
const xAxes = [];
const yAxes = [];
const series = [];
const graphics = [];

metrics.forEach((m, i) => {
  const col = i % cols;
  const row = Math.floor(i / cols);
  const tileX = outerX + col * (tileWidth + gutter);
  const tileY = outerTop + row * (tileHeight + gutter);
  const statusColor = STATUS_COLOR[m.status];
  const changeColor = isFavorable(m) ? t.palette[0] : t.palette[4];
  const arrow = m.changePercent >= 0 ? "▲" : "▼";

  // Card background
  graphics.push({
    type: "rect",
    left: tileX,
    top: tileY,
    shape: { width: tileWidth, height: tileHeight, r: 14 },
    style: { fill: t.elevatedBg, stroke: t.grid, lineWidth: 1.5 },
    z: 1,
  });

  // Status dot
  graphics.push({
    type: "circle",
    left: tileX + tileWidth - 30,
    top: tileY + 26,
    shape: { r: 8 },
    style: { fill: statusColor },
    z: 2,
  });

  // Metric label
  graphics.push({
    type: "text",
    left: tileX + 26,
    top: tileY + 20,
    style: {
      text: m.name,
      fill: t.inkSoft,
      font: "600 17px sans-serif",
    },
    z: 2,
  });

  // Big value
  graphics.push({
    type: "text",
    left: tileX + 26,
    top: tileY + 46,
    style: {
      text: formatValue(m),
      fill: t.ink,
      font: "700 46px sans-serif",
    },
    z: 2,
  });

  // Change indicator
  graphics.push({
    type: "text",
    left: tileX + 26,
    top: tileY + 106,
    style: {
      text: `${arrow} ${Math.abs(m.changePercent)}%`,
      fill: changeColor,
      font: "600 20px sans-serif",
    },
    z: 2,
  });

  // Sparkline grid (fills the remaining tile space below the change indicator)
  const sparkTop = tileY + 148;
  const sparkHeight = tileHeight - 148 - 22;
  grids.push({
    left: tileX + 24,
    top: sparkTop,
    width: tileWidth - 48,
    height: sparkHeight,
  });
  xAxes.push({
    type: "category",
    gridIndex: i,
    show: false,
    boundaryGap: false,
    data: m.history.map((_, idx) => idx),
  });
  yAxes.push({
    type: "value",
    gridIndex: i,
    show: false,
    min: (val) => val.min - (val.max - val.min) * 0.15,
    max: (val) => val.max + (val.max - val.min) * 0.15,
  });
  series.push({
    type: "line",
    gridIndex: i,
    xAxisIndex: i,
    yAxisIndex: i,
    data: m.history,
    showSymbol: false,
    smooth: true,
    lineStyle: { color: statusColor, width: 3 },
    areaStyle: { color: statusColor, opacity: 0.12 },
  });
});

// --- Init ---------------------------------------------------------------
const chart = echarts.init(document.getElementById("container"));

// --- Option ---------------------------------------------------------------
chart.setOption({
  animation: false,
  backgroundColor: "transparent",
  title: {
    text: "dashboard-metrics-tiles · javascript · echarts · anyplot.ai",
    left: "center",
    top: 22,
    textStyle: { color: t.ink, fontSize: 22 },
  },
  grid: grids,
  xAxis: xAxes,
  yAxis: yAxes,
  series,
  graphic: graphics,
});
Runnable source as JSON, for any HTTP client: https://api.anyplot.ai/specs/dashboard-metrics-tiles/echarts/code. Any spec id and library id listed in llms-full.txt fit the same URL shape; every URL below is complete and callable.
{
  "spec_id": "dashboard-metrics-tiles",
  "language": "javascript",
  "library": "echarts",
  "page": "https://anyplot.ai/dashboard-metrics-tiles/javascript/echarts",
  "hub": "https://anyplot.ai/dashboard-metrics-tiles",
  "code_json": "https://api.anyplot.ai/specs/dashboard-metrics-tiles/echarts/code",
  "spec_json": "https://api.anyplot.ai/specs/dashboard-metrics-tiles",
  "render_light_png": "https://storage.googleapis.com/anyplot-images/plots/dashboard-metrics-tiles/javascript/echarts/plot-light.png",
  "render_dark_png": "https://storage.googleapis.com/anyplot-images/plots/dashboard-metrics-tiles/javascript/echarts/plot-dark.png",
  "interactive_light_html": "https://storage.googleapis.com/anyplot-images/plots/dashboard-metrics-tiles/javascript/echarts/plot-light.html",
  "interactive_dark_html": "https://storage.googleapis.com/anyplot-images/plots/dashboard-metrics-tiles/javascript/echarts/plot-dark.html",
  "quality_score": 90.0,
  "license": "MIT",
  "guide": "https://anyplot.ai/llms.txt"
}
Part of Real-Time Dashboard Tiles on anyplot.ai.