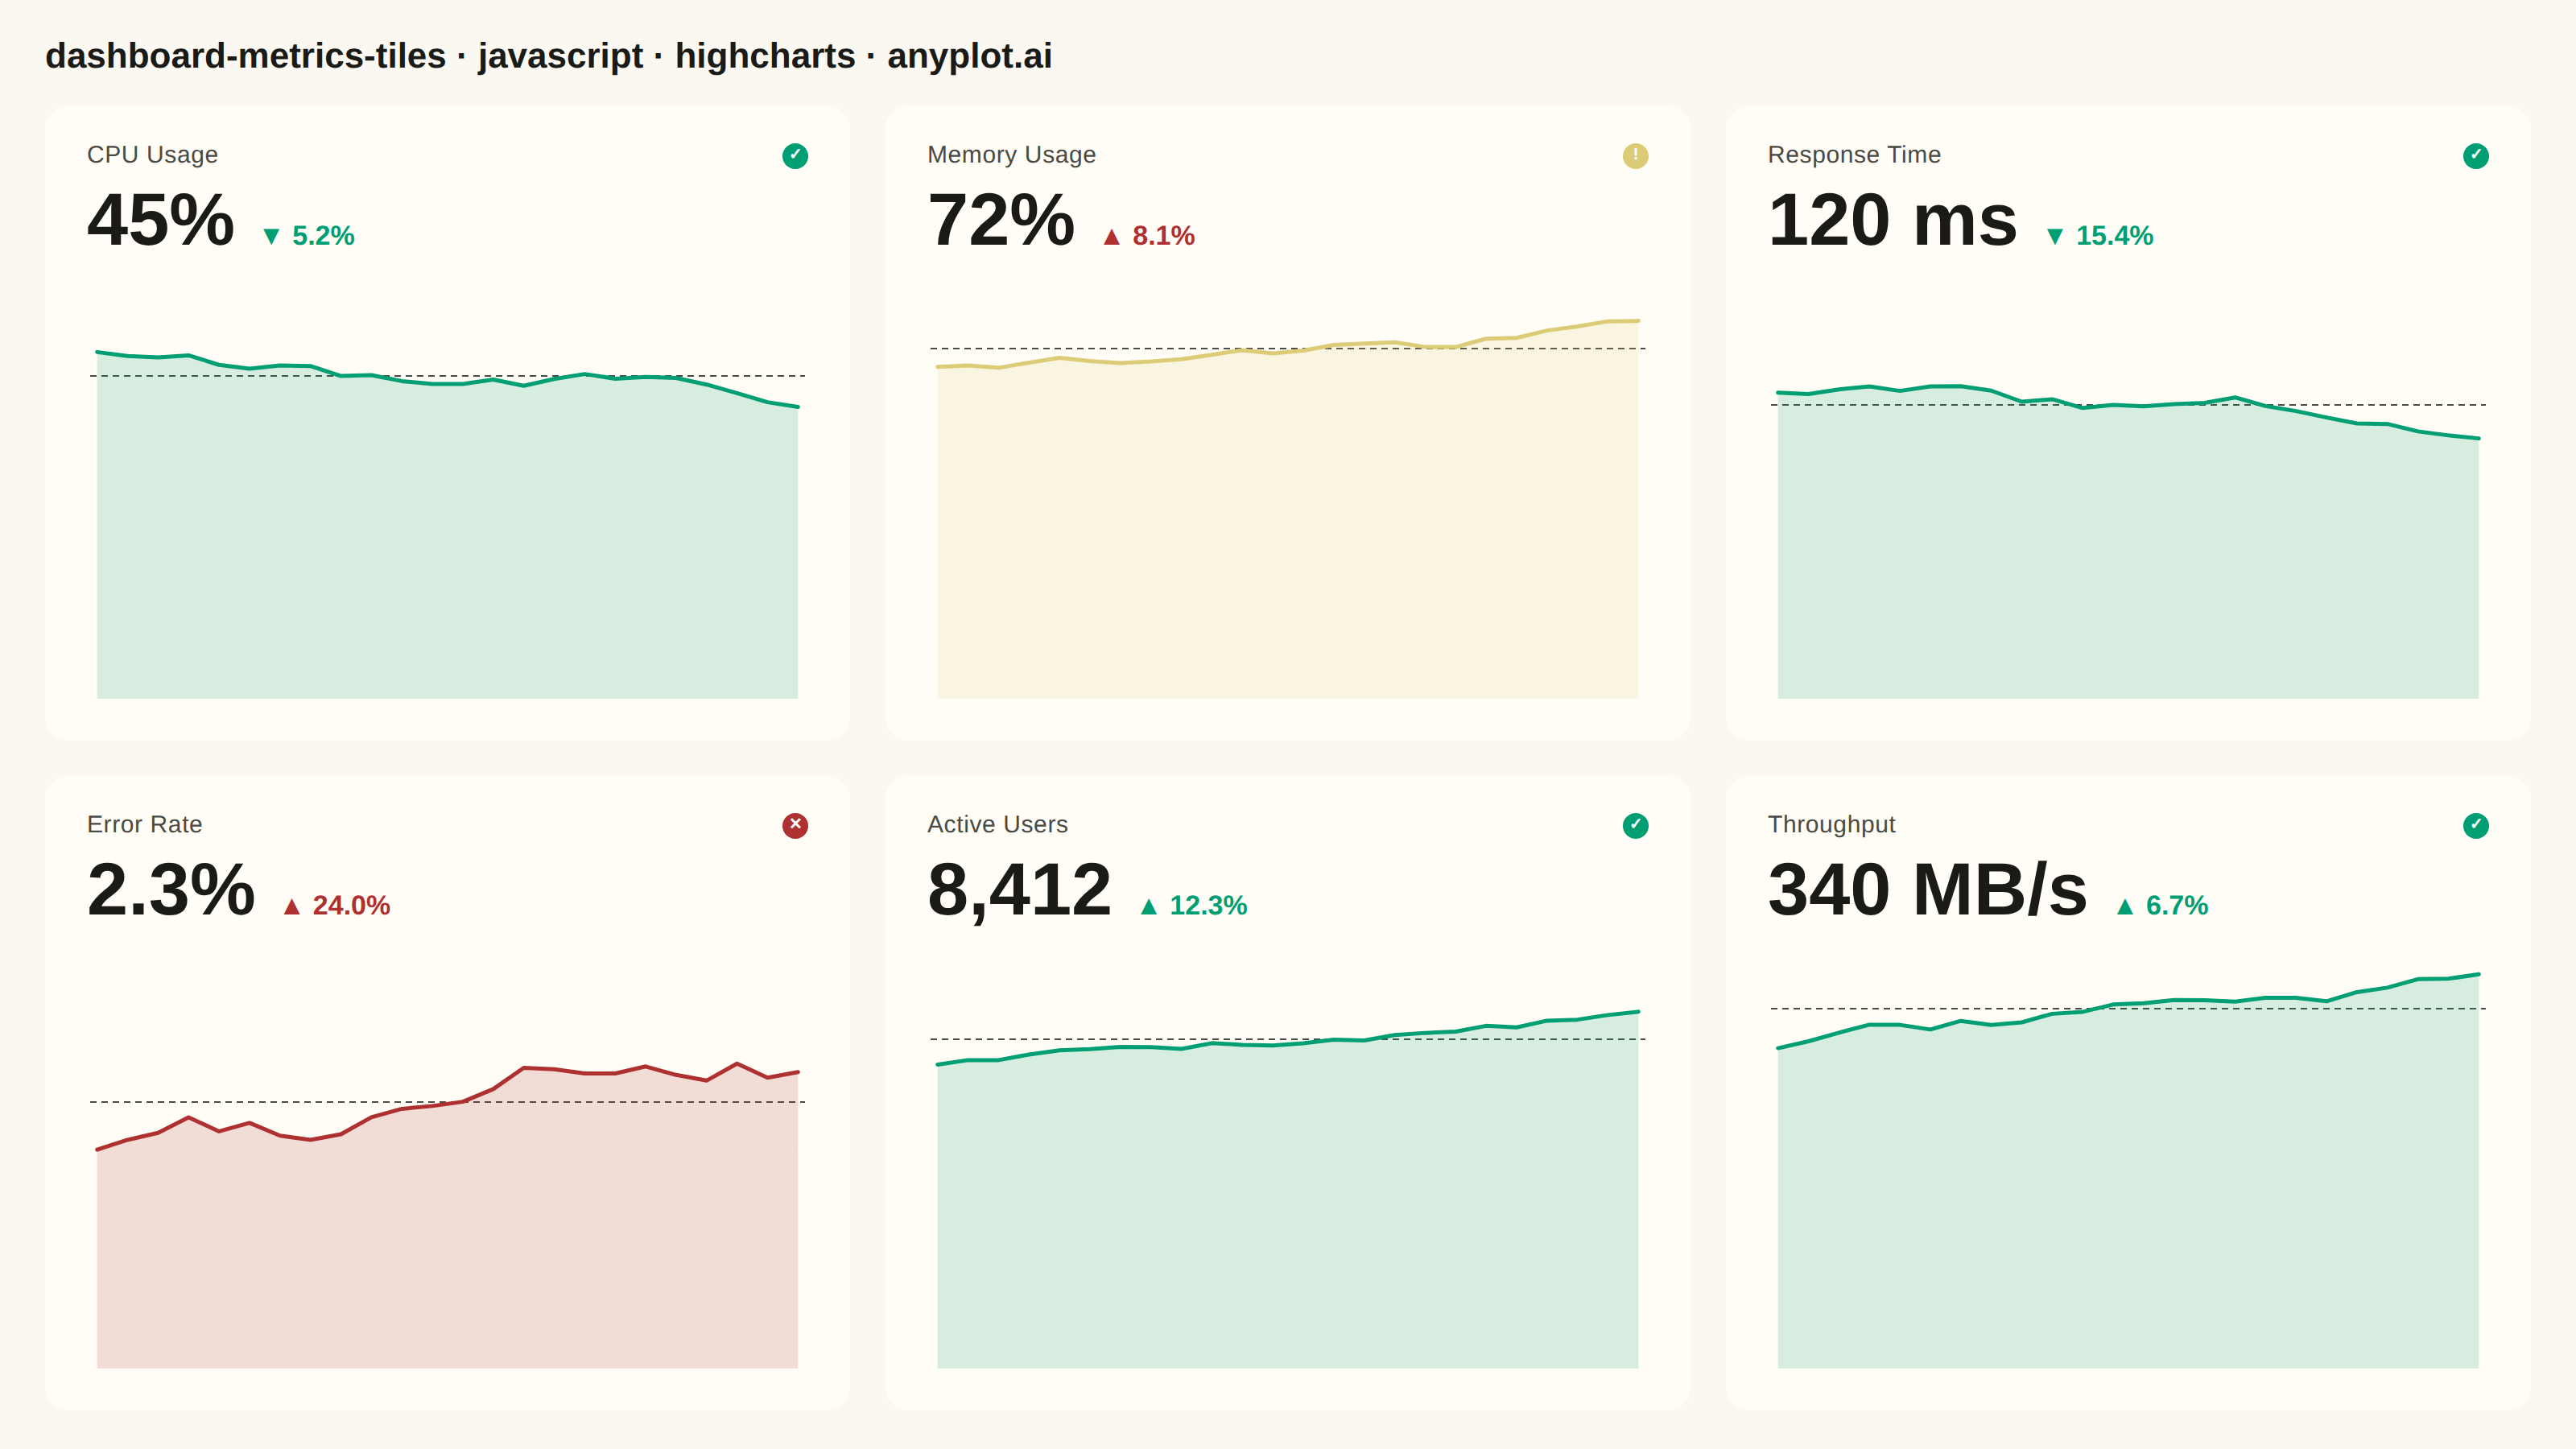
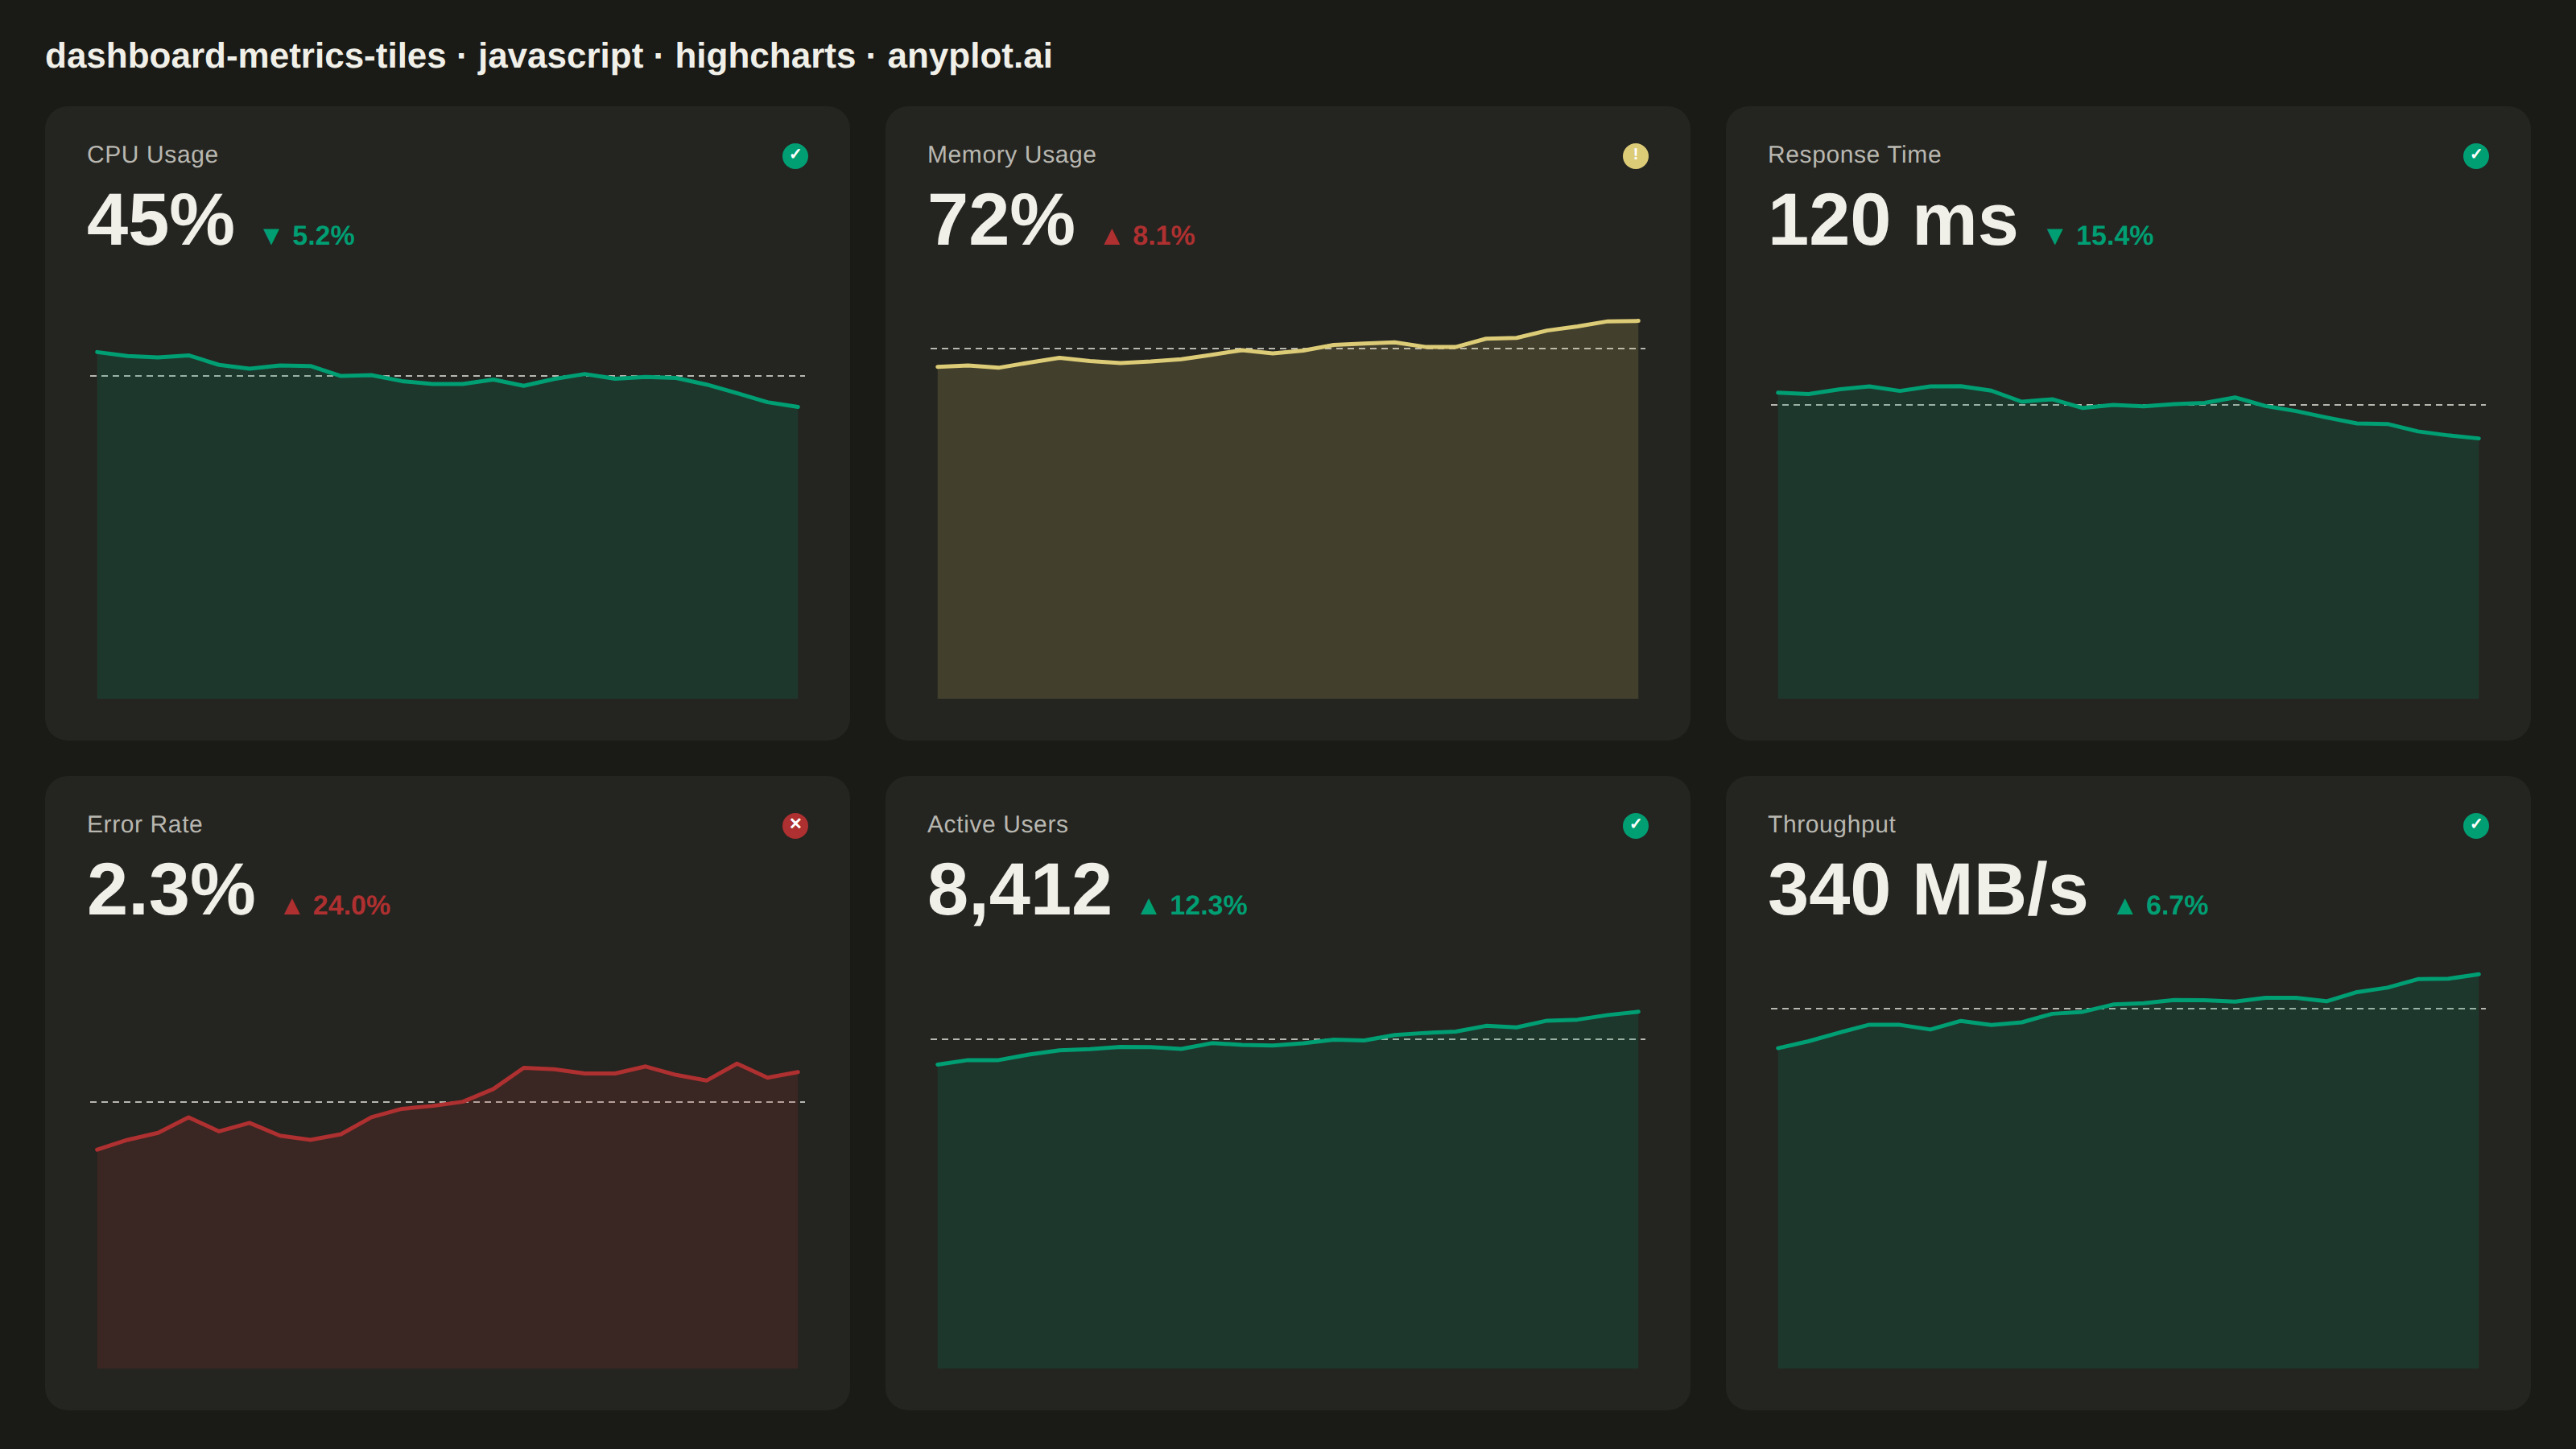
The same plot in 14 other libraries — JavaScript: Chart.js, D3.js, Apache ECharts, MUI X Charts; Python: Altair, Bokeh, lets-plot, Matplotlib, Plotly, plotnine, Pygal, Seaborn; R: ggplot2; Julia: Makie.jl. Compare all 15 side by side: Real-Time Dashboard Tiles in Python, R, Julia and JavaScript.
A dashboard layout displaying multiple metric tiles in a responsive grid, where each tile shows a KPI value with its label, an embedded sparkline showing recent trend, and a change indicator (up/down arrow with percentage). This visualization is essential for operations monitoring and business dashboards where multiple metrics need to be tracked simultaneously at a glance. The combination of current value, trend visualization, and change direction provides comprehensive metric context in a compact format.
// anyplot.ai
// dashboard-metrics-tiles: Real-Time Dashboard Tiles
// Library: highcharts 12.6.0 | JavaScript 22.23.2
// Quality: 91/100 | Created: 2026-09-02

const t = window.ANYPLOT_TOKENS;

// --- Data (in-memory, deterministic LCG — no seeded RNG in the browser) ----
function lcg(seed) {
  let s = seed;
  return () => {
    s = (s * 1664525 + 1013904223) % 4294967296;
    return s / 4294967296;
  };
}

function history(seed, n, base, trend, noiseFrac) {
  const rand = lcg(seed);
  const values = [];
  let v = base;
  for (let i = 0; i < n; i++) {
    v += trend + (rand() - 0.5) * base * noiseFrac;
    values.push(Math.max(0, Math.round(v * 100) / 100));
  }
  return values;
}

const STATUS_COLOR = { good: t.palette[0], warning: t.amber, critical: t.palette[4] };
const STATUS_GLYPH = { good: "✓", warning: "!", critical: "✕" };

function mean(values) {
  return values.reduce((sum, v) => sum + v, 0) / values.length;
}

const tiles = [
  {
    label: "CPU Usage",
    value: "45%",
    changePercent: -5.2,
    favorableDirection: "down",
    status: "good",
    history: history(1, 24, 50, -0.22, 0.05),
  },
  {
    label: "Memory Usage",
    value: "72%",
    changePercent: 8.1,
    favorableDirection: "down",
    status: "warning",
    history: history(2, 24, 63, 0.36, 0.04),
  },
  {
    label: "Response Time",
    value: "120 ms",
    changePercent: -15.4,
    favorableDirection: "down",
    status: "good",
    history: history(3, 24, 148, -1.1, 0.06),
  },
  {
    label: "Error Rate",
    value: "2.3%",
    changePercent: 24.0,
    favorableDirection: "down",
    status: "critical",
    history: history(4, 24, 1.6, 0.028, 0.18),
  },
  {
    label: "Active Users",
    value: "8,412",
    changePercent: 12.3,
    favorableDirection: "up",
    status: "good",
    history: history(5, 24, 7180, 55, 0.03),
  },
  {
    label: "Throughput",
    value: "340 MB/s",
    changePercent: 6.7,
    favorableDirection: "up",
    status: "good",
    history: history(6, 24, 305, 1.6, 0.05),
  },
];

// --- Layout (dashboard grid built as DOM, sparklines rendered by Highcharts) --
const root = document.getElementById("container");

const header = document.createElement("div");
header.style.cssText = `padding:22px 28px 4px; font-size:22px; font-weight:600; color:${t.ink}; font-family:inherit;`;
header.textContent = "dashboard-metrics-tiles · javascript · highcharts · anyplot.ai";
root.appendChild(header);

const grid = document.createElement("div");
grid.style.cssText =
  "display:grid; grid-template-columns:repeat(3, 1fr); grid-template-rows:repeat(2, 1fr); " +
  "gap:22px; margin:14px 28px 28px; height:calc(100% - 90px);";
root.appendChild(grid);

tiles.forEach((tile, index) => {
  const statusColor = STATUS_COLOR[tile.status];
  const isFavorable =
    (tile.favorableDirection === "down" && tile.changePercent < 0) ||
    (tile.favorableDirection === "up" && tile.changePercent > 0);
  const changeColor = isFavorable ? t.palette[0] : t.palette[4];
  const arrow = tile.changePercent >= 0 ? "▲" : "▼";

  const card = document.createElement("div");
  card.style.cssText = `background:${t.elevatedBg}; border-radius:14px; padding:22px 26px; display:flex; flex-direction:column; justify-content:flex-start;`;

  const headerRow = document.createElement("div");
  headerRow.style.cssText = "display:flex; align-items:center; justify-content:space-between;";
  const labelEl = document.createElement("span");
  labelEl.textContent = tile.label;
  labelEl.style.cssText = `font-size:15px; font-weight:500; color:${t.inkSoft}; letter-spacing:0.02em;`;
  const dotEl = document.createElement("span");
  dotEl.textContent = STATUS_GLYPH[tile.status];
  dotEl.title = tile.status;
  dotEl.style.cssText = `width:16px; height:16px; border-radius:50%; background:${statusColor}; display:inline-flex; align-items:center; justify-content:center; font-size:10px; font-weight:700; line-height:1; color:#FFFFFF;`;
  headerRow.appendChild(labelEl);
  headerRow.appendChild(dotEl);

  const valueRow = document.createElement("div");
  valueRow.style.cssText = "display:flex; align-items:baseline; gap:14px; margin-top:8px;";
  const valueEl = document.createElement("span");
  valueEl.textContent = tile.value;
  valueEl.style.cssText = `font-size:46px; font-weight:700; color:${t.ink}; line-height:1;`;
  const changeEl = document.createElement("span");
  changeEl.textContent = `${arrow} ${Math.abs(tile.changePercent).toFixed(1)}%`;
  changeEl.style.cssText = `font-size:17px; font-weight:600; color:${changeColor};`;
  valueRow.appendChild(valueEl);
  valueRow.appendChild(changeEl);

  const sparkEl = document.createElement("div");
  sparkEl.id = `spark-${index}`;
  sparkEl.style.cssText = "flex:1; min-height:64px; margin-top:8px;";

  card.appendChild(headerRow);
  card.appendChild(valueRow);
  card.appendChild(sparkEl);
  grid.appendChild(card);
});

// --- Sparkline charts (one Highcharts instance per tile, mounted after the DOM
//     nodes above are attached so Highcharts can measure each mount's size) ----
tiles.forEach((tile, index) => {
  const statusColor = STATUS_COLOR[tile.status];
  const baseline = mean(tile.history);
  Highcharts.chart(`spark-${index}`, {
    chart: {
      type: "area",
      backgroundColor: "transparent",
      animation: false,
      margin: [4, 2, 4, 2],
    },
    credits: { enabled: false },
    title: { text: null },
    xAxis: { visible: false },
    // Distinctive Highcharts touch: a dashed baseline plotLine (period mean)
    // showing trend-vs-baseline context, not just the raw sparkline. `visible`
    // must stay true (default) — Highcharts only wires up plotLines during
    // Axis#render(), which the chart skips entirely for axes marked
    // visible:false — so the chrome is stripped by hand instead.
    yAxis: {
      lineWidth: 0,
      gridLineWidth: 0,
      tickLength: 0,
      labels: { enabled: false },
      title: { text: null },
      plotLines: [
        {
          value: baseline,
          color: t.inkSoft,
          width: 1,
          dashStyle: "Dash",
          zIndex: 3,
        },
      ],
    },
    legend: { enabled: false },
    tooltip: { enabled: false },
    plotOptions: {
      series: {
        animation: false,
        enableMouseTracking: false,
        marker: { enabled: false },
        lineWidth: 2.5,
      },
      area: { fillOpacity: 0.16 },
    },
    series: [{ data: tile.history, color: statusColor }],
  });
});
Runnable source as JSON, for any HTTP client: https://api.anyplot.ai/specs/dashboard-metrics-tiles/highcharts/code. Any spec id and library id listed in llms-full.txt fit the same URL shape; every URL below is complete and callable.
{
  "spec_id": "dashboard-metrics-tiles",
  "language": "javascript",
  "library": "highcharts",
  "page": "https://anyplot.ai/dashboard-metrics-tiles/javascript/highcharts",
  "hub": "https://anyplot.ai/dashboard-metrics-tiles",
  "code_json": "https://api.anyplot.ai/specs/dashboard-metrics-tiles/highcharts/code",
  "spec_json": "https://api.anyplot.ai/specs/dashboard-metrics-tiles",
  "render_light_png": "https://storage.googleapis.com/anyplot-images/plots/dashboard-metrics-tiles/javascript/highcharts/plot-light.png",
  "render_dark_png": "https://storage.googleapis.com/anyplot-images/plots/dashboard-metrics-tiles/javascript/highcharts/plot-dark.png",
  "interactive_light_html": "https://storage.googleapis.com/anyplot-images/plots/dashboard-metrics-tiles/javascript/highcharts/plot-light.html",
  "interactive_dark_html": "https://storage.googleapis.com/anyplot-images/plots/dashboard-metrics-tiles/javascript/highcharts/plot-dark.html",
  "quality_score": 91.0,
  "license": "MIT",
  "guide": "https://anyplot.ai/llms.txt"
}
Part of Real-Time Dashboard Tiles on anyplot.ai.