The same plot in 14 other libraries — JavaScript: D3.js, Apache ECharts, Highcharts, MUI X Charts; Python: Altair, Bokeh, lets-plot, Matplotlib, Plotly, plotnine, Pygal, Seaborn; R: ggplot2; Julia: Makie.jl. Compare all 15 side by side: Real-Time Dashboard Tiles in Python, R, Julia and JavaScript.
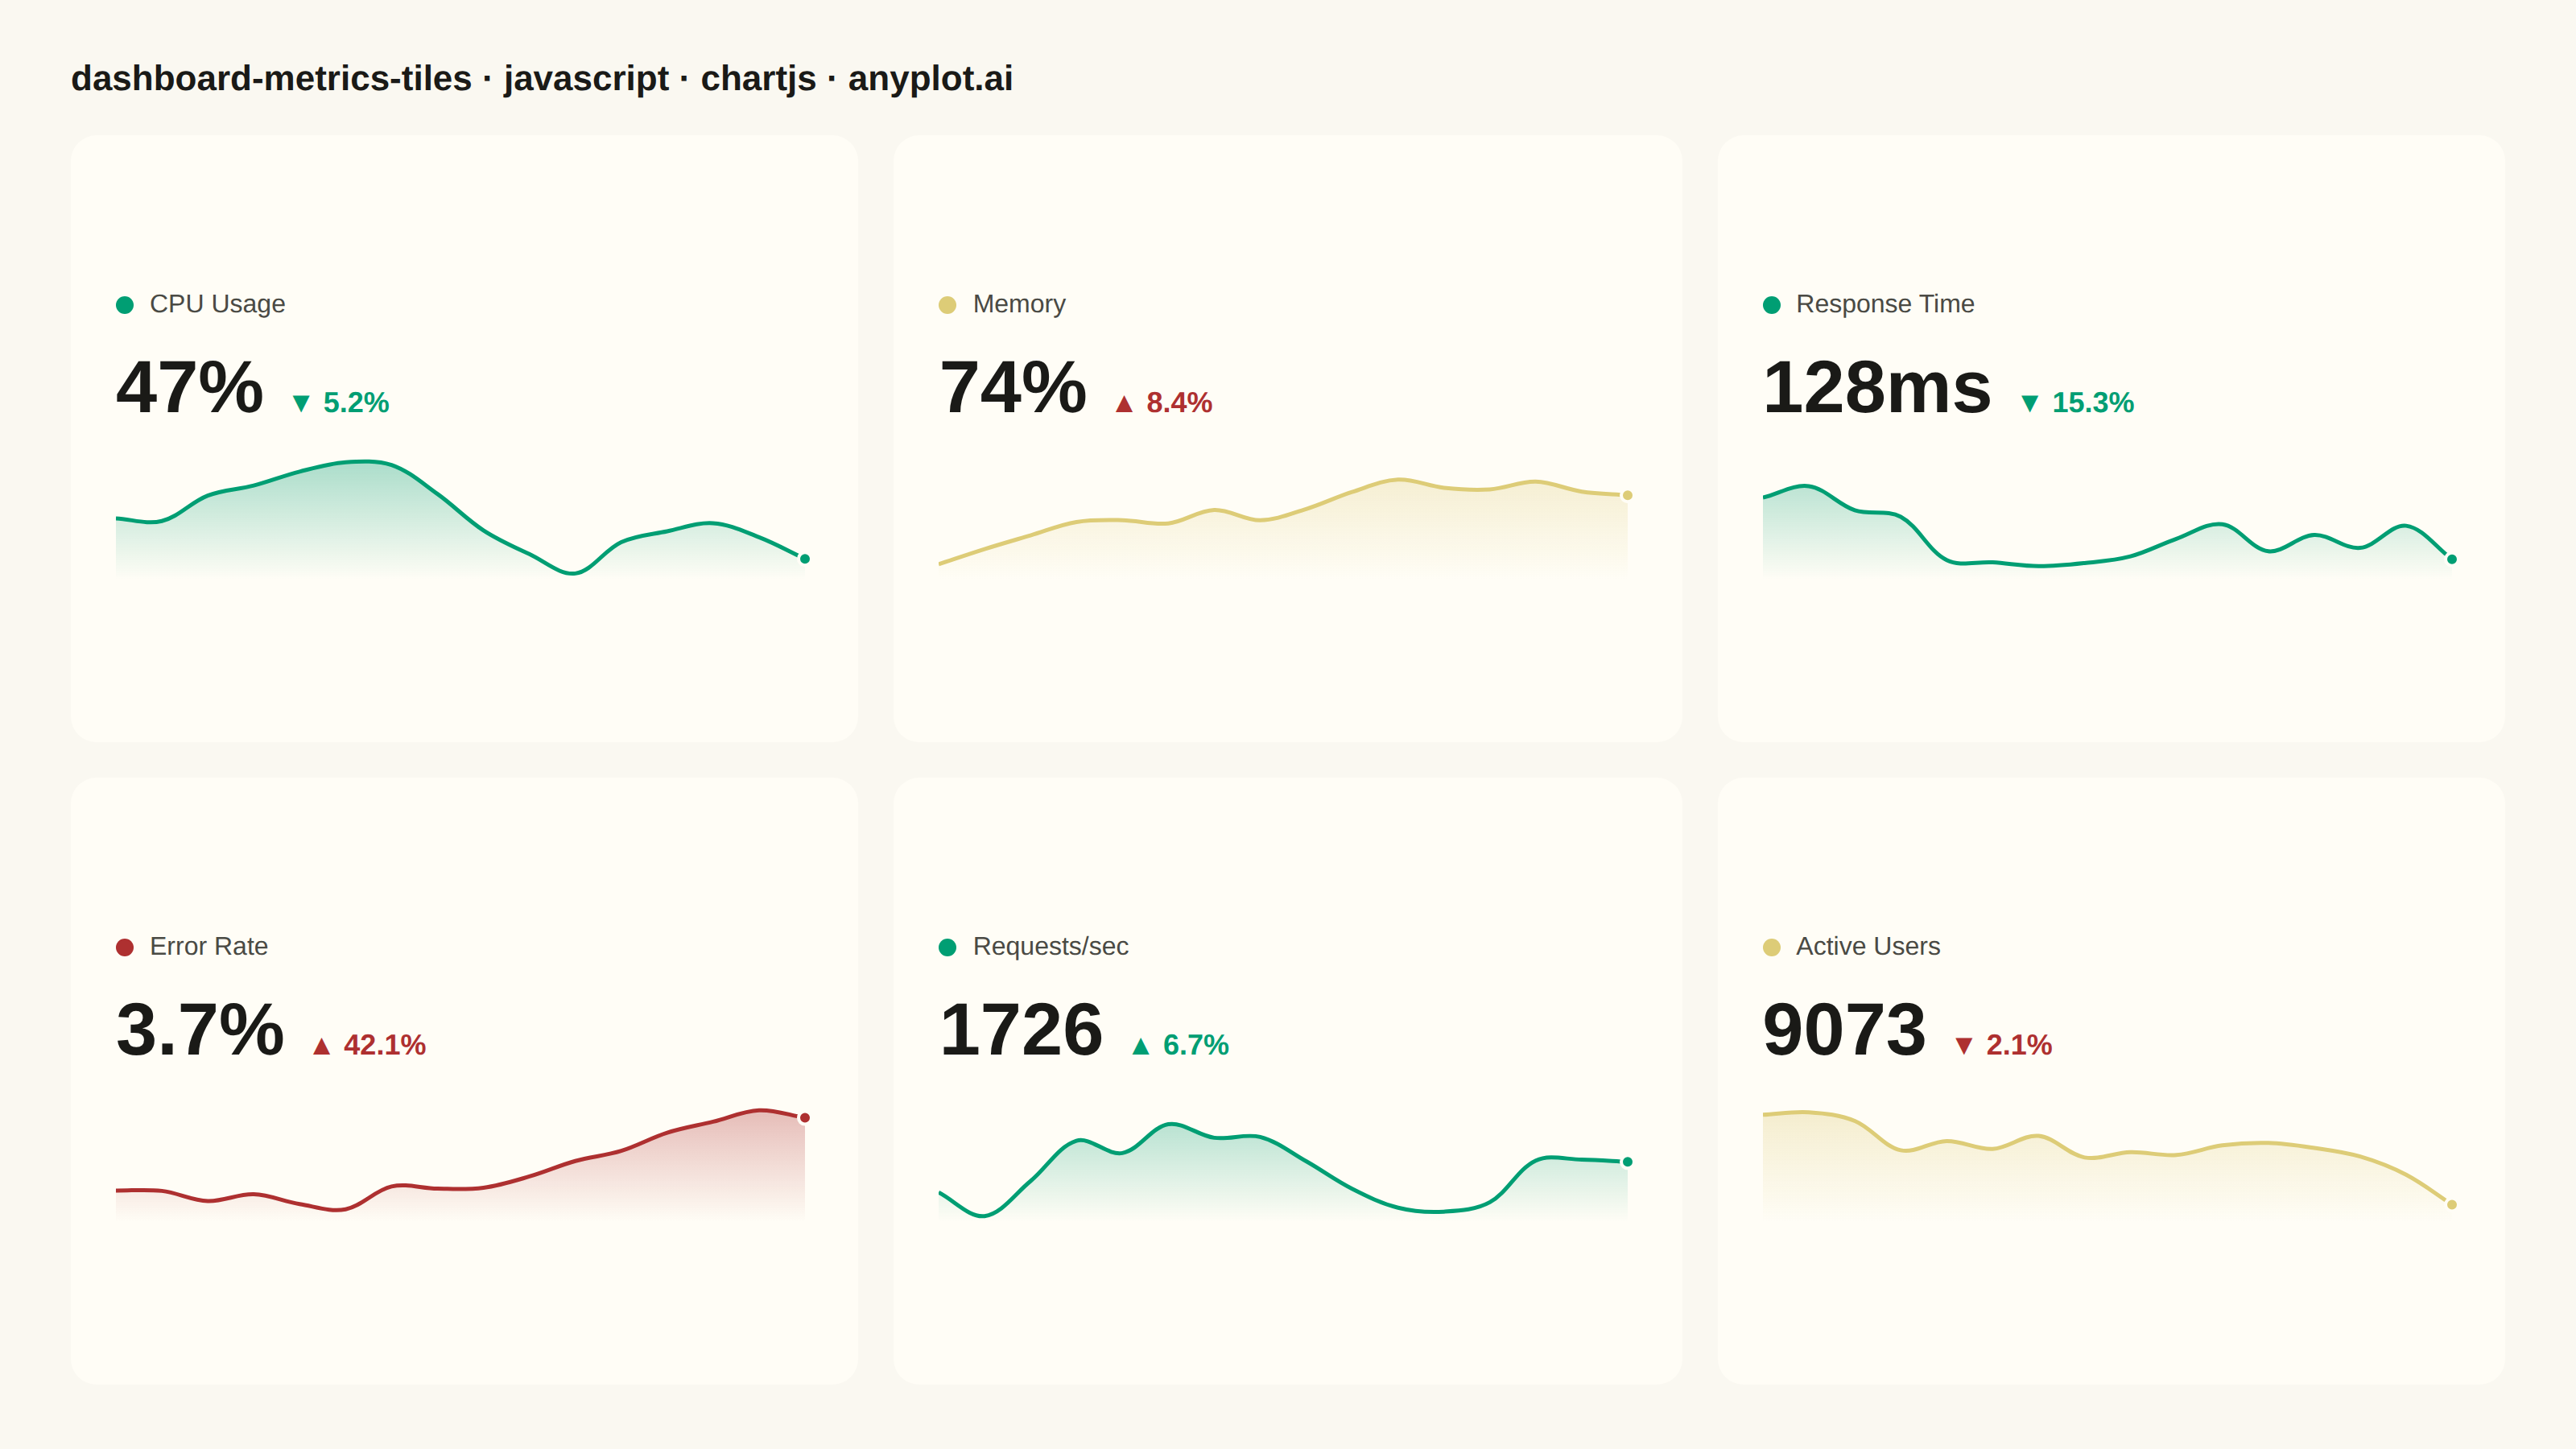
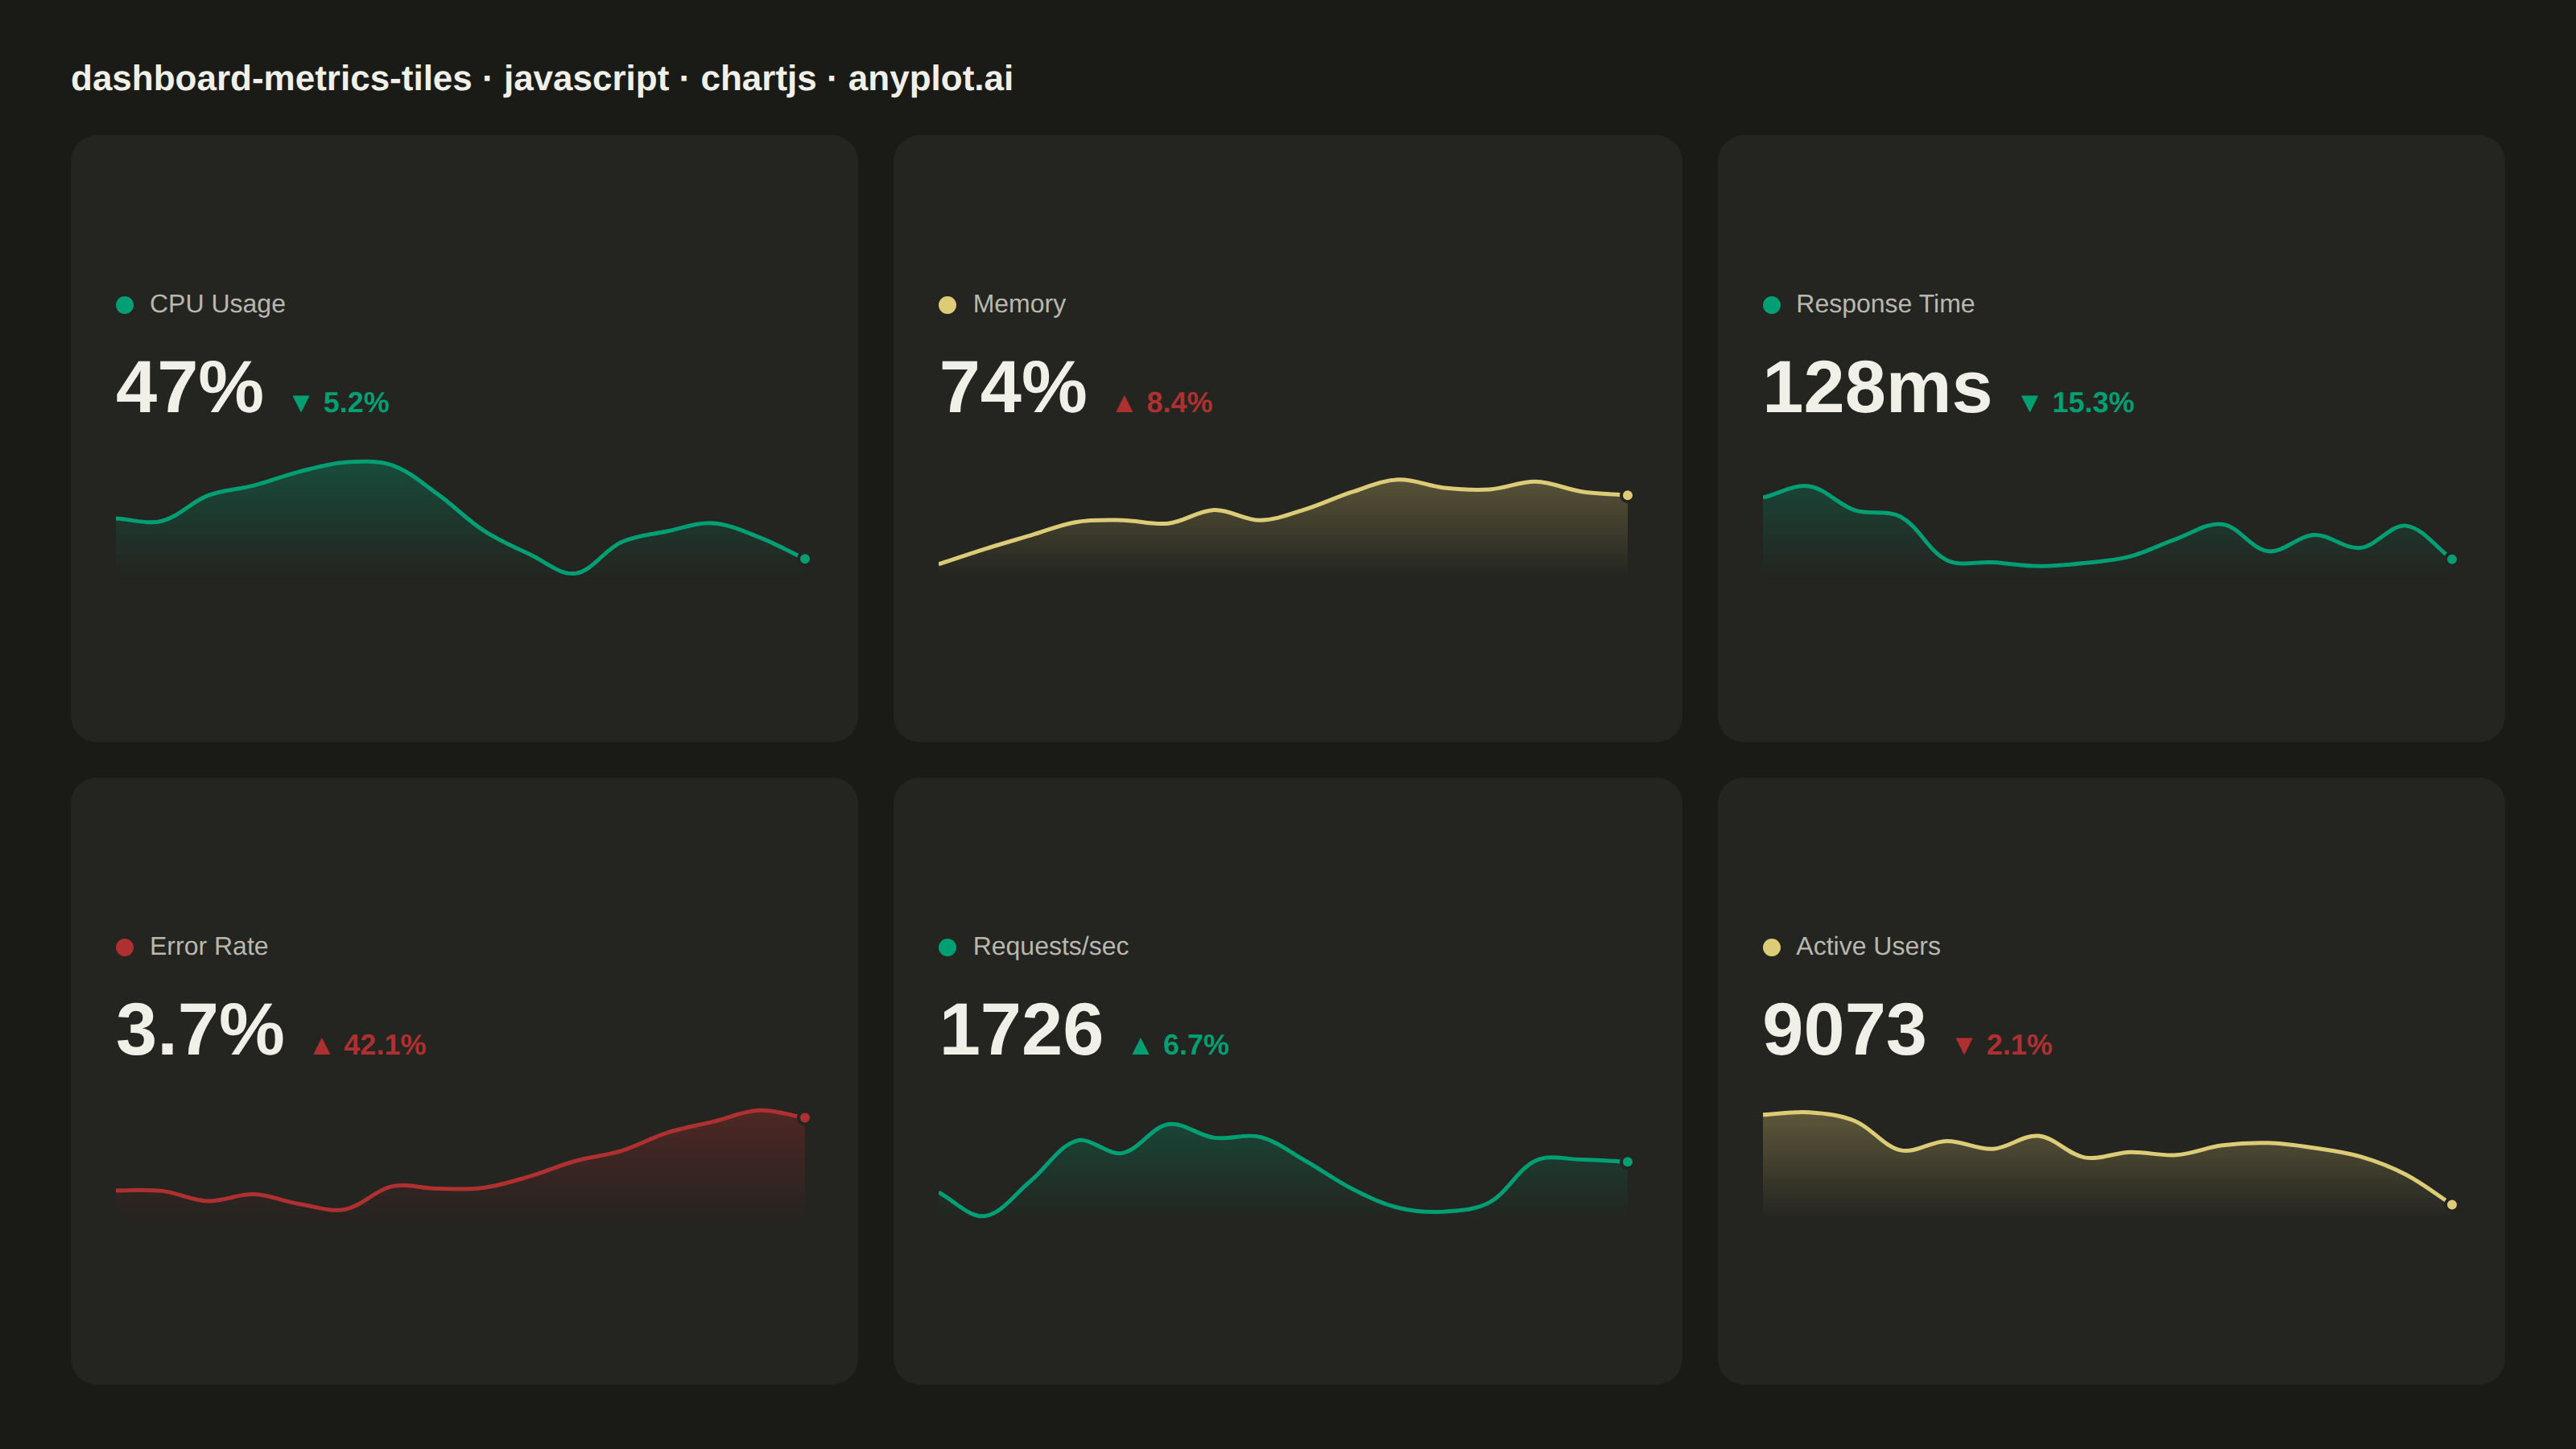
A dashboard layout displaying multiple metric tiles in a responsive grid, where each tile shows a KPI value with its label, an embedded sparkline showing recent trend, and a change indicator (up/down arrow with percentage). This visualization is essential for operations monitoring and business dashboards where multiple metrics need to be tracked simultaneously at a glance. The combination of current value, trend visualization, and change direction provides comprehensive metric context in a compact format.
// anyplot.ai
// dashboard-metrics-tiles: Real-Time Dashboard Tiles
// Library: chartjs 4.4.7 | JavaScript 22.23.2
// Quality: 92/100 | Updated: 2026-09-02

const t = window.ANYPLOT_TOKENS;

// --- Data (in-memory, deterministic) ----------------------------------------
// Tiny fixed-seed LCG — the browser has no seeded RNG.
let seed = 42;
function rand() {
  seed = (seed * 1103515245 + 12345) & 0x7fffffff;
  return seed / 0x7fffffff;
}

// Builds a short trend history that drifts toward `drift` each step, then
// derives the tile's headline value from the trend's final point so the
// sparkline and the big number always agree.
function buildMetric(
  name,
  unit,
  decimals,
  base,
  spread,
  drift,
  points,
  changePercent,
  higherIsBetter,
  status,
) {
  const data = [];
  let v = base;
  for (let i = 0; i < points; i++) {
    v = Math.max(0, v + (rand() - 0.5) * spread + drift);
    data.push(v);
  }
  const value =
    decimals > 0
      ? +data[data.length - 1].toFixed(decimals)
      : Math.round(data[data.length - 1]);
  return { name, unit, value, data, changePercent, higherIsBetter, status };
}

const metrics = [
  buildMetric("CPU Usage", "%", 0, 50, 6, -0.35, 16, -5.2, false, "good"),
  buildMetric("Memory", "%", 0, 64, 5, 0.55, 16, 8.4, false, "warning"),
  buildMetric(
    "Response Time",
    "ms",
    0,
    140,
    12,
    -1.3,
    16,
    -15.3,
    false,
    "good",
  ),
  buildMetric(
    "Error Rate",
    "%",
    1,
    2.2,
    0.6,
    0.12,
    16,
    42.1,
    false,
    "critical",
  ),
  buildMetric("Requests/sec", "", 0, 1700, 90, 8, 16, 6.7, true, "good"),
  buildMetric("Active Users", "", 0, 9500, 220, -18, 16, -2.1, true, "warning"),
];

// good/warning/critical are a traffic-light convention readers already expect —
// semantic exception from the Imprint palette rather than ordinal position.
const STATUS_COLOR = {
  good: t.palette[0],
  warning: t.amber,
  critical: t.palette[4],
};

// null = flat (no favorable/unfavorable read); otherwise "does this change help".
function favorableColor(m) {
  if (m.changePercent === 0) return t.inkSoft;
  const favorable = m.changePercent > 0 === m.higherIsBetter;
  return favorable ? t.palette[0] : t.palette[4];
}

// Chart.js plugin: marks the sparkline's last point with a filled "now" dot,
// ringed in the card color so it reads clearly against the line/fill.
const endpointDotPlugin = {
  id: "endpointDot",
  afterDatasetsDraw(chart) {
    const meta = chart.getDatasetMeta(0);
    const point = meta.data[meta.data.length - 1];
    if (!point) return;
    const { ctx } = chart;
    ctx.save();
    ctx.beginPath();
    ctx.arc(point.x, point.y, 4, 0, Math.PI * 2);
    ctx.fillStyle = chart.data.datasets[0].borderColor;
    ctx.fill();
    ctx.lineWidth = 2;
    ctx.strokeStyle = t.elevatedBg;
    ctx.stroke();
    ctx.restore();
  },
};

// --- Mount -------------------------------------------------------------------
const root = document.getElementById("container");
root.style.display = "flex";
root.style.flexDirection = "column";
root.style.padding = "36px 44px 40px";
root.style.gap = "22px";

const heading = document.createElement("div");
heading.textContent =
  "dashboard-metrics-tiles · javascript · chartjs · anyplot.ai";
heading.style.fontSize = "22px";
heading.style.fontWeight = "600";
heading.style.color = t.ink;
root.appendChild(heading);

const grid = document.createElement("div");
grid.style.flex = "1";
grid.style.display = "grid";
grid.style.gridTemplateColumns = "repeat(3, 1fr)";
grid.style.gridTemplateRows = "repeat(2, 1fr)";
grid.style.gap = "22px";
root.appendChild(grid);

// --- Tiles ---------------------------------------------------------------
metrics.forEach((m) => {
  const tile = document.createElement("div");
  tile.style.background = t.elevatedBg;
  tile.style.borderRadius = "16px";
  tile.style.padding = "24px 28px";
  tile.style.display = "flex";
  tile.style.flexDirection = "column";
  tile.style.justifyContent = "center";
  tile.style.gap = "14px";
  grid.appendChild(tile);

  const labelRow = document.createElement("div");
  labelRow.style.display = "flex";
  labelRow.style.alignItems = "center";
  labelRow.style.gap = "10px";
  tile.appendChild(labelRow);

  const dot = document.createElement("span");
  dot.style.width = "11px";
  dot.style.height = "11px";
  dot.style.borderRadius = "50%";
  dot.style.background = STATUS_COLOR[m.status];
  dot.style.flex = "none";
  labelRow.appendChild(dot);

  const label = document.createElement("span");
  label.textContent = m.name;
  label.style.fontSize = "16px";
  label.style.fontWeight = "500";
  label.style.color = t.inkSoft;
  labelRow.appendChild(label);

  const valueRow = document.createElement("div");
  valueRow.style.display = "flex";
  valueRow.style.alignItems = "baseline";
  valueRow.style.gap = "14px";
  tile.appendChild(valueRow);

  const value = document.createElement("span");
  value.textContent = `${m.value}${m.unit}`;
  value.style.fontSize = "46px";
  value.style.fontWeight = "700";
  value.style.color = t.ink;
  valueRow.appendChild(value);

  const arrow = m.changePercent > 0 ? "▲" : m.changePercent < 0 ? "▼" : "–";
  const change = document.createElement("span");
  change.textContent = `${arrow} ${Math.abs(m.changePercent).toFixed(1)}%`;
  change.style.fontSize = "18px";
  change.style.fontWeight = "600";
  change.style.color = favorableColor(m);
  valueRow.appendChild(change);

  const sparkWrap = document.createElement("div");
  sparkWrap.style.height = "84px";
  tile.appendChild(sparkWrap);

  const canvas = document.createElement("canvas");
  sparkWrap.appendChild(canvas);

  new Chart(canvas, {
    type: "line",
    data: {
      labels: m.data.map((_, i) => i),
      datasets: [
        {
          data: m.data,
          borderColor: STATUS_COLOR[m.status],
          // Canvas gradient (fades to transparent) instead of a flat alpha
          // fill — a genuine canvas/Chart.js scriptable-option feature.
          backgroundColor: (ctx) => {
            const { chartArea, ctx: c } = ctx.chart;
            if (!chartArea) return `${STATUS_COLOR[m.status]}26`;
            const gradient = c.createLinearGradient(
              0,
              chartArea.top,
              0,
              chartArea.bottom,
            );
            gradient.addColorStop(0, `${STATUS_COLOR[m.status]}55`);
            gradient.addColorStop(1, `${STATUS_COLOR[m.status]}00`);
            return gradient;
          },
          borderWidth: 2.5,
          pointRadius: 0,
          fill: true,
          tension: 0.35,
        },
      ],
    },
    options: {
      responsive: true,
      maintainAspectRatio: false,
      animation: false,
      // Room for the endpoint dot, which would otherwise clip against the
      // canvas edge since the last data point sits at the plot boundary.
      layout: { padding: { top: 5, right: 5, bottom: 5 } },
      plugins: { legend: { display: false }, tooltip: { enabled: false } },
      scales: { x: { display: false }, y: { display: false } },
    },
    plugins: [endpointDotPlugin],
  });
});
Runnable source as JSON, for any HTTP client: https://api.anyplot.ai/specs/dashboard-metrics-tiles/chartjs/code. Any spec id and library id listed in llms-full.txt fit the same URL shape; every URL below is complete and callable.
{
  "spec_id": "dashboard-metrics-tiles",
  "language": "javascript",
  "library": "chartjs",
  "page": "https://anyplot.ai/dashboard-metrics-tiles/javascript/chartjs",
  "hub": "https://anyplot.ai/dashboard-metrics-tiles",
  "code_json": "https://api.anyplot.ai/specs/dashboard-metrics-tiles/chartjs/code",
  "spec_json": "https://api.anyplot.ai/specs/dashboard-metrics-tiles",
  "render_light_png": "https://storage.googleapis.com/anyplot-images/plots/dashboard-metrics-tiles/javascript/chartjs/plot-light.png",
  "render_dark_png": "https://storage.googleapis.com/anyplot-images/plots/dashboard-metrics-tiles/javascript/chartjs/plot-dark.png",
  "interactive_light_html": "https://storage.googleapis.com/anyplot-images/plots/dashboard-metrics-tiles/javascript/chartjs/plot-light.html",
  "interactive_dark_html": "https://storage.googleapis.com/anyplot-images/plots/dashboard-metrics-tiles/javascript/chartjs/plot-dark.html",
  "quality_score": 92.0,
  "license": "MIT",
  "guide": "https://anyplot.ai/llms.txt"
}
Part of Real-Time Dashboard Tiles on anyplot.ai.