The same plot in 14 other libraries — JavaScript: Chart.js, Apache ECharts, Highcharts, MUI X Charts; Python: Altair, Bokeh, lets-plot, Matplotlib, Plotly, plotnine, Pygal, Seaborn; R: ggplot2; Julia: Makie.jl. Compare all 15 side by side: Real-Time Dashboard Tiles in Python, R, Julia and JavaScript.
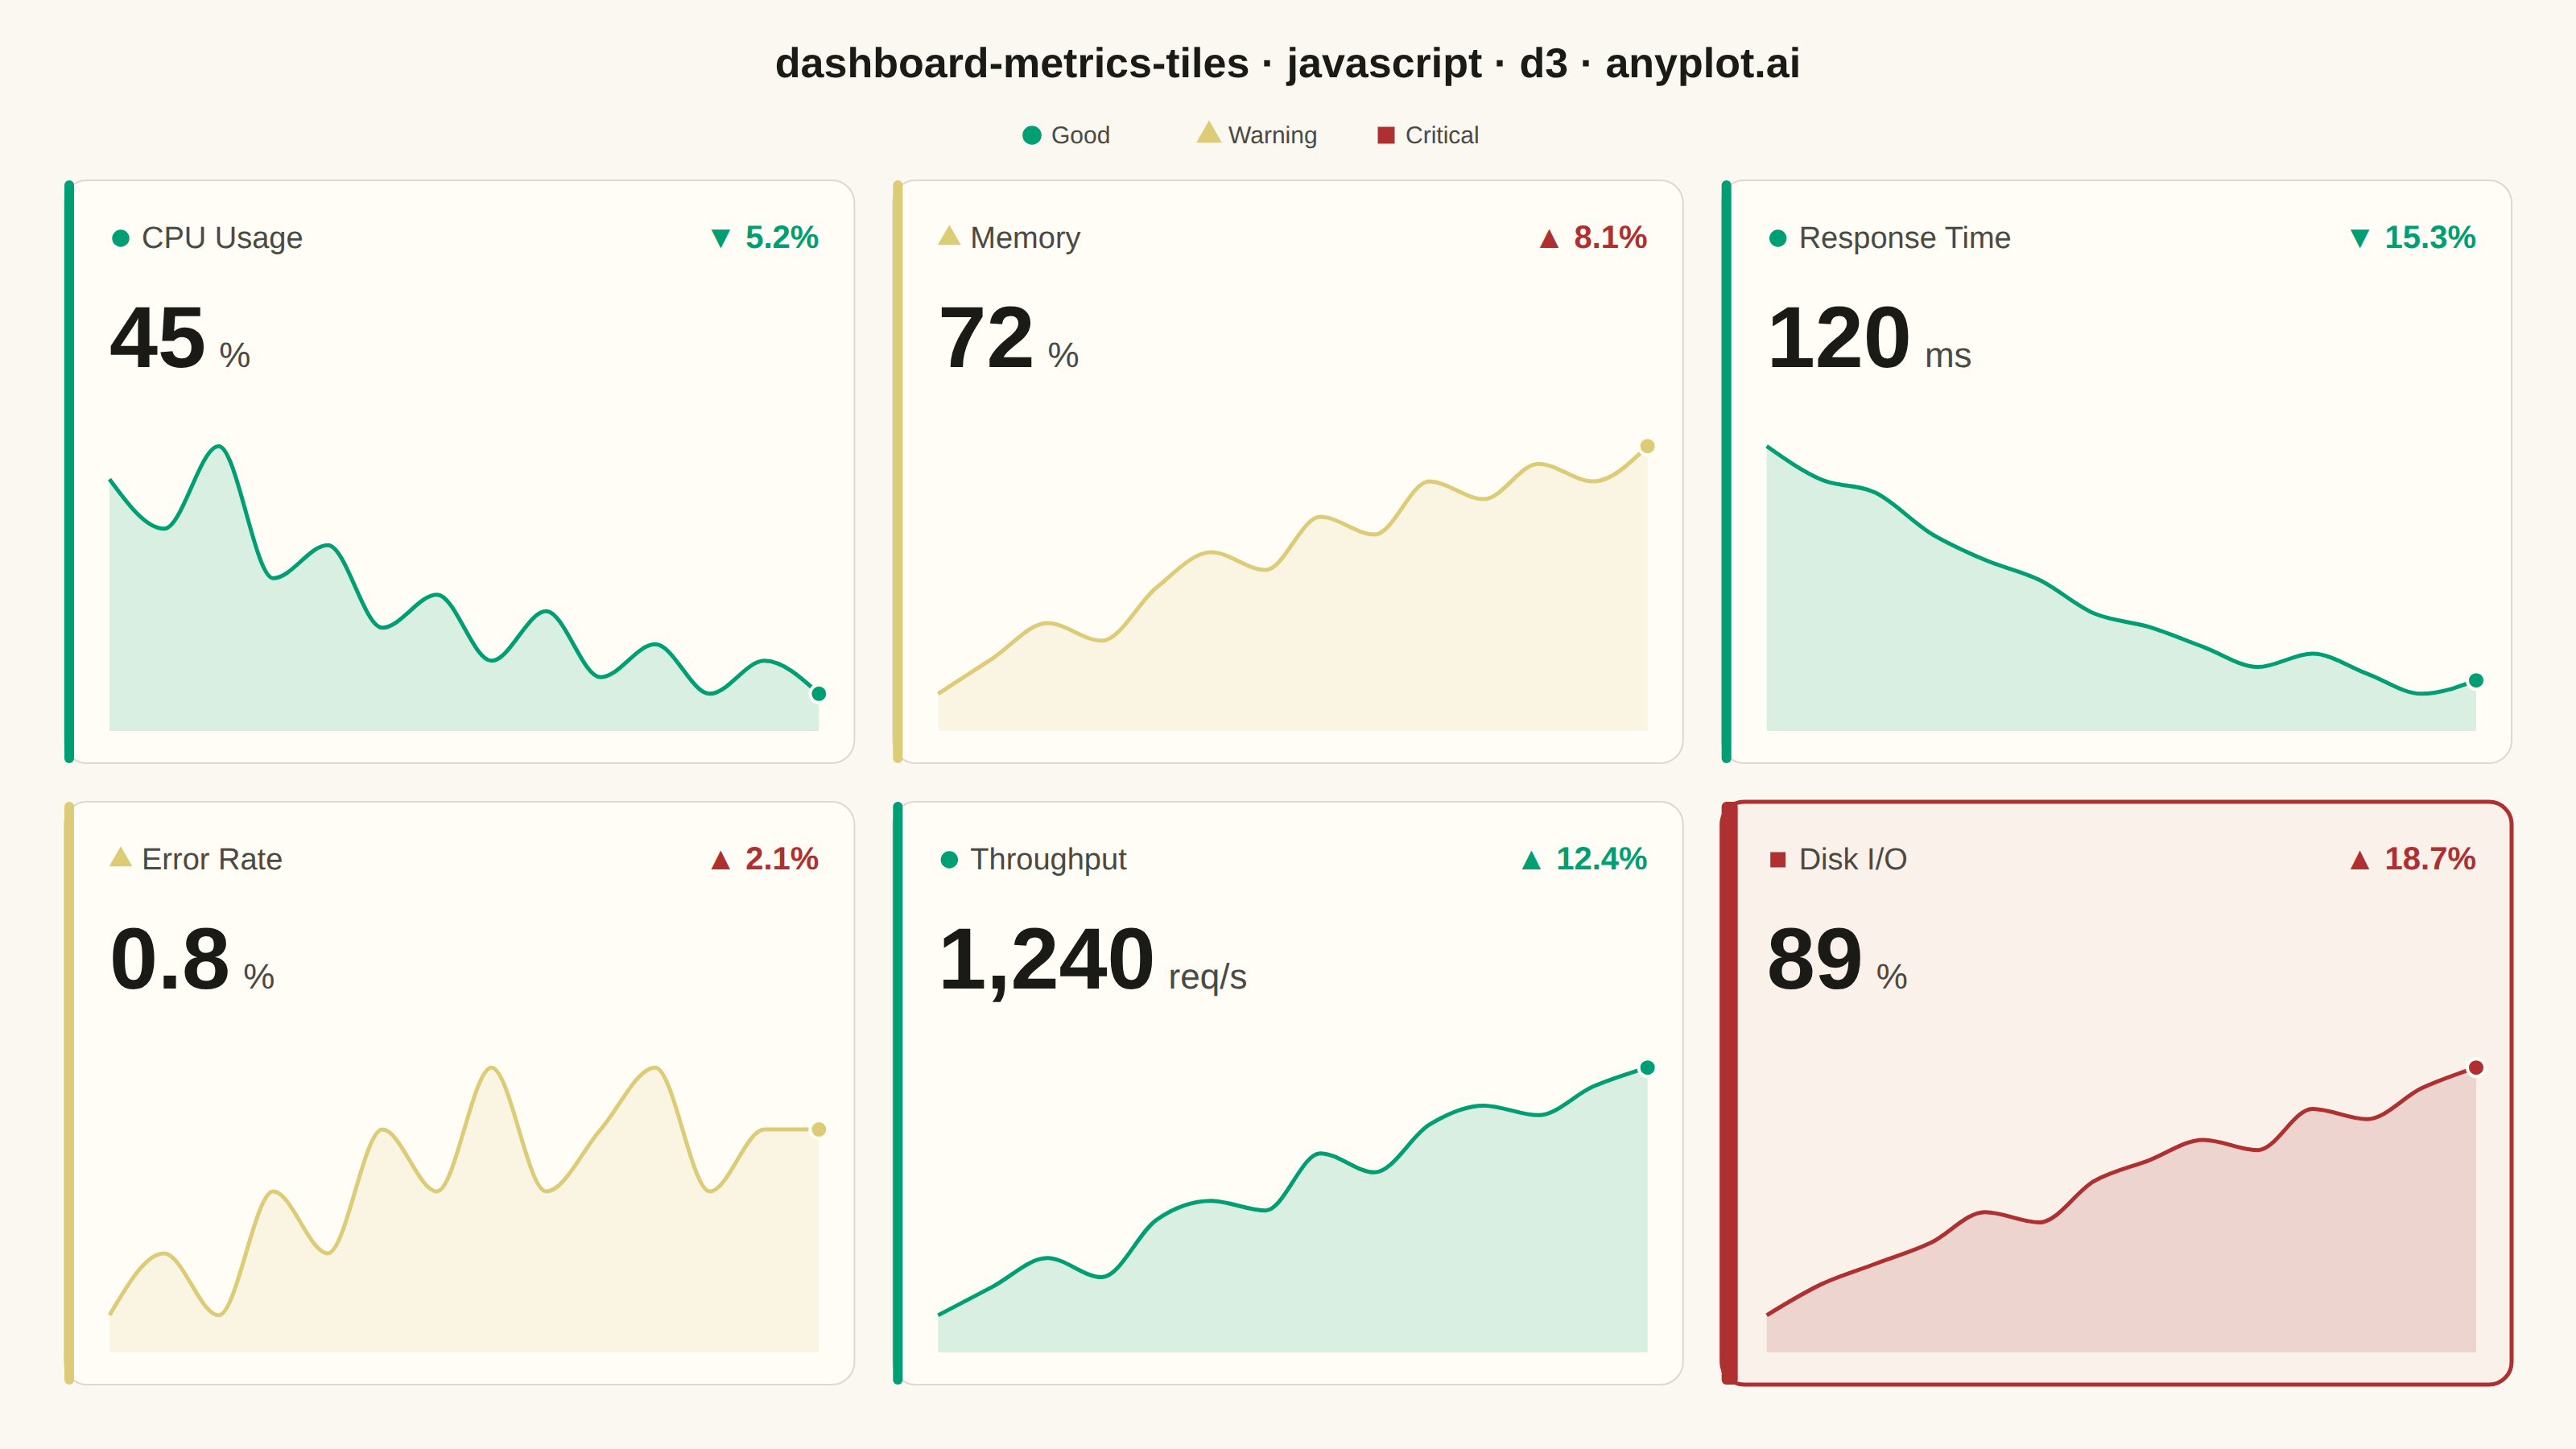
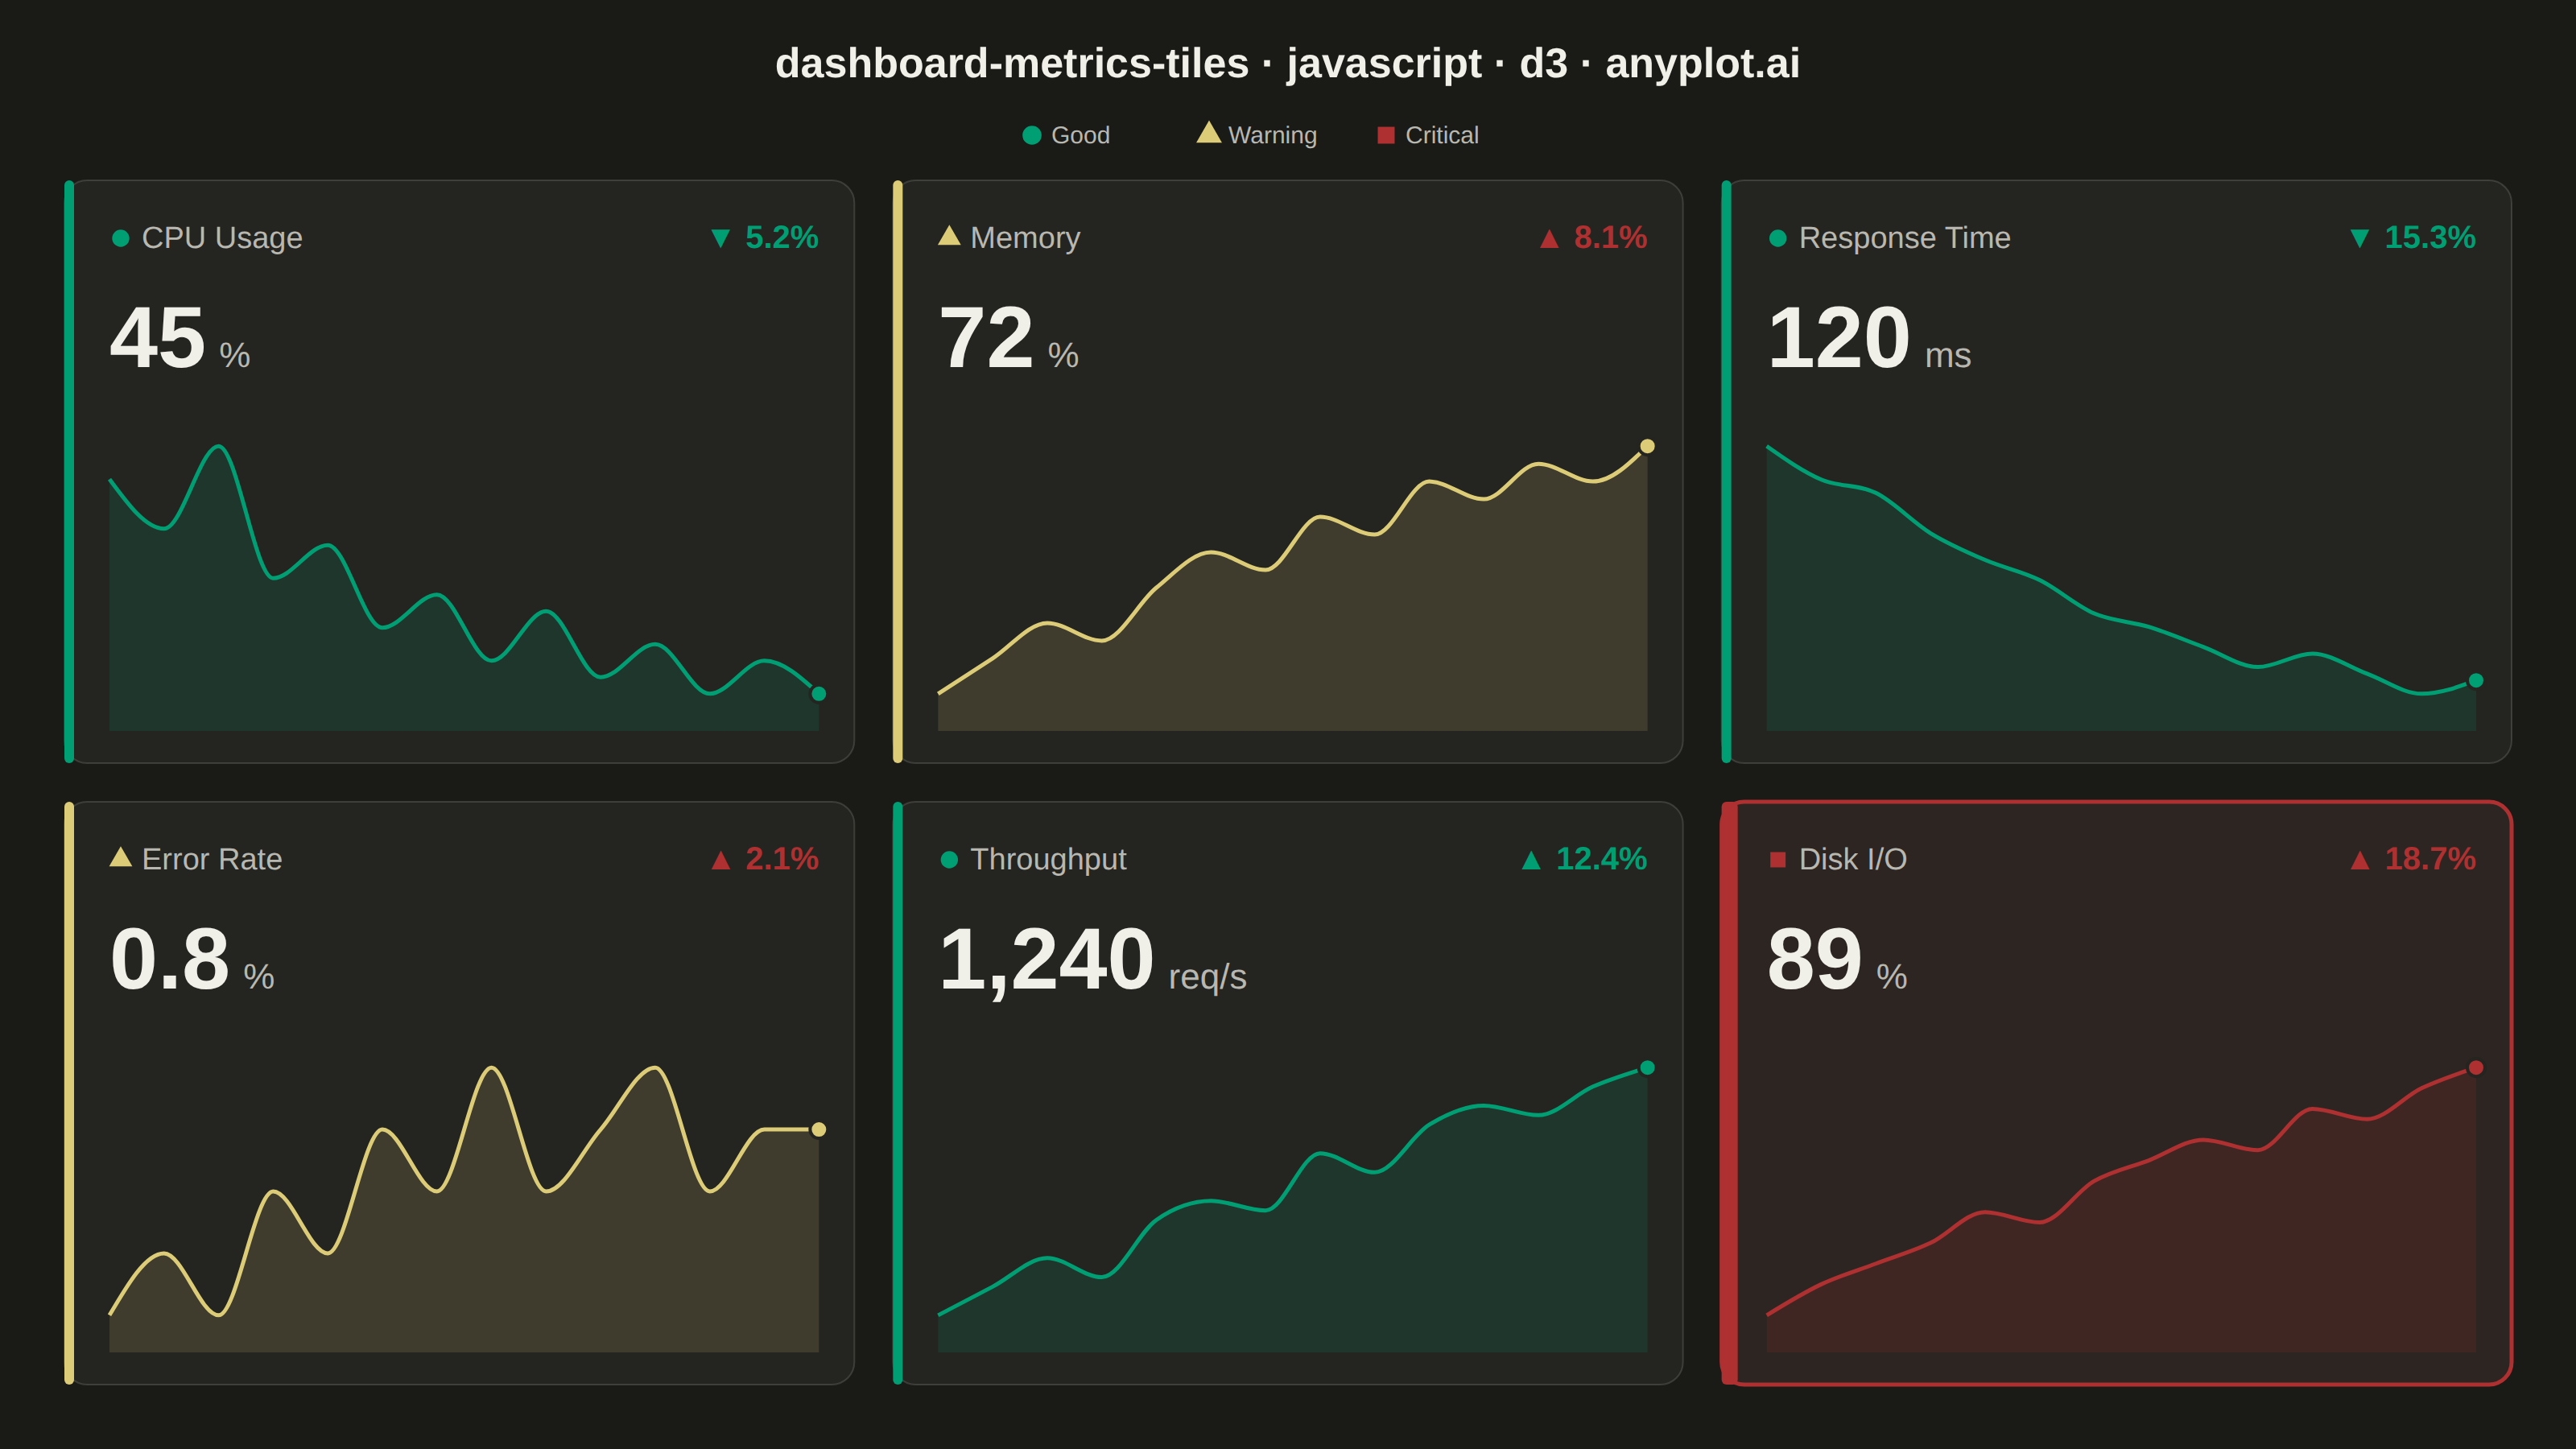
A dashboard layout displaying multiple metric tiles in a responsive grid, where each tile shows a KPI value with its label, an embedded sparkline showing recent trend, and a change indicator (up/down arrow with percentage). This visualization is essential for operations monitoring and business dashboards where multiple metrics need to be tracked simultaneously at a glance. The combination of current value, trend visualization, and change direction provides comprehensive metric context in a compact format.
// anyplot.ai
// dashboard-metrics-tiles: Real-Time Dashboard Tiles
// Library: d3 7.9.0 | JavaScript 22.23.2
// Quality: 91/100 | Updated: 2026-09-02

const t = window.ANYPLOT_TOKENS;
const { width, height } = window.ANYPLOT_SIZE;

const GOOD = t.palette[0]; // #009E73 — brand green, also "favorable / good" anchor
const WARNING = t.amber; // #DDCC77
const CRITICAL = t.palette[4]; // #AE3030 — matte red, semantic anchor for bad/error
const STATUS_COLOR = { good: GOOD, warning: WARNING, critical: CRITICAL };
// Shape-coded per status (circle/triangle/square) so meaning survives without color — CVD-safe.
const STATUS_SYMBOL = {
  good: d3.symbolCircle,
  warning: d3.symbolTriangle,
  critical: d3.symbolSquare,
};

// --- Data (in-memory, deterministic) ----------------------------------------
// A snapshot of an operations dashboard: current value + recent history per
// metric. `favorable` says whether this metric's change direction is good
// news (independent of `status`, which reflects the current absolute level).
const metrics = [
  {
    name: "CPU Usage",
    value: 45,
    unit: "%",
    history: [58, 55, 60, 52, 54, 49, 51, 47, 50, 46, 48, 45, 47, 45],
    changePercent: -5.2,
    favorable: true,
    status: "good",
  },
  {
    name: "Memory",
    value: 72,
    unit: "%",
    history: [58, 60, 62, 61, 64, 66, 65, 68, 67, 70, 69, 71, 70, 72],
    changePercent: 8.1,
    favorable: false,
    status: "warning",
  },
  {
    name: "Response Time",
    value: 120,
    unit: "ms",
    history: [
      155, 150, 148, 142, 138, 135, 130, 128, 125, 122, 124, 121, 118, 120,
    ],
    changePercent: -15.3,
    favorable: true,
    status: "good",
  },
  {
    name: "Error Rate",
    value: 0.8,
    unit: "%",
    history: [
      0.5, 0.6, 0.5, 0.7, 0.6, 0.8, 0.7, 0.9, 0.7, 0.8, 0.9, 0.7, 0.8, 0.8,
    ],
    changePercent: 2.1,
    favorable: false,
    status: "warning",
  },
  {
    name: "Throughput",
    value: 1240,
    unit: "req/s",
    history: [
      980, 1010, 1040, 1020, 1080, 1100, 1090, 1150, 1130, 1180, 1200, 1190,
      1220, 1240,
    ],
    changePercent: 12.4,
    favorable: true,
    status: "good",
  },
  {
    name: "Disk I/O",
    value: 89,
    unit: "%",
    history: [65, 68, 70, 72, 75, 74, 78, 80, 82, 81, 85, 84, 87, 89],
    changePercent: 18.7,
    favorable: false,
    status: "critical",
  },
];

const formatValue = (m) =>
  m.unit === "req/s" ? d3.format(",")(m.value) : String(m.value);

// --- Grid geometry ------------------------------------------------------------
const cols = 3;
const rows = 2;
const outerMargin = { top: 112, right: 40, bottom: 40, left: 40 };
const gap = 24;
const gridW = width - outerMargin.left - outerMargin.right;
const gridH = height - outerMargin.top - outerMargin.bottom;
const tileW = (gridW - gap * (cols - 1)) / cols;
const tileH = (gridH - gap * (rows - 1)) / rows;

const accentW = 6;
const padLeft = 22;
const padRight = 22;
const padTop = 24;
const padBottom = 20;
const contentX = accentW + padLeft;
const contentW = tileW - contentX - padRight;

// --- SVG mount ----------------------------------------------------------------
const svg = d3
  .select("#container")
  .append("svg")
  .attr("width", width)
  .attr("height", height);

// --- Title ---------------------------------------------------------------------
svg
  .append("text")
  .attr("x", width / 2)
  .attr("y", 48)
  .attr("text-anchor", "middle")
  .attr("fill", t.ink)
  .style("font-size", "26px")
  .style("font-weight", "600")
  .text("dashboard-metrics-tiles · javascript · d3 · anyplot.ai");

// --- Status legend --------------------------------------------------------------
const legend = [
  { label: "Good", color: GOOD, symbol: STATUS_SYMBOL.good },
  { label: "Warning", color: WARNING, symbol: STATUS_SYMBOL.warning },
  { label: "Critical", color: CRITICAL, symbol: STATUS_SYMBOL.critical },
];
const legendItemW = 110;
const legendW = legend.length * legendItemW;
const legendG = svg
  .append("g")
  .attr("transform", `translate(${(width - legendW) / 2}, 84)`);
const legendItems = legendG
  .selectAll("g")
  .data(legend)
  .join("g")
  .attr("transform", (d, i) => `translate(${i * legendItemW}, 0)`);
legendItems
  .append("path")
  .attr("transform", "translate(6,0)")
  .attr("d", (d) => d3.symbol().type(d.symbol).size(110)())
  .attr("fill", (d) => d.color);
legendItems
  .append("text")
  .attr("x", 18)
  .attr("y", 5)
  .attr("fill", t.inkSoft)
  .style("font-size", "15px")
  .text((d) => d.label);

// --- Tiles ----------------------------------------------------------------------
const tiles = svg
  .selectAll("g.tile")
  .data(metrics)
  .join("g")
  .attr("class", "tile")
  .attr("transform", (d, i) => {
    const col = i % cols;
    const row = Math.floor(i / cols);
    const x = outerMargin.left + col * (tileW + gap);
    const y = outerMargin.top + row * (tileH + gap);
    return `translate(${x},${y})`;
  });

// The critical-status tile gets a tinted surface + stronger border so the eye
// lands there first — a deliberate visual-weight difference, not a size change
// (tile footprint stays identical, preserving the uniform grid).
tiles
  .append("rect")
  .attr("width", tileW)
  .attr("height", tileH)
  .attr("rx", 14)
  .attr("fill", (d) =>
    d.status === "critical"
      ? d3.interpolateRgb(t.elevatedBg, CRITICAL)(0.06)
      : t.elevatedBg,
  )
  .attr("stroke", (d) => (d.status === "critical" ? CRITICAL : t.grid))
  .attr("stroke-width", (d) => (d.status === "critical" ? 2.5 : 1));

tiles
  .append("rect")
  .attr("x", 0)
  .attr("width", (d) => (d.status === "critical" ? accentW + 4 : accentW))
  .attr("height", tileH)
  .attr("rx", 3)
  .attr("fill", (d) => STATUS_COLOR[d.status]);

// Status icon — shape-coded (circle/triangle/square), redundant with the
// accent-bar color so status still reads for color-vision-deficient viewers (VQ-04).
const labelY = padTop + 18;
tiles
  .append("path")
  .attr("transform", (d) => `translate(${contentX + 7},${labelY - 6})`)
  .attr("d", (d) => d3.symbol().type(STATUS_SYMBOL[d.status]).size(90)())
  .attr("fill", (d) => STATUS_COLOR[d.status]);

// Metric label
tiles
  .append("text")
  .attr("x", contentX + 20)
  .attr("y", labelY)
  .attr("fill", t.inkSoft)
  .style("font-size", "19px")
  .text((d) => d.name);

// Change indicator — arrow direction from sign, color from favorability
const changeGroup = tiles
  .append("g")
  .attr("transform", `translate(0,${labelY})`);
changeGroup
  .append("text")
  .attr("x", tileW - padRight)
  .attr("y", 0)
  .attr("text-anchor", "end")
  .attr("fill", (d) => (d.favorable ? GOOD : CRITICAL))
  .style("font-size", "20px")
  .style("font-weight", "700")
  .text(
    (d) =>
      `${d.changePercent >= 0 ? "▲" : "▼"} ${Math.abs(d.changePercent).toFixed(1)}%`,
  );

// Value display (big number + unit)
const valueBaseline = padTop + 18 + 74;
const valueText = tiles
  .append("text")
  .attr("x", contentX)
  .attr("y", valueBaseline)
  .attr("fill", t.ink)
  .style("font-weight", "700");
valueText
  .append("tspan")
  .style("font-size", "54px")
  .text((d) => formatValue(d));
valueText
  .append("tspan")
  .attr("dx", 8)
  .style("font-size", "22px")
  .style("font-weight", "500")
  .attr("fill", t.inkSoft)
  .text((d) => d.unit);

// --- Sparklines -------------------------------------------------------------
const sparkTop = valueBaseline + 26;
const sparkBottom = tileH - padBottom;
const sparkH = sparkBottom - sparkTop;

tiles.each(function (d) {
  const tile = d3.select(this);
  const x = d3
    .scaleLinear()
    .domain([0, d.history.length - 1])
    .range([0, contentW]);
  const yMin = d3.min(d.history);
  const yMax = d3.max(d.history);
  const pad = (yMax - yMin) * 0.15 || 1;
  const y = d3
    .scaleLinear()
    .domain([yMin - pad, yMax + pad])
    .range([sparkH, 0]);
  const color = STATUS_COLOR[d.status];

  const area = d3
    .area()
    .x((v, i) => x(i))
    .y0(sparkH)
    .y1((v) => y(v))
    .curve(d3.curveMonotoneX);
  const line = d3
    .line()
    .x((v, i) => x(i))
    .y((v) => y(v))
    .curve(d3.curveMonotoneX);

  const spark = tile
    .append("g")
    .attr("transform", `translate(${contentX},${sparkTop})`);
  spark
    .append("path")
    .datum(d.history)
    .attr("d", area)
    .attr("fill", color)
    .attr("opacity", 0.15);
  spark
    .append("path")
    .datum(d.history)
    .attr("d", line)
    .attr("fill", "none")
    .attr("stroke", color)
    .attr("stroke-width", 2.5);
  spark
    .append("circle")
    .attr("cx", x(d.history.length - 1))
    .attr("cy", y(d.history[d.history.length - 1]))
    .attr("r", 5.5)
    .attr("fill", color)
    .attr("stroke", t.elevatedBg)
    .attr("stroke-width", 2);
});
Runnable source as JSON, for any HTTP client: https://api.anyplot.ai/specs/dashboard-metrics-tiles/d3/code. Any spec id and library id listed in llms-full.txt fit the same URL shape; every URL below is complete and callable.
{
  "spec_id": "dashboard-metrics-tiles",
  "language": "javascript",
  "library": "d3",
  "page": "https://anyplot.ai/dashboard-metrics-tiles/javascript/d3",
  "hub": "https://anyplot.ai/dashboard-metrics-tiles",
  "code_json": "https://api.anyplot.ai/specs/dashboard-metrics-tiles/d3/code",
  "spec_json": "https://api.anyplot.ai/specs/dashboard-metrics-tiles",
  "render_light_png": "https://storage.googleapis.com/anyplot-images/plots/dashboard-metrics-tiles/javascript/d3/plot-light.png",
  "render_dark_png": "https://storage.googleapis.com/anyplot-images/plots/dashboard-metrics-tiles/javascript/d3/plot-dark.png",
  "interactive_light_html": "https://storage.googleapis.com/anyplot-images/plots/dashboard-metrics-tiles/javascript/d3/plot-light.html",
  "interactive_dark_html": "https://storage.googleapis.com/anyplot-images/plots/dashboard-metrics-tiles/javascript/d3/plot-dark.html",
  "quality_score": 91.0,
  "license": "MIT",
  "guide": "https://anyplot.ai/llms.txt"
}
Part of Real-Time Dashboard Tiles on anyplot.ai.