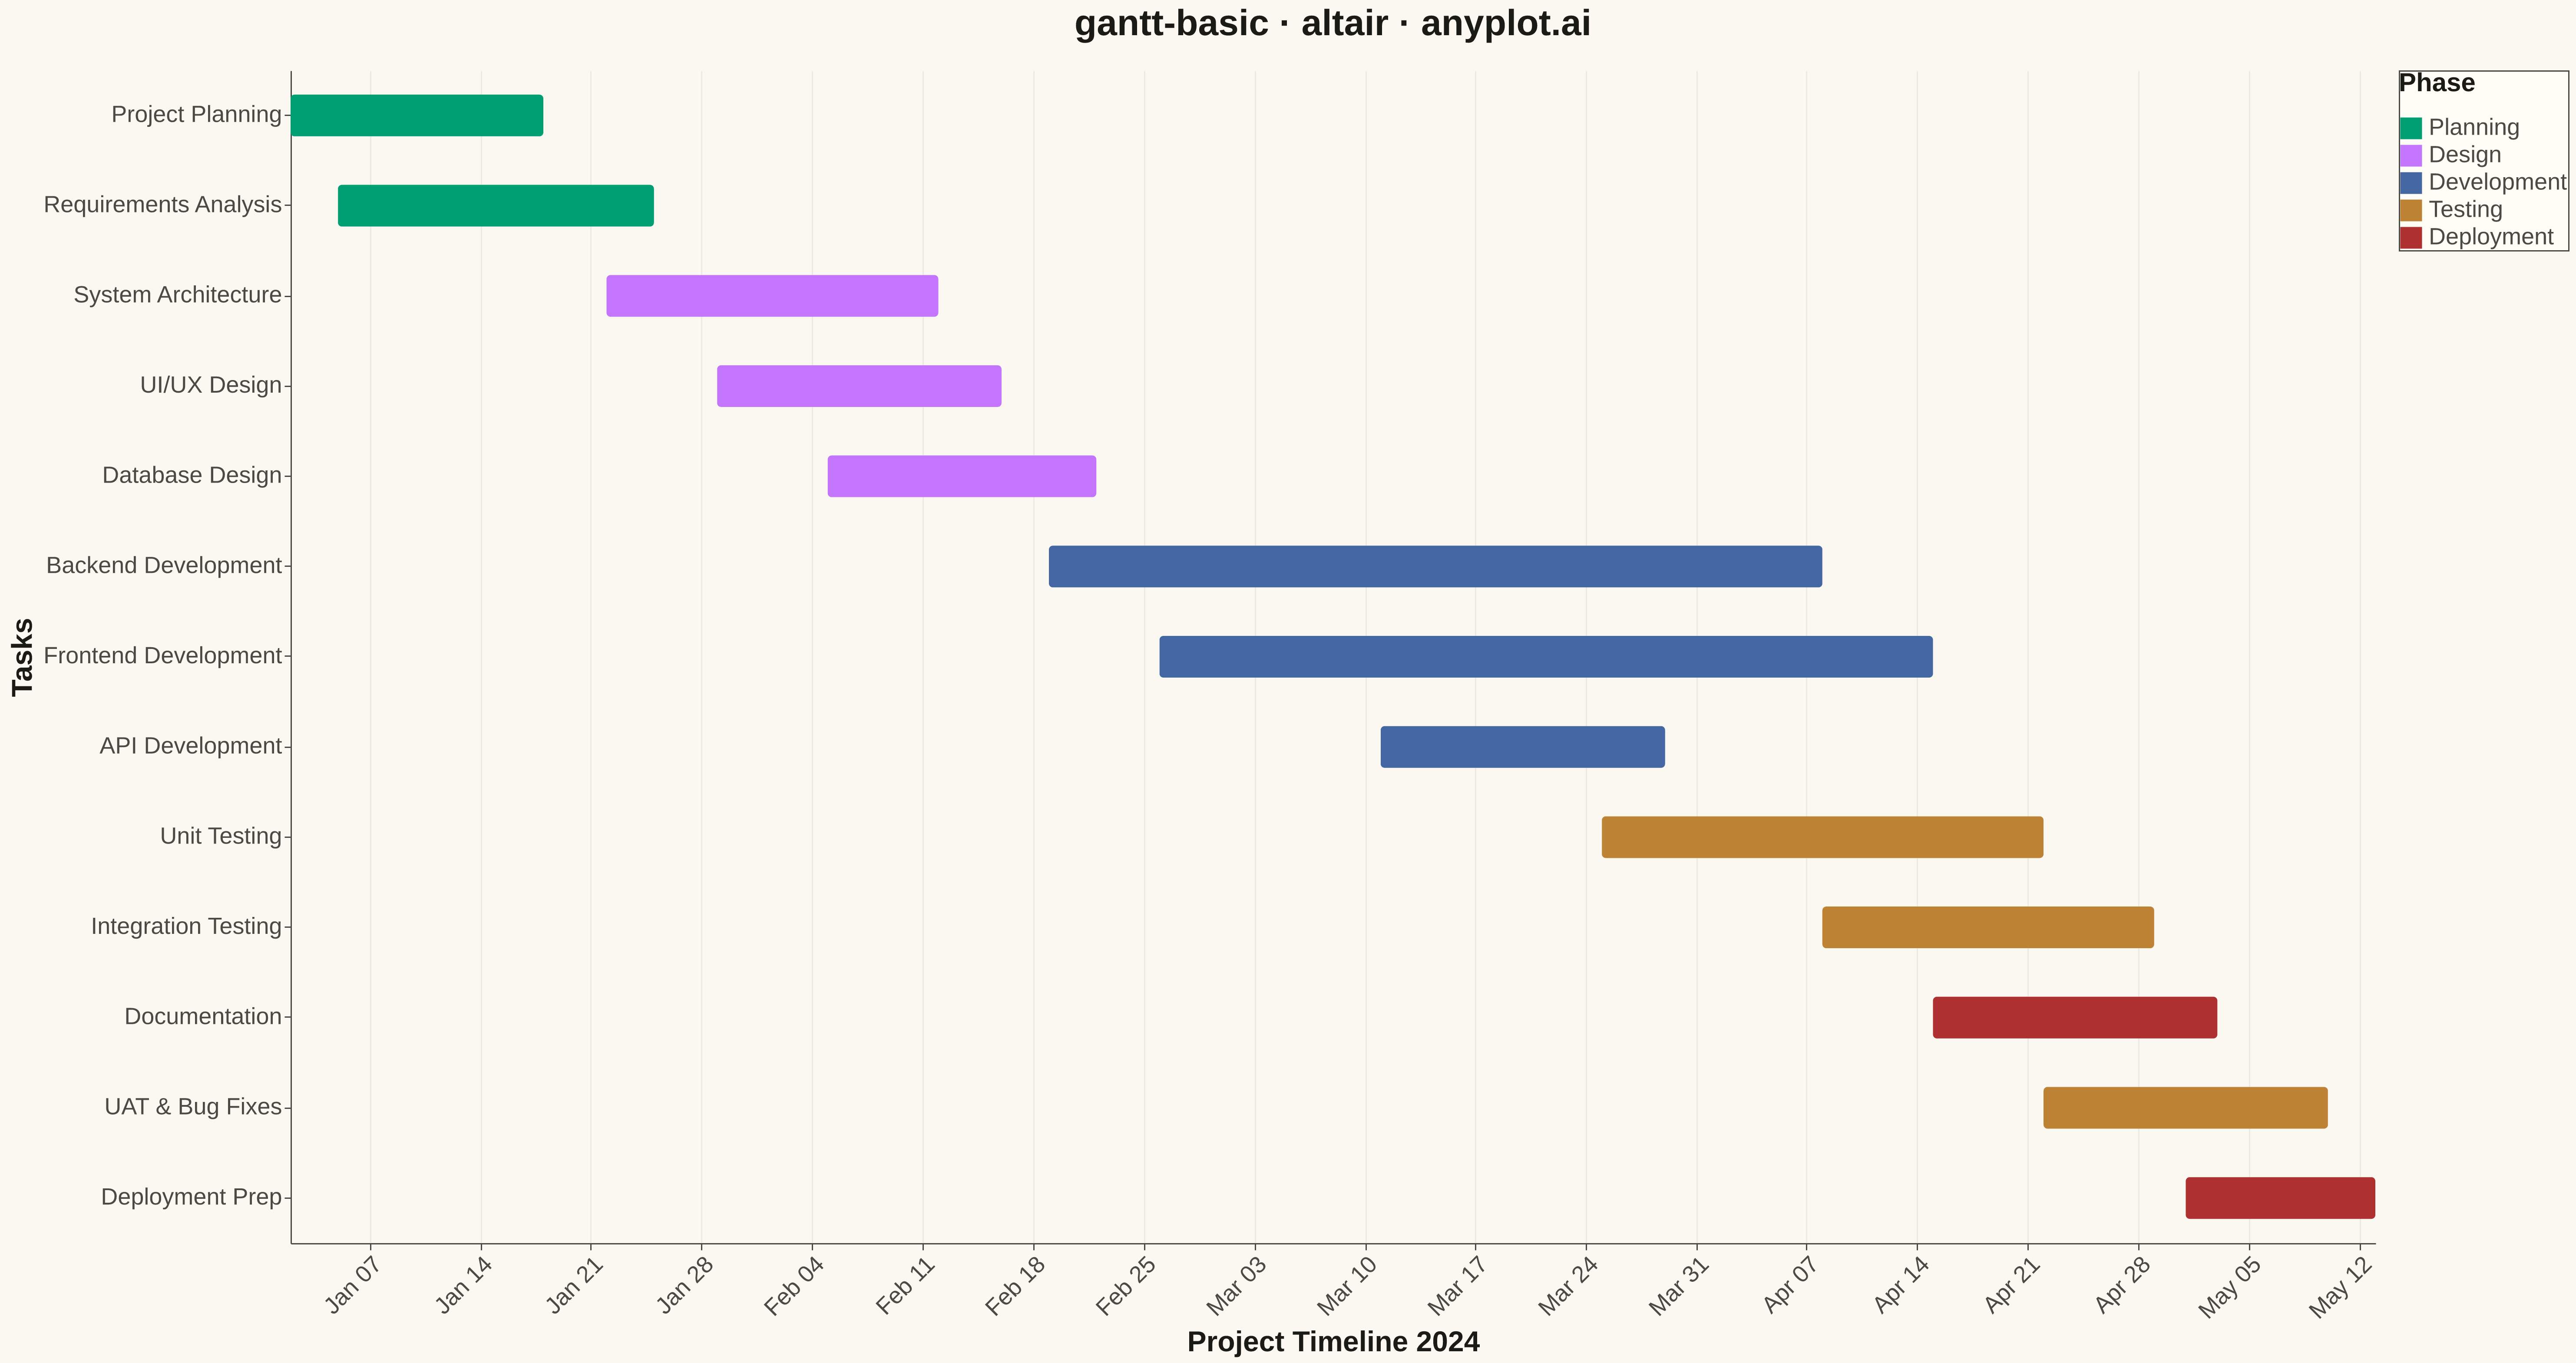
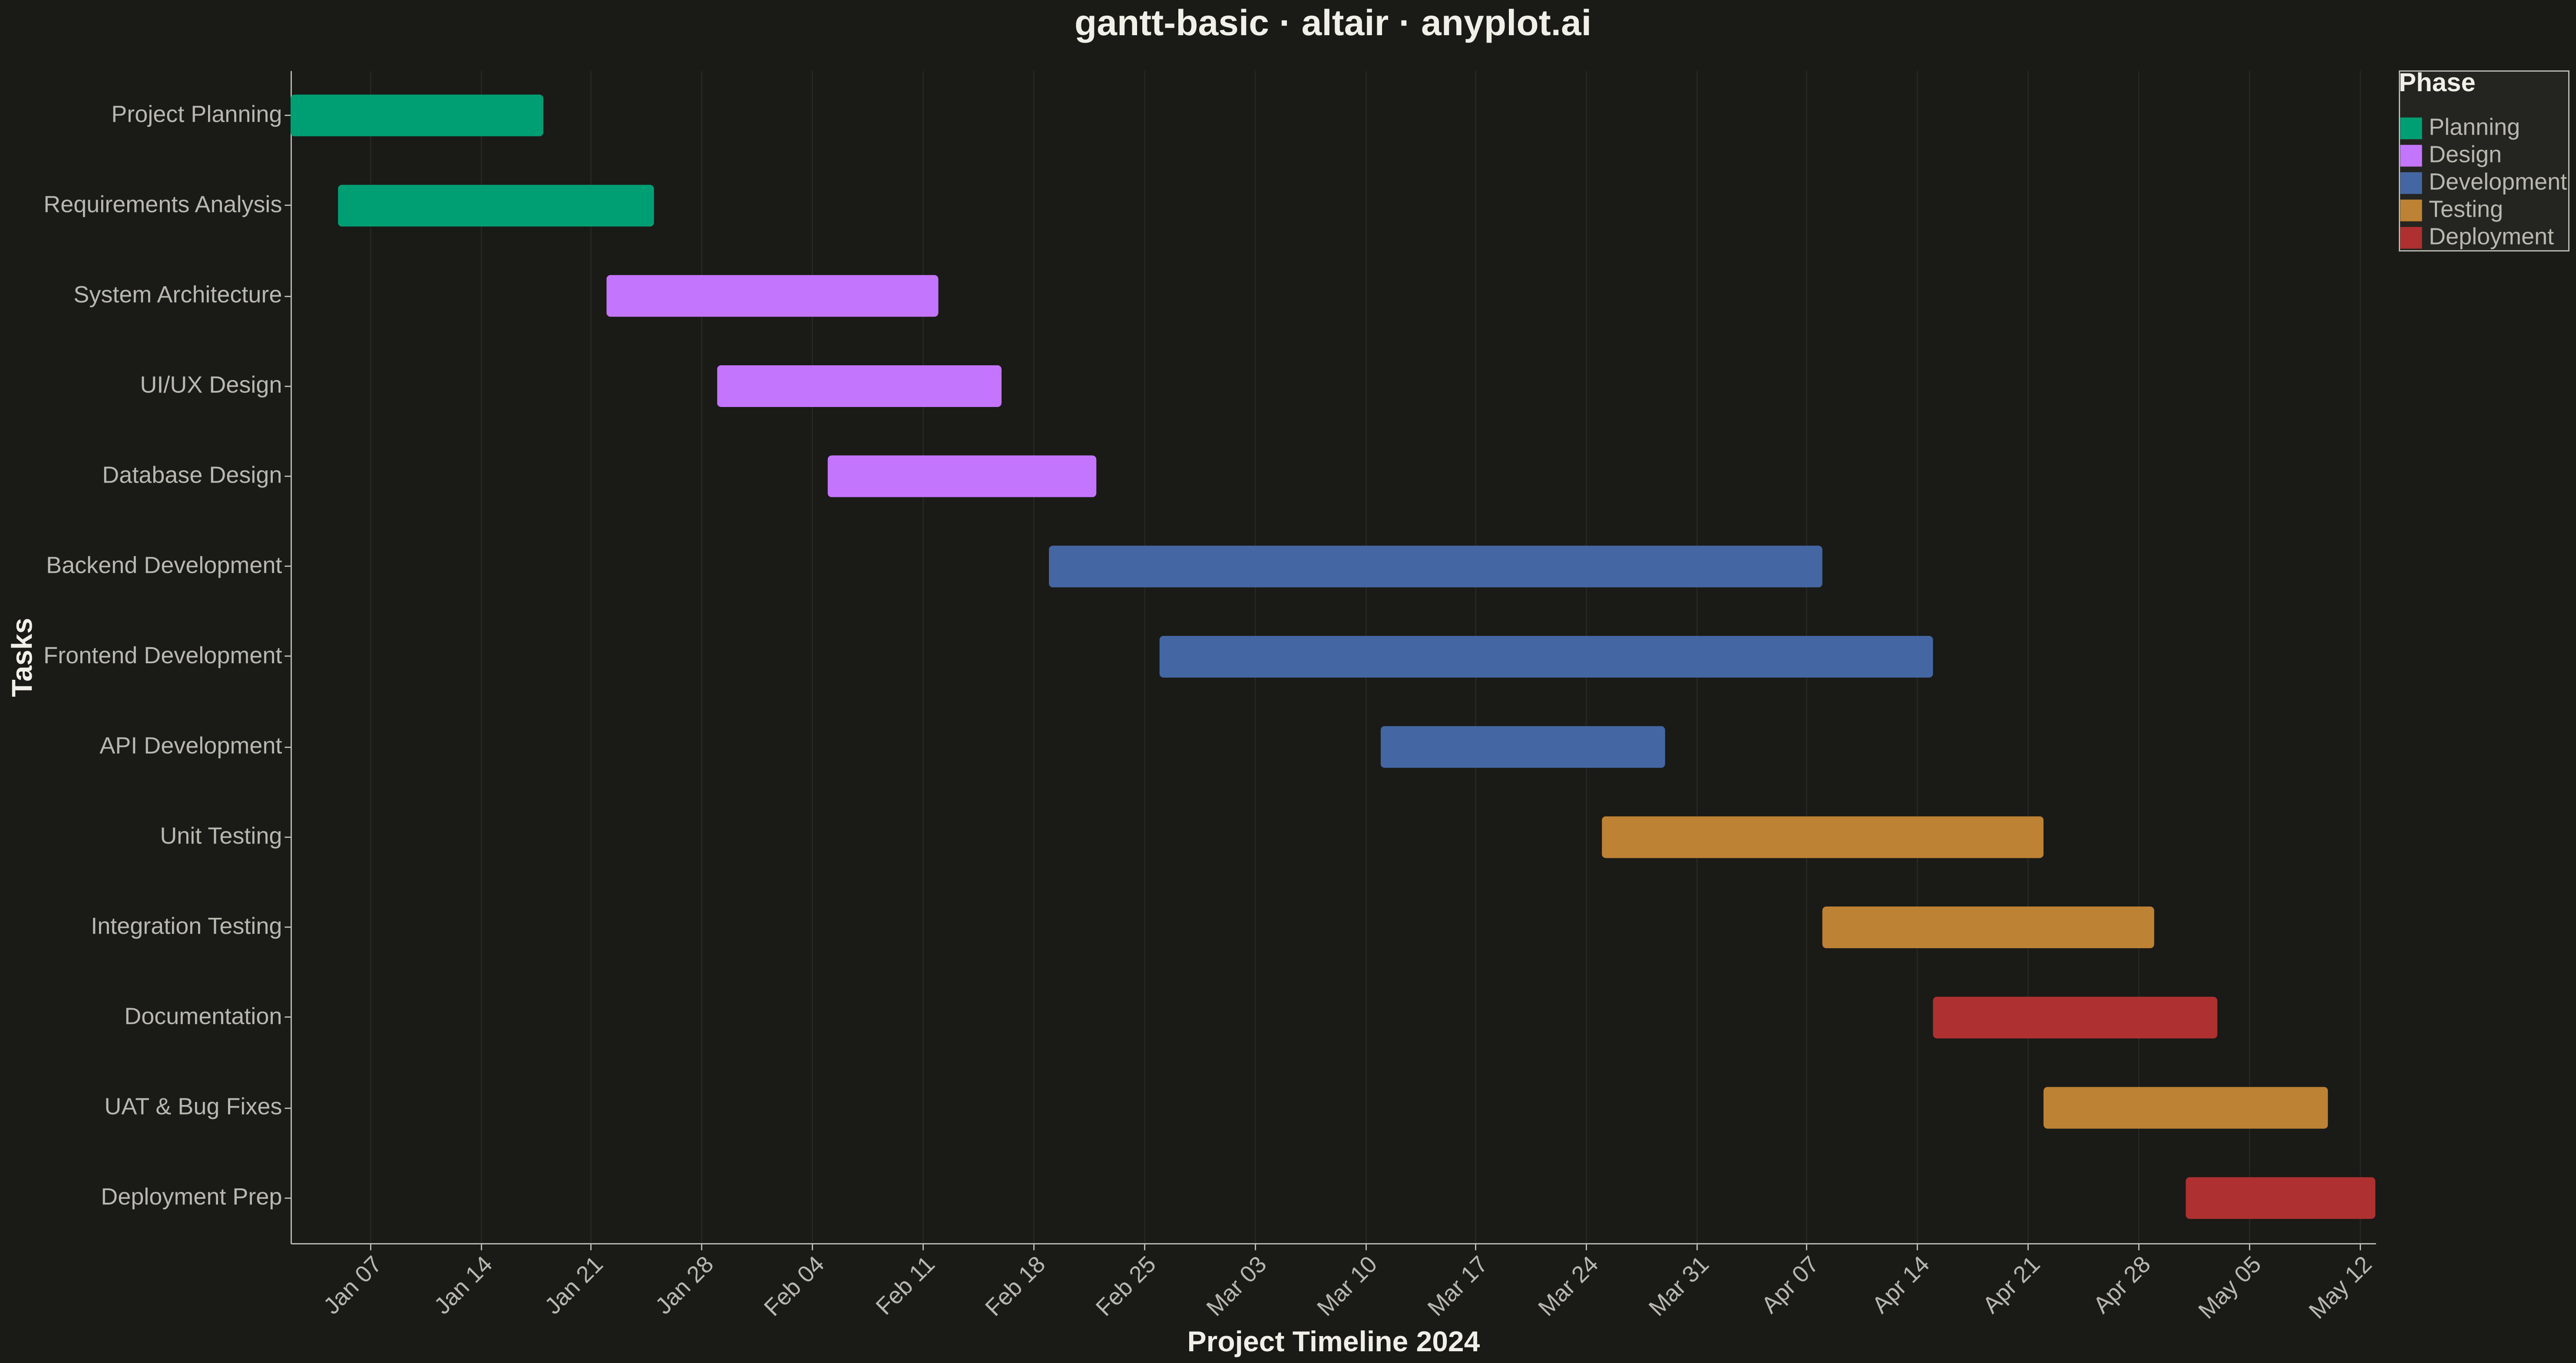
A Gantt chart is a horizontal bar chart that visualizes project schedules and timelines. Each task is represented as a horizontal bar spanning from its start date to end date, making it easy to see task durations, overlaps, and the overall project timeline at a glance. Gantt charts are essential for project management, helping teams understand task sequences and identify scheduling conflicts.
Preview render from the Altair implementation.