The same plot in 14 other libraries — JavaScript: Chart.js, D3.js, Highcharts, MUI X Charts; Python: Altair, Bokeh, lets-plot, Matplotlib, Plotly, plotnine, Pygal, Seaborn; R: ggplot2; Julia: Makie.jl. Compare all 15 side by side: Basic Gantt Chart in Python, R, Julia and JavaScript.
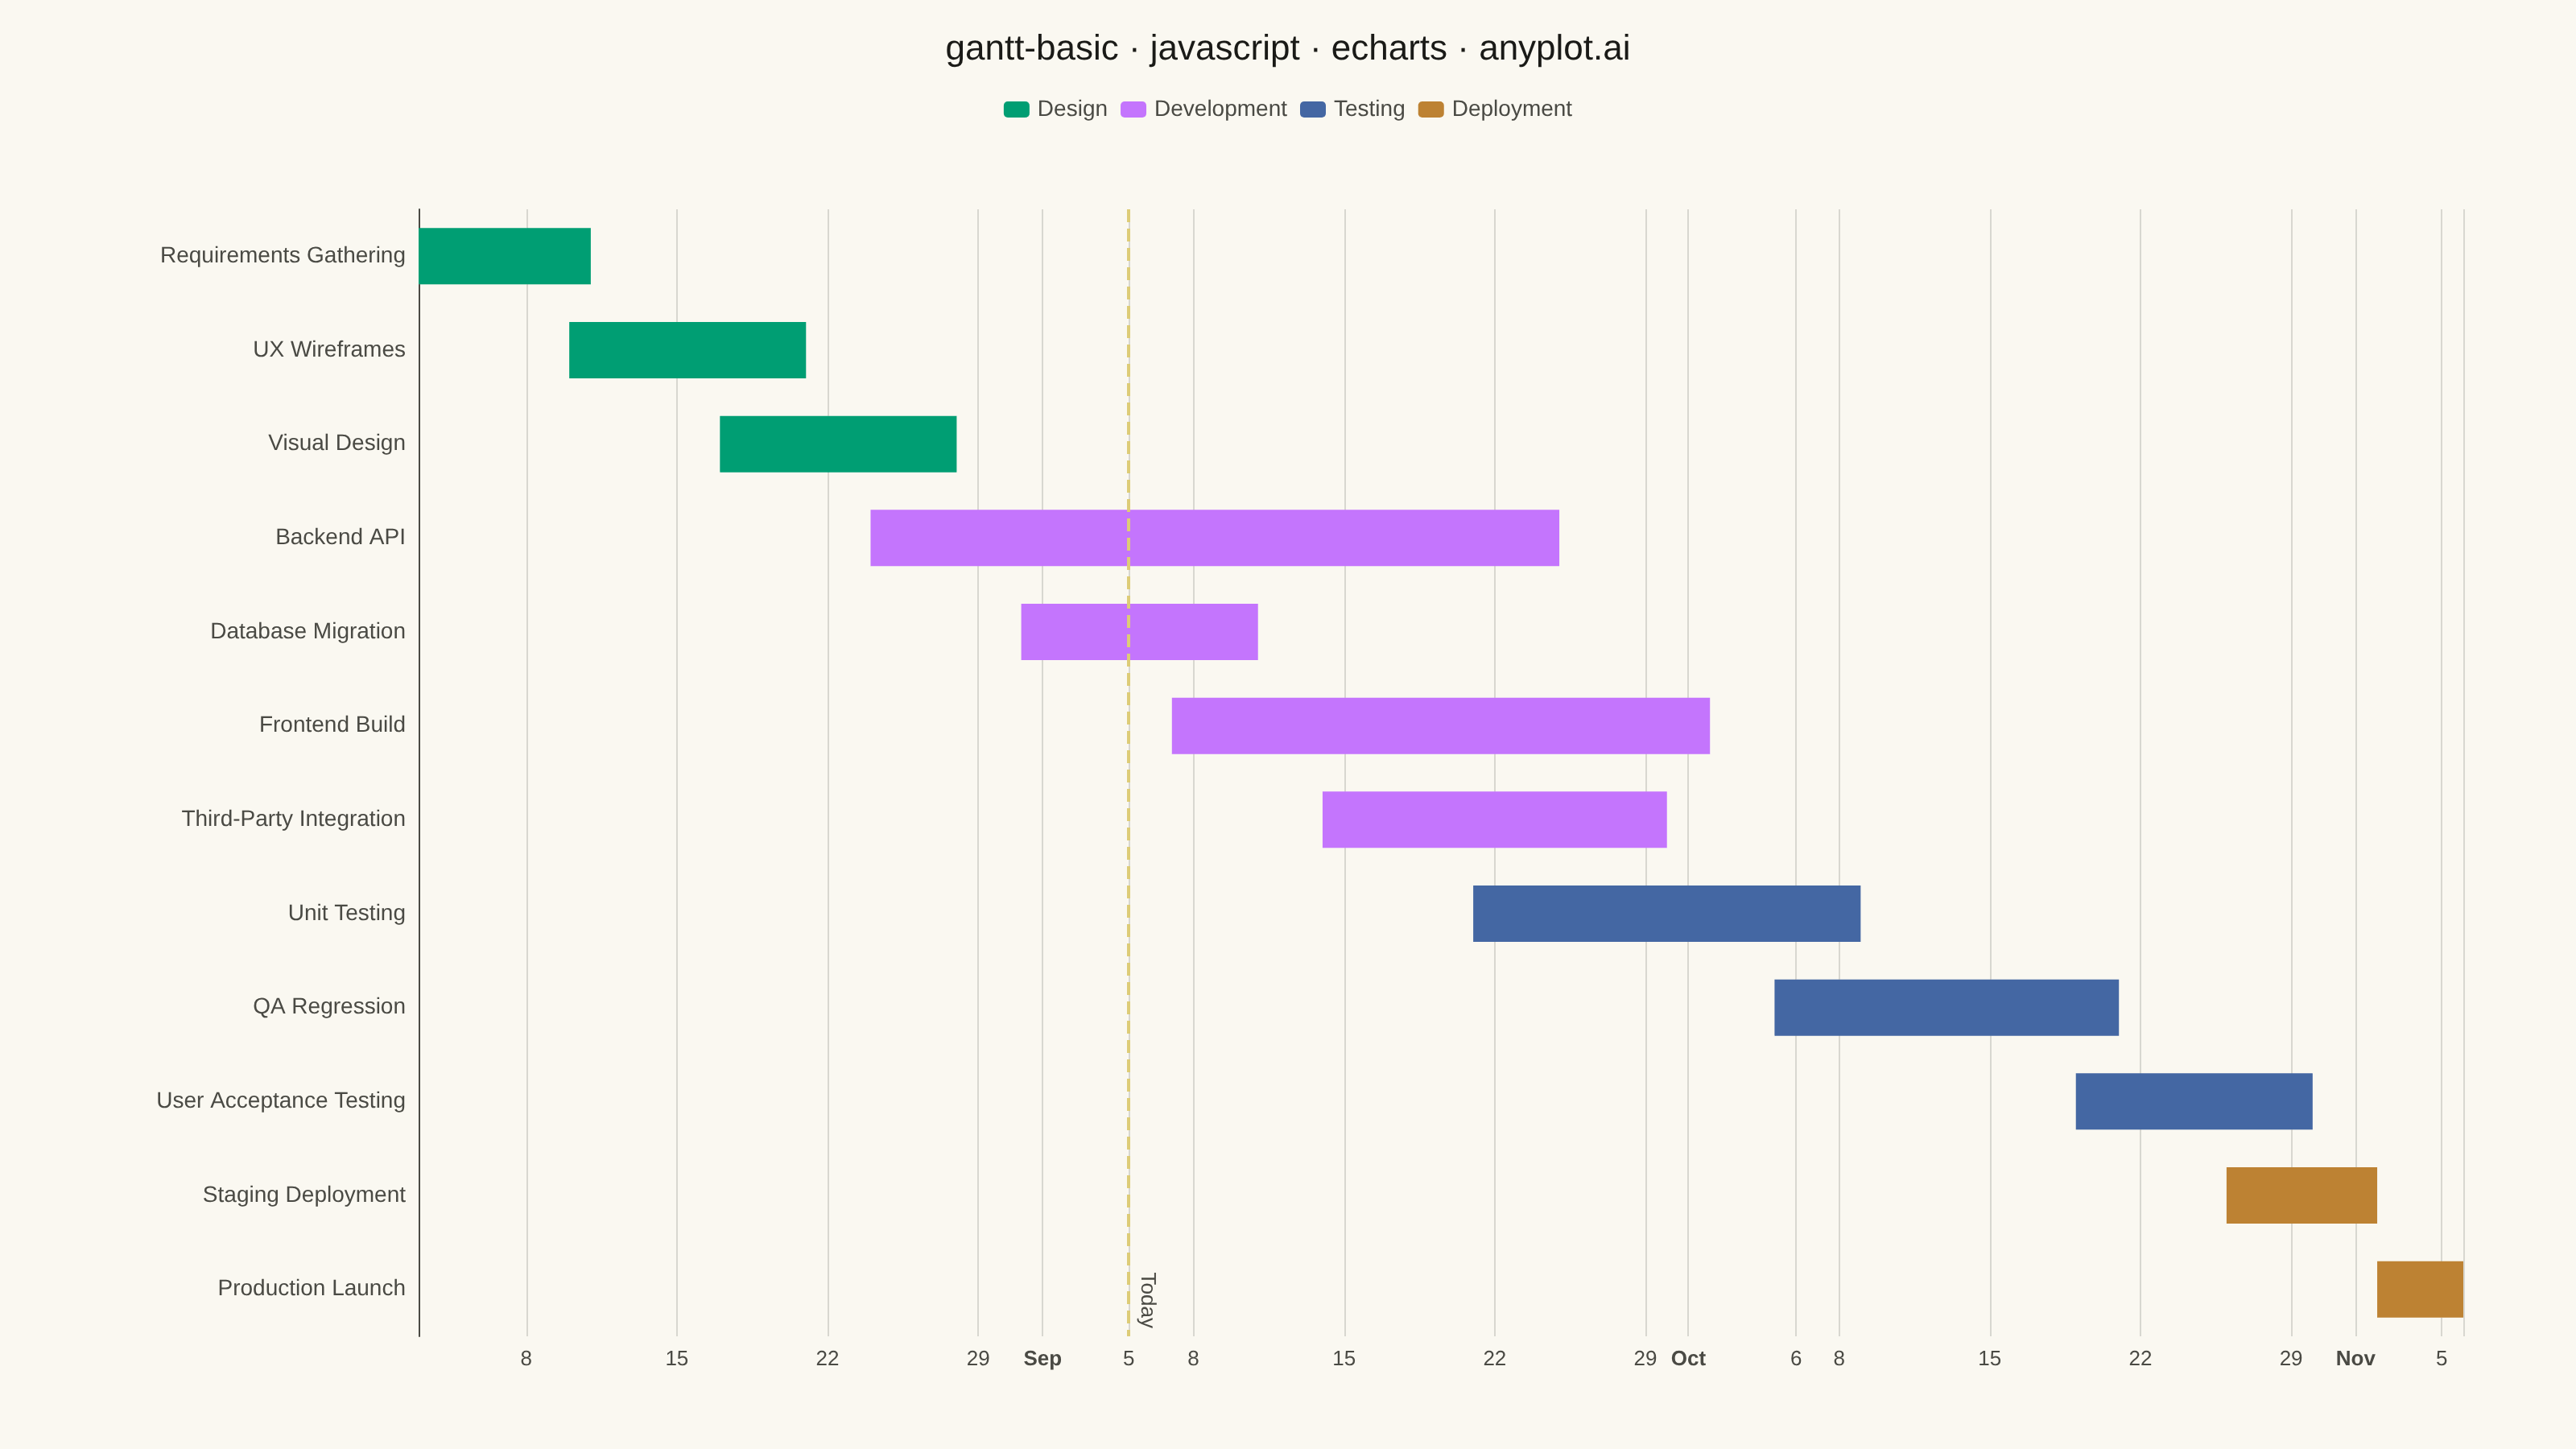
A Gantt chart is a horizontal bar chart that visualizes project schedules and timelines. Each task is represented as a horizontal bar spanning from its start date to end date, making it easy to see task durations, overlaps, and the overall project timeline at a glance. Gantt charts are essential for project management, helping teams understand task sequences and identify scheduling conflicts.
// anyplot.ai
// gantt-basic: Basic Gantt Chart
// Library: echarts 6.1.0 | JavaScript 22.23.2
// Quality: 91/100 | Created: 2026-09-05

//# anyplot-orientation: landscape
const t = window.ANYPLOT_TOKENS;

// --- Data (in-memory, deterministic) ---------------------------------------
const tasks = [
  { name: "Requirements Gathering", category: "Design", start: "2026-08-03", end: "2026-08-11" },
  { name: "UX Wireframes", category: "Design", start: "2026-08-10", end: "2026-08-21" },
  { name: "Visual Design", category: "Design", start: "2026-08-17", end: "2026-08-28" },
  { name: "Backend API", category: "Development", start: "2026-08-24", end: "2026-09-25" },
  { name: "Database Migration", category: "Development", start: "2026-08-31", end: "2026-09-11" },
  { name: "Frontend Build", category: "Development", start: "2026-09-07", end: "2026-10-02" },
  { name: "Third-Party Integration", category: "Development", start: "2026-09-14", end: "2026-09-30" },
  { name: "Unit Testing", category: "Testing", start: "2026-09-21", end: "2026-10-09" },
  { name: "QA Regression", category: "Testing", start: "2026-10-05", end: "2026-10-21" },
  { name: "User Acceptance Testing", category: "Testing", start: "2026-10-19", end: "2026-10-30" },
  { name: "Staging Deployment", category: "Deployment", start: "2026-10-26", end: "2026-11-02" },
  { name: "Production Launch", category: "Deployment", start: "2026-11-02", end: "2026-11-06" },
];

const categories = ["Design", "Development", "Testing", "Deployment"];
const categoryColor = {
  Design: t.palette[0],
  Development: t.palette[1],
  Testing: t.palette[2],
  Deployment: t.palette[3],
};
const taskNames = tasks.map((task) => task.name);
const today = new Date("2026-09-05").getTime();

// --- Render item: one rectangle per task, spanning [start, end] on the time axis
function renderTaskBar(params, api) {
  const categoryIndex = api.value(0);
  const start = api.coord([api.value(1), categoryIndex]);
  const end = api.coord([api.value(2), categoryIndex]);
  const barHeight = api.size([0, 1])[1] * 0.6;
  const rectShape = echarts.graphic.clipRectByRect(
    { x: start[0], y: start[1] - barHeight / 2, width: end[0] - start[0], height: barHeight },
    { x: params.coordSys.x, y: params.coordSys.y, width: params.coordSys.width, height: params.coordSys.height }
  );
  return rectShape && { type: "rect", shape: rectShape, style: api.style() };
}

// One series per category — gives the legend a color-coded swatch per group
const series = categories.map((category, categoryPos) => ({
  name: category,
  type: "custom",
  renderItem: renderTaskBar,
  itemStyle: { color: categoryColor[category] },
  encode: { x: [1, 2], y: 0 },
  data: tasks
    .map((task, taskIndex) => ({ task, taskIndex }))
    .filter(({ task }) => task.category === category)
    .map(({ task, taskIndex }) => [taskIndex, task.start, task.end, task.name]),
  markLine:
    categoryPos === categories.length - 1
      ? {
          silent: true,
          symbol: "none",
          lineStyle: { color: t.amber, type: "dashed", width: 2 },
          label: { formatter: "Today", color: t.inkSoft, fontSize: 13, position: "insideEndTop" },
          data: [{ xAxis: today }],
        }
      : undefined,
}));

// --- Init -------------------------------------------------------------------
const chart = echarts.init(document.getElementById("container"));

// --- Option -----------------------------------------------------------------
chart.setOption({
  animation: false,
  backgroundColor: "transparent",
  title: {
    text: "gantt-basic · javascript · echarts · anyplot.ai",
    left: "center",
    textStyle: { color: t.ink, fontSize: 22, fontWeight: 500 },
  },
  legend: {
    data: categories,
    top: 56,
    textStyle: { color: t.inkSoft, fontSize: 14 },
    itemWidth: 16,
    itemHeight: 10,
  },
  grid: { left: 260, right: 70, top: 130, bottom: 70 },
  xAxis: {
    type: "time",
    axisLabel: { color: t.inkSoft, fontSize: 13 },
    axisLine: { lineStyle: { color: t.inkSoft } },
    splitLine: { show: true, lineStyle: { color: t.grid } },
  },
  yAxis: {
    type: "category",
    data: taskNames,
    inverse: true,
    axisLabel: { color: t.inkSoft, fontSize: 14 },
    axisLine: { lineStyle: { color: t.inkSoft } },
    splitLine: { show: false },
  },
  series,
});
Runnable source as JSON, for any HTTP client: https://api.anyplot.ai/specs/gantt-basic/echarts/code. Any spec id and library id listed in llms-full.txt fit the same URL shape; every URL below is complete and callable.
{
  "spec_id": "gantt-basic",
  "language": "javascript",
  "library": "echarts",
  "page": "https://anyplot.ai/gantt-basic/javascript/echarts",
  "hub": "https://anyplot.ai/gantt-basic",
  "code_json": "https://api.anyplot.ai/specs/gantt-basic/echarts/code",
  "spec_json": "https://api.anyplot.ai/specs/gantt-basic",
  "render_light_png": "https://storage.googleapis.com/anyplot-images/plots/gantt-basic/javascript/echarts/plot-light.png",
  "render_dark_png": "https://storage.googleapis.com/anyplot-images/plots/gantt-basic/javascript/echarts/plot-dark.png",
  "interactive_light_html": "https://storage.googleapis.com/anyplot-images/plots/gantt-basic/javascript/echarts/plot-light.html",
  "interactive_dark_html": "https://storage.googleapis.com/anyplot-images/plots/gantt-basic/javascript/echarts/plot-dark.html",
  "quality_score": 91.0,
  "license": "MIT",
  "guide": "https://anyplot.ai/llms.txt"
}
Part of Basic Gantt Chart on anyplot.ai.