The same plot in 14 other libraries — JavaScript: Chart.js, D3.js, Apache ECharts, Highcharts; Python: Altair, Bokeh, lets-plot, Matplotlib, Plotly, plotnine, Pygal, Seaborn; R: ggplot2; Julia: Makie.jl. Compare all 15 side by side: Basic Gantt Chart in Python, R, Julia and JavaScript.
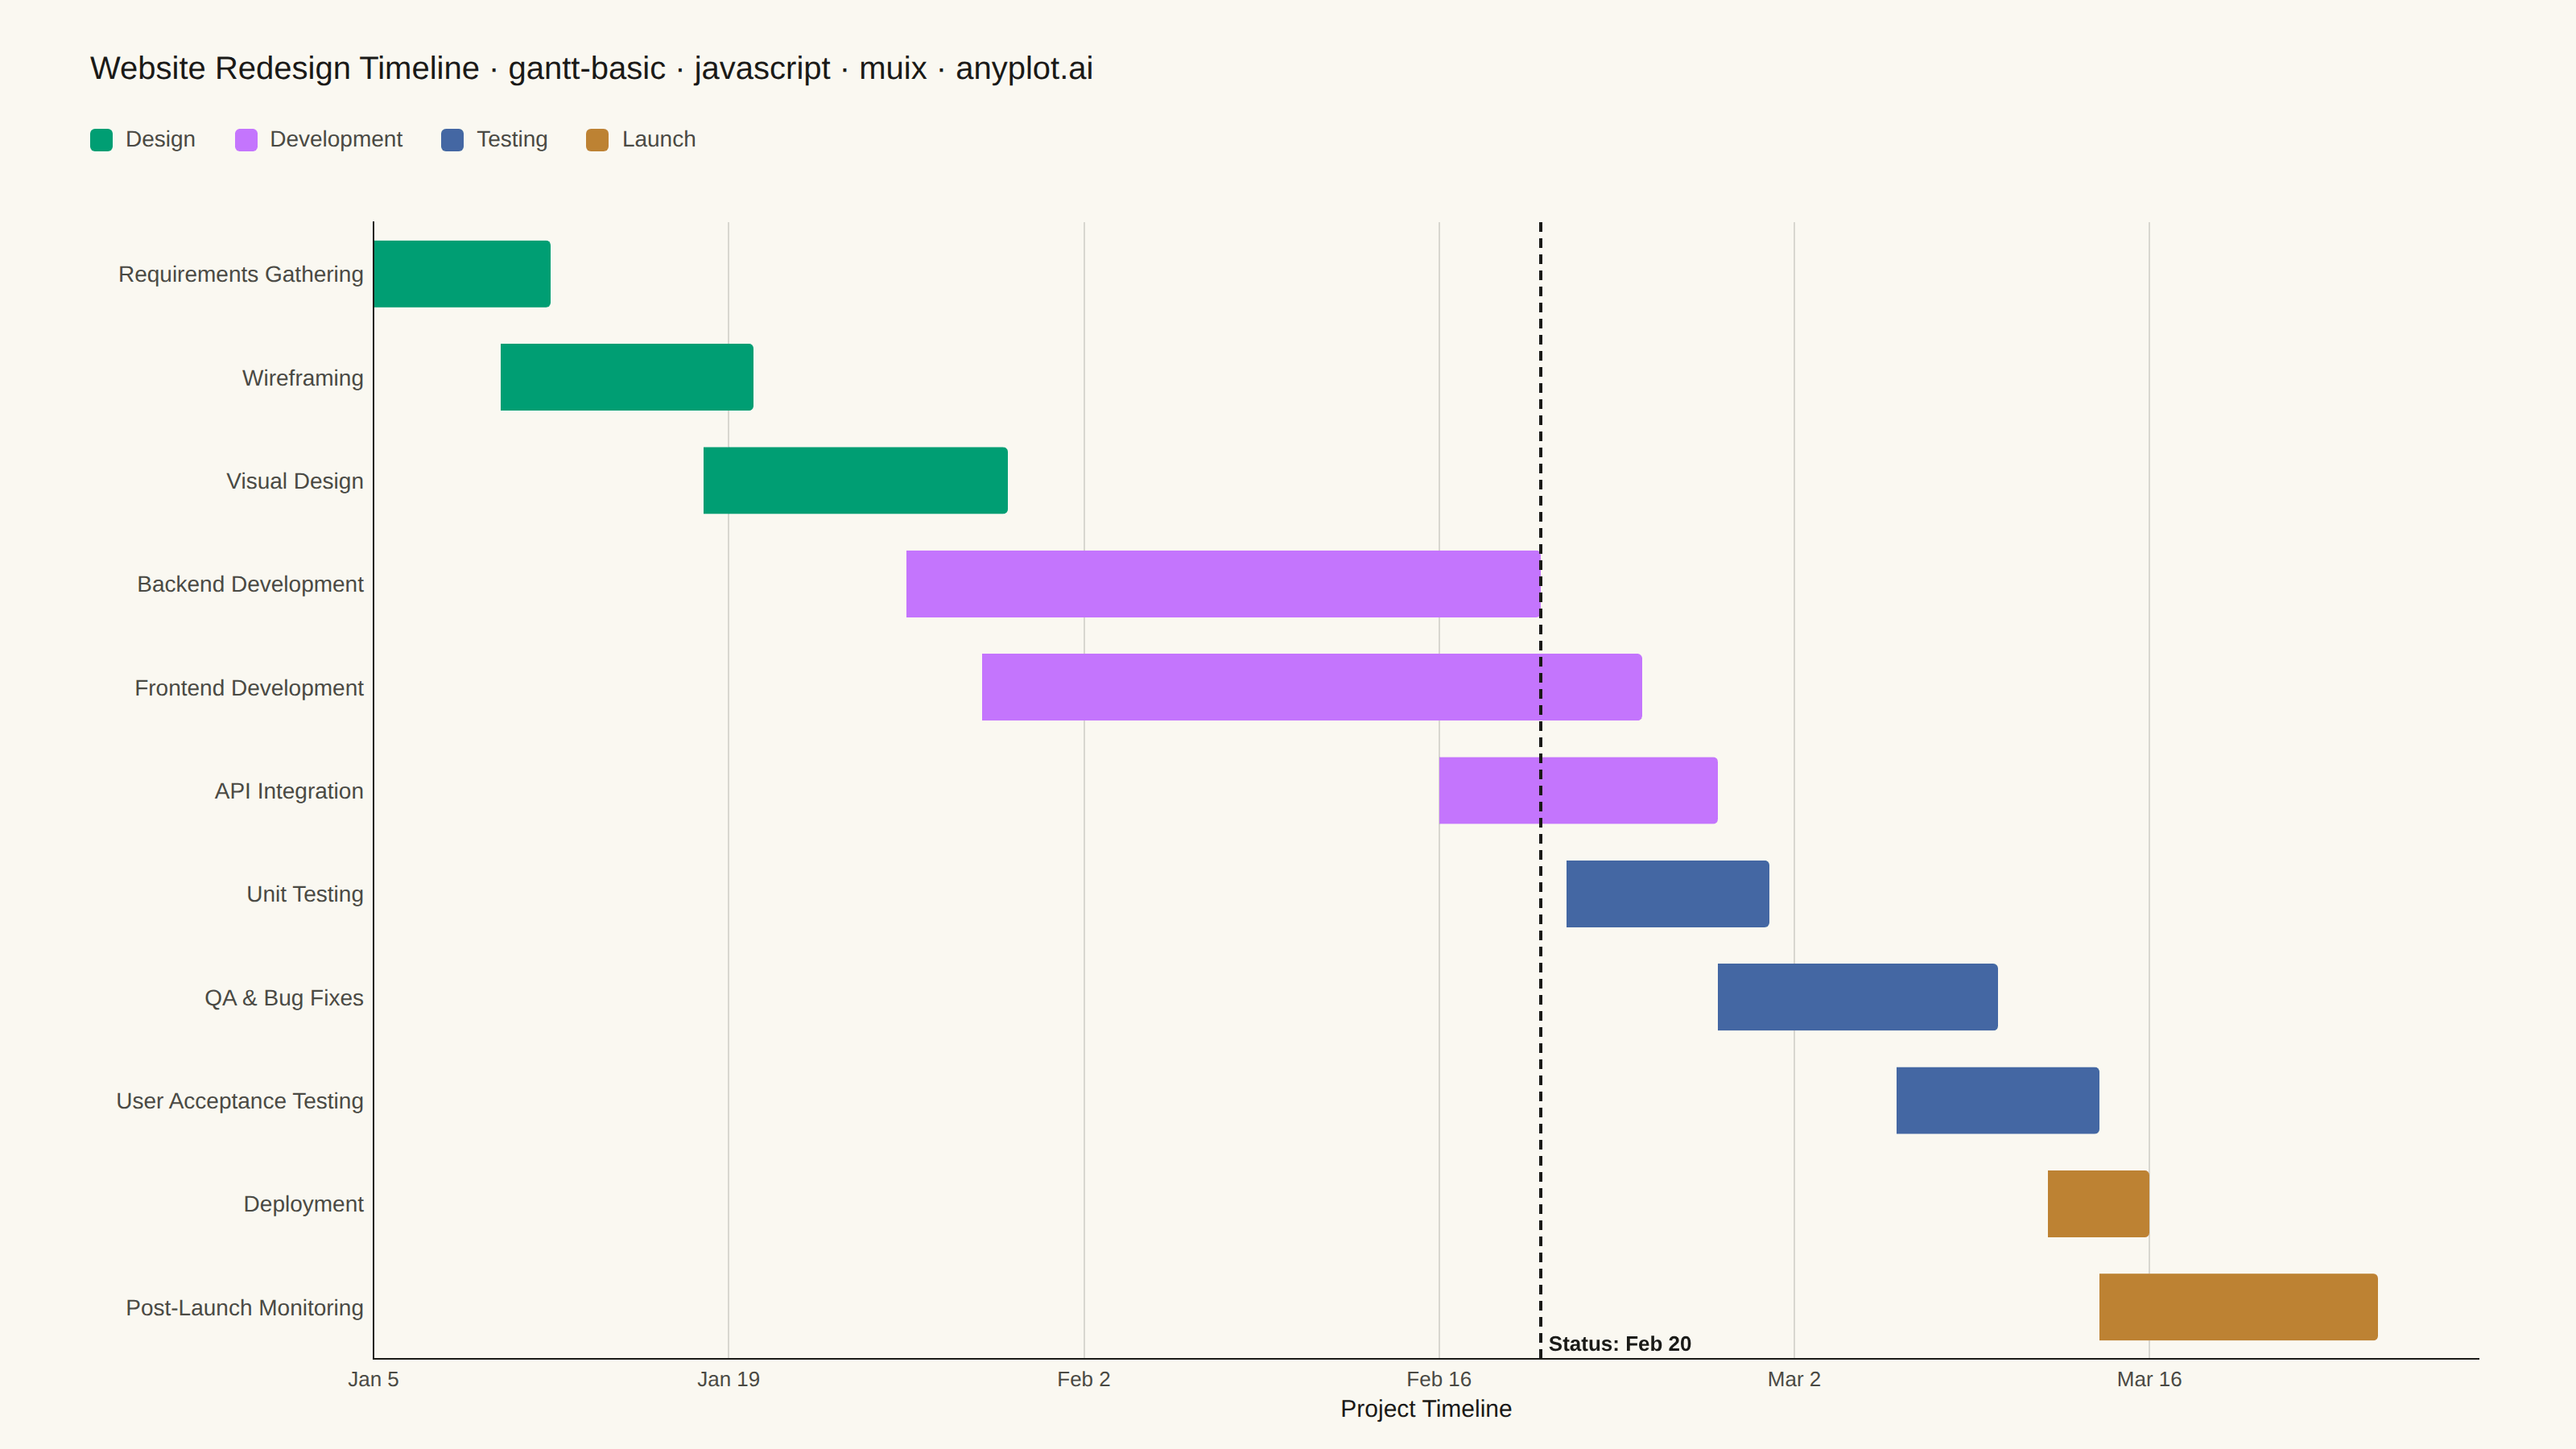
A Gantt chart is a horizontal bar chart that visualizes project schedules and timelines. Each task is represented as a horizontal bar spanning from its start date to end date, making it easy to see task durations, overlaps, and the overall project timeline at a glance. Gantt charts are essential for project management, helping teams understand task sequences and identify scheduling conflicts.
// anyplot.ai
// gantt-basic: Basic Gantt Chart
// Library: muix 7.29.1 | JavaScript 22.23.2
// Quality: 88/100 | Created: 2026-09-05
import { BarChart } from "@mui/x-charts/BarChart";
import { ChartsReferenceLine } from "@mui/x-charts/ChartsReferenceLine";
import Box from "@mui/material/Box";
import Stack from "@mui/material/Stack";
import Typography from "@mui/material/Typography";

const t = window.ANYPLOT_TOKENS;

// --- Data (in-memory, deterministic) ----------------------------------------
// Website redesign project: 11 tasks across 4 phases, day-offsets from the
// project kickoff (Jan 5, 2026 = day 0) so the x-axis is a plain linear scale
// that a valueFormatter renders back as calendar dates.
const DAY_MS = 86400000;
const toDay = (year, month, date) => Date.UTC(year, month, date) / DAY_MS;
const PROJECT_START = toDay(2026, 0, 5);

const CATEGORIES = ["Design", "Development", "Testing", "Launch"];
const CATEGORY_COLOR = Object.fromEntries(CATEGORIES.map((category, i) => [category, t.palette[i]]));

const TASKS = [
  { task: "Requirements Gathering", category: "Design", start: [2026, 0, 5], end: [2026, 0, 12] },
  { task: "Wireframing", category: "Design", start: [2026, 0, 10], end: [2026, 0, 20] },
  { task: "Visual Design", category: "Design", start: [2026, 0, 18], end: [2026, 0, 30] },
  { task: "Backend Development", category: "Development", start: [2026, 0, 26], end: [2026, 1, 20] },
  { task: "Frontend Development", category: "Development", start: [2026, 0, 29], end: [2026, 1, 24] },
  { task: "API Integration", category: "Development", start: [2026, 1, 16], end: [2026, 1, 27] },
  { task: "Unit Testing", category: "Testing", start: [2026, 1, 21], end: [2026, 2, 1] },
  { task: "QA & Bug Fixes", category: "Testing", start: [2026, 1, 27], end: [2026, 2, 10] },
  { task: "User Acceptance Testing", category: "Testing", start: [2026, 2, 6], end: [2026, 2, 14] },
  { task: "Deployment", category: "Launch", start: [2026, 2, 12], end: [2026, 2, 16] },
  { task: "Post-Launch Monitoring", category: "Launch", start: [2026, 2, 14], end: [2026, 2, 25] },
].map((row) => ({
  task: row.task,
  category: row.category,
  start: toDay(...row.start) - PROJECT_START,
  end: toDay(...row.end) - PROJECT_START,
}));

const TASK_NAMES = TASKS.map((row) => row.task);
const MAX_DAY = Math.max(...TASKS.map((row) => row.end));
const STATUS_DAY = toDay(2026, 1, 20) - PROJECT_START;

const dateFormatter = new Intl.DateTimeFormat("en-US", { month: "short", day: "numeric", timeZone: "UTC" });
const formatDay = (offsetDays) => dateFormatter.format(new Date((PROJECT_START + offsetDays) * DAY_MS));

const TICKS = [];
for (let d = 0; d <= MAX_DAY; d += 14) TICKS.push(d);

// --- Series: an invisible "offset" segment (start of timeline -> task start)
// stacked with, per category, a solid "duration" segment — null everywhere
// except the row that belongs to it — so each task lands as a floating bar
// at its correct start/end day offsets. --------------------------------------
const OFFSET_SERIES = {
  id: "offset",
  stack: "timeline",
  color: "transparent",
  data: TASKS.map((row) => row.start),
  valueFormatter: () => null,
};

const CATEGORY_SERIES = CATEGORIES.map((category) => ({
  id: category,
  label: category,
  stack: "timeline",
  color: CATEGORY_COLOR[category],
  data: TASKS.map((row) => (row.category === category ? row.end - row.start : null)),
  valueFormatter: (value, { dataIndex }) =>
    value == null ? null : `${formatDay(TASKS[dataIndex].start)} – ${formatDay(TASKS[dataIndex].end)}`,
}));

// --- Chart (default-exported component — the harness mounts it) ------------
export default function Chart() {
  const W = window.ANYPLOT_SIZE.width;
  const H = window.ANYPLOT_SIZE.height;
  const TITLE_TOP = 28;
  const LEGEND_TOP = 76;
  const CHART_TOP = 104;

  const title = "Website Redesign Timeline · gantt-basic · javascript · muix · anyplot.ai";
  const titleSize = title.length > 67 ? Math.round((26 * 67) / title.length) : 26;

  return (
    <Box sx={{ position: "relative", width: W, height: H, bgcolor: t.pageBg }}>
      <Box sx={{ position: "absolute", top: TITLE_TOP, left: 56, right: 56 }}>
        <Typography sx={{ color: t.ink, fontSize: titleSize, fontWeight: 500 }}>{title}</Typography>
      </Box>

      <Stack direction="row" spacing={3} sx={{ position: "absolute", top: LEGEND_TOP, left: 56, right: 56 }}>
        {CATEGORIES.map((category) => (
          <Stack key={category} direction="row" spacing={1} alignItems="center">
            <Box sx={{ width: 14, height: 14, borderRadius: "3px", bgcolor: CATEGORY_COLOR[category] }} />
            <Typography sx={{ color: t.inkSoft, fontSize: 14 }}>{category}</Typography>
          </Stack>
        ))}
      </Stack>

      <Box sx={{ position: "absolute", top: CHART_TOP, left: 0, right: 0, bottom: 0 }}>
        <BarChart
          width={W}
          height={H - CHART_TOP}
          layout="horizontal"
          skipAnimation
          borderRadius={3}
          series={[OFFSET_SERIES, ...CATEGORY_SERIES]}
          grid={{ vertical: true }}
          xAxis={[
            {
              min: 0,
              max: MAX_DAY + 4,
              tickInterval: TICKS,
              valueFormatter: (value) => formatDay(value),
              label: "Project Timeline",
              labelStyle: { fontSize: 15, fill: t.ink },
              tickLabelStyle: { fontSize: 13, fill: t.inkSoft },
              disableTicks: true,
            },
          ]}
          yAxis={[
            {
              scaleType: "band",
              data: TASK_NAMES,
              tickLabelStyle: { fontSize: 14, fill: t.inkSoft },
              disableTicks: true,
              categoryGapRatio: 0.35,
            },
          ]}
          margin={{ top: 16, right: 60, bottom: 56, left: 232 }}
          slotProps={{ legend: { hidden: true } }}
          sx={{
            "& .MuiChartsAxis-line": { stroke: t.inkSoft },
            "& .MuiChartsGrid-line": { stroke: t.grid },
          }}
        >
          <ChartsReferenceLine
            x={STATUS_DAY}
            label={`Status: ${formatDay(STATUS_DAY)}`}
            labelAlign="end"
            lineStyle={{ stroke: t.ink, strokeDasharray: "6 4", strokeWidth: 2 }}
            labelStyle={{ fontSize: 13, fill: t.ink, fontWeight: 600 }}
          />
        </BarChart>
      </Box>
    </Box>
  );
}
Runnable source as JSON, for any HTTP client: https://api.anyplot.ai/specs/gantt-basic/muix/code. Any spec id and library id listed in llms-full.txt fit the same URL shape; every URL below is complete and callable.
{
  "spec_id": "gantt-basic",
  "language": "javascript",
  "library": "muix",
  "page": "https://anyplot.ai/gantt-basic/javascript/muix",
  "hub": "https://anyplot.ai/gantt-basic",
  "code_json": "https://api.anyplot.ai/specs/gantt-basic/muix/code",
  "spec_json": "https://api.anyplot.ai/specs/gantt-basic",
  "render_light_png": "https://storage.googleapis.com/anyplot-images/plots/gantt-basic/javascript/muix/plot-light.png",
  "render_dark_png": "https://storage.googleapis.com/anyplot-images/plots/gantt-basic/javascript/muix/plot-dark.png",
  "interactive_light_html": "https://storage.googleapis.com/anyplot-images/plots/gantt-basic/javascript/muix/plot-light.html",
  "interactive_dark_html": "https://storage.googleapis.com/anyplot-images/plots/gantt-basic/javascript/muix/plot-dark.html",
  "quality_score": 88.0,
  "license": "MIT",
  "guide": "https://anyplot.ai/llms.txt"
}
Part of Basic Gantt Chart on anyplot.ai.