The same plot in 14 other libraries — JavaScript: Chart.js, D3.js, Apache ECharts, MUI X Charts; Python: Altair, Bokeh, lets-plot, Matplotlib, Plotly, plotnine, Pygal, Seaborn; R: ggplot2; Julia: Makie.jl. Compare all 15 side by side: Basic Gantt Chart in Python, R, Julia and JavaScript.
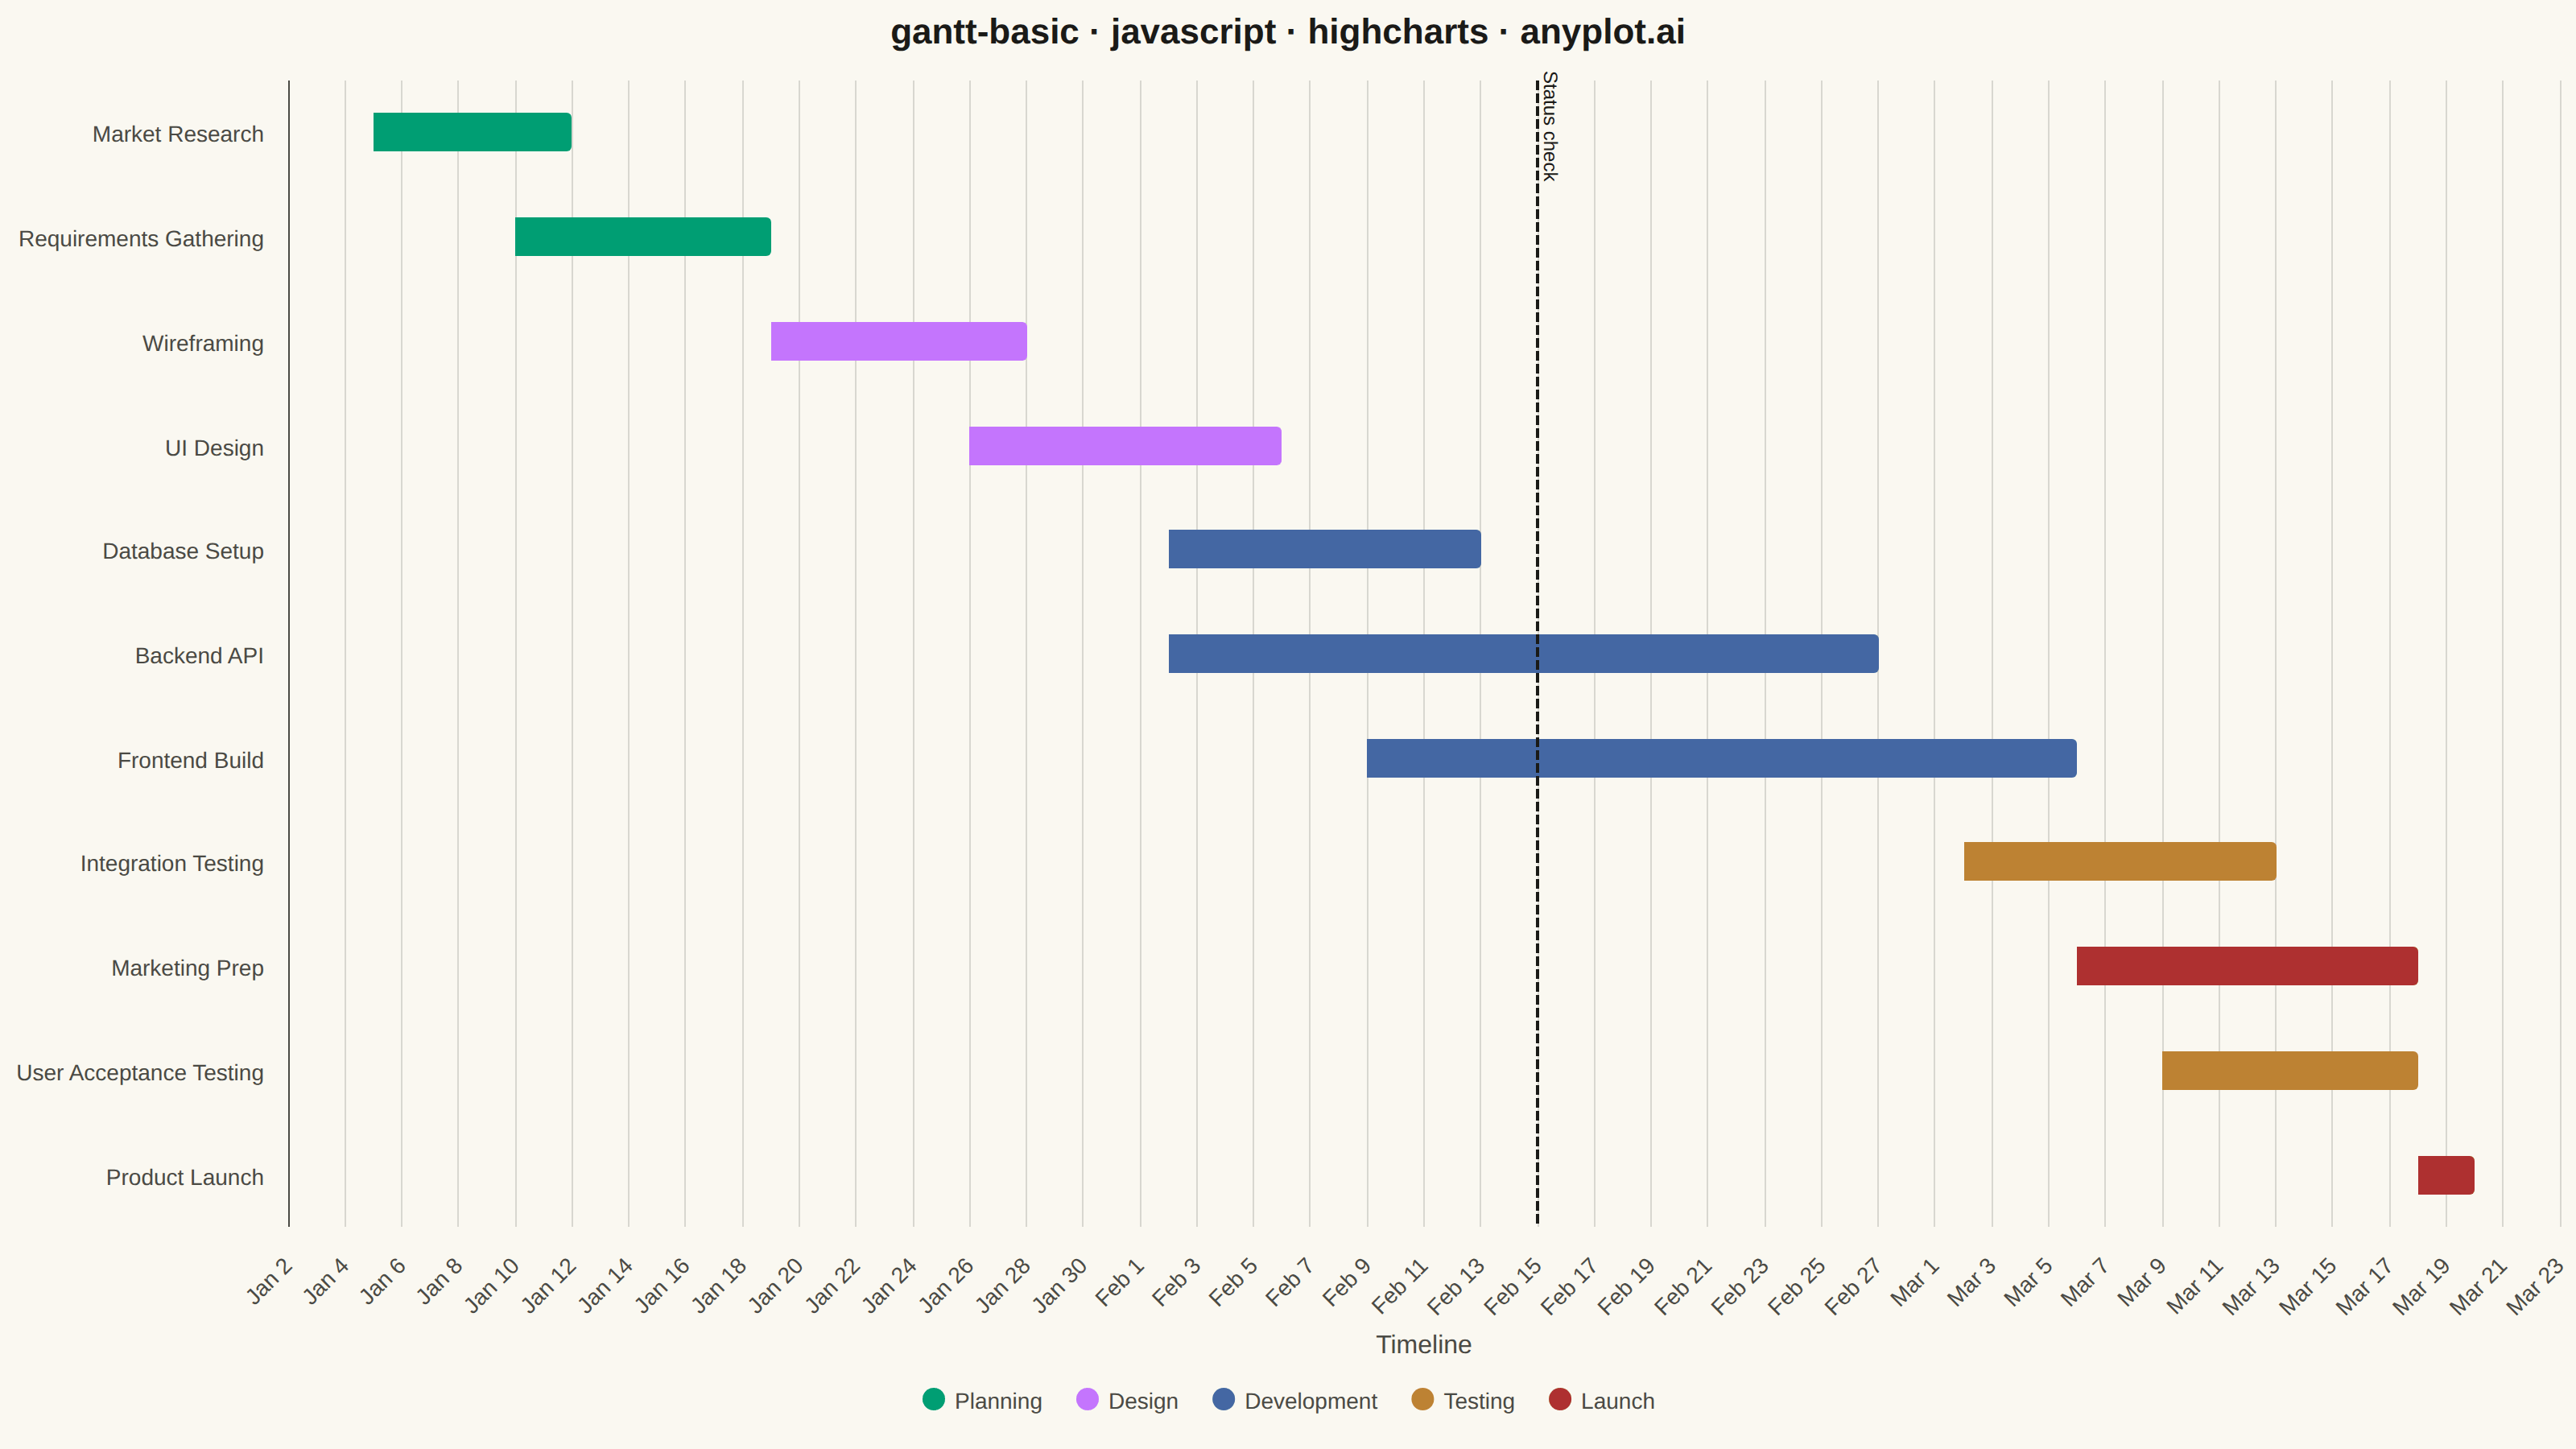
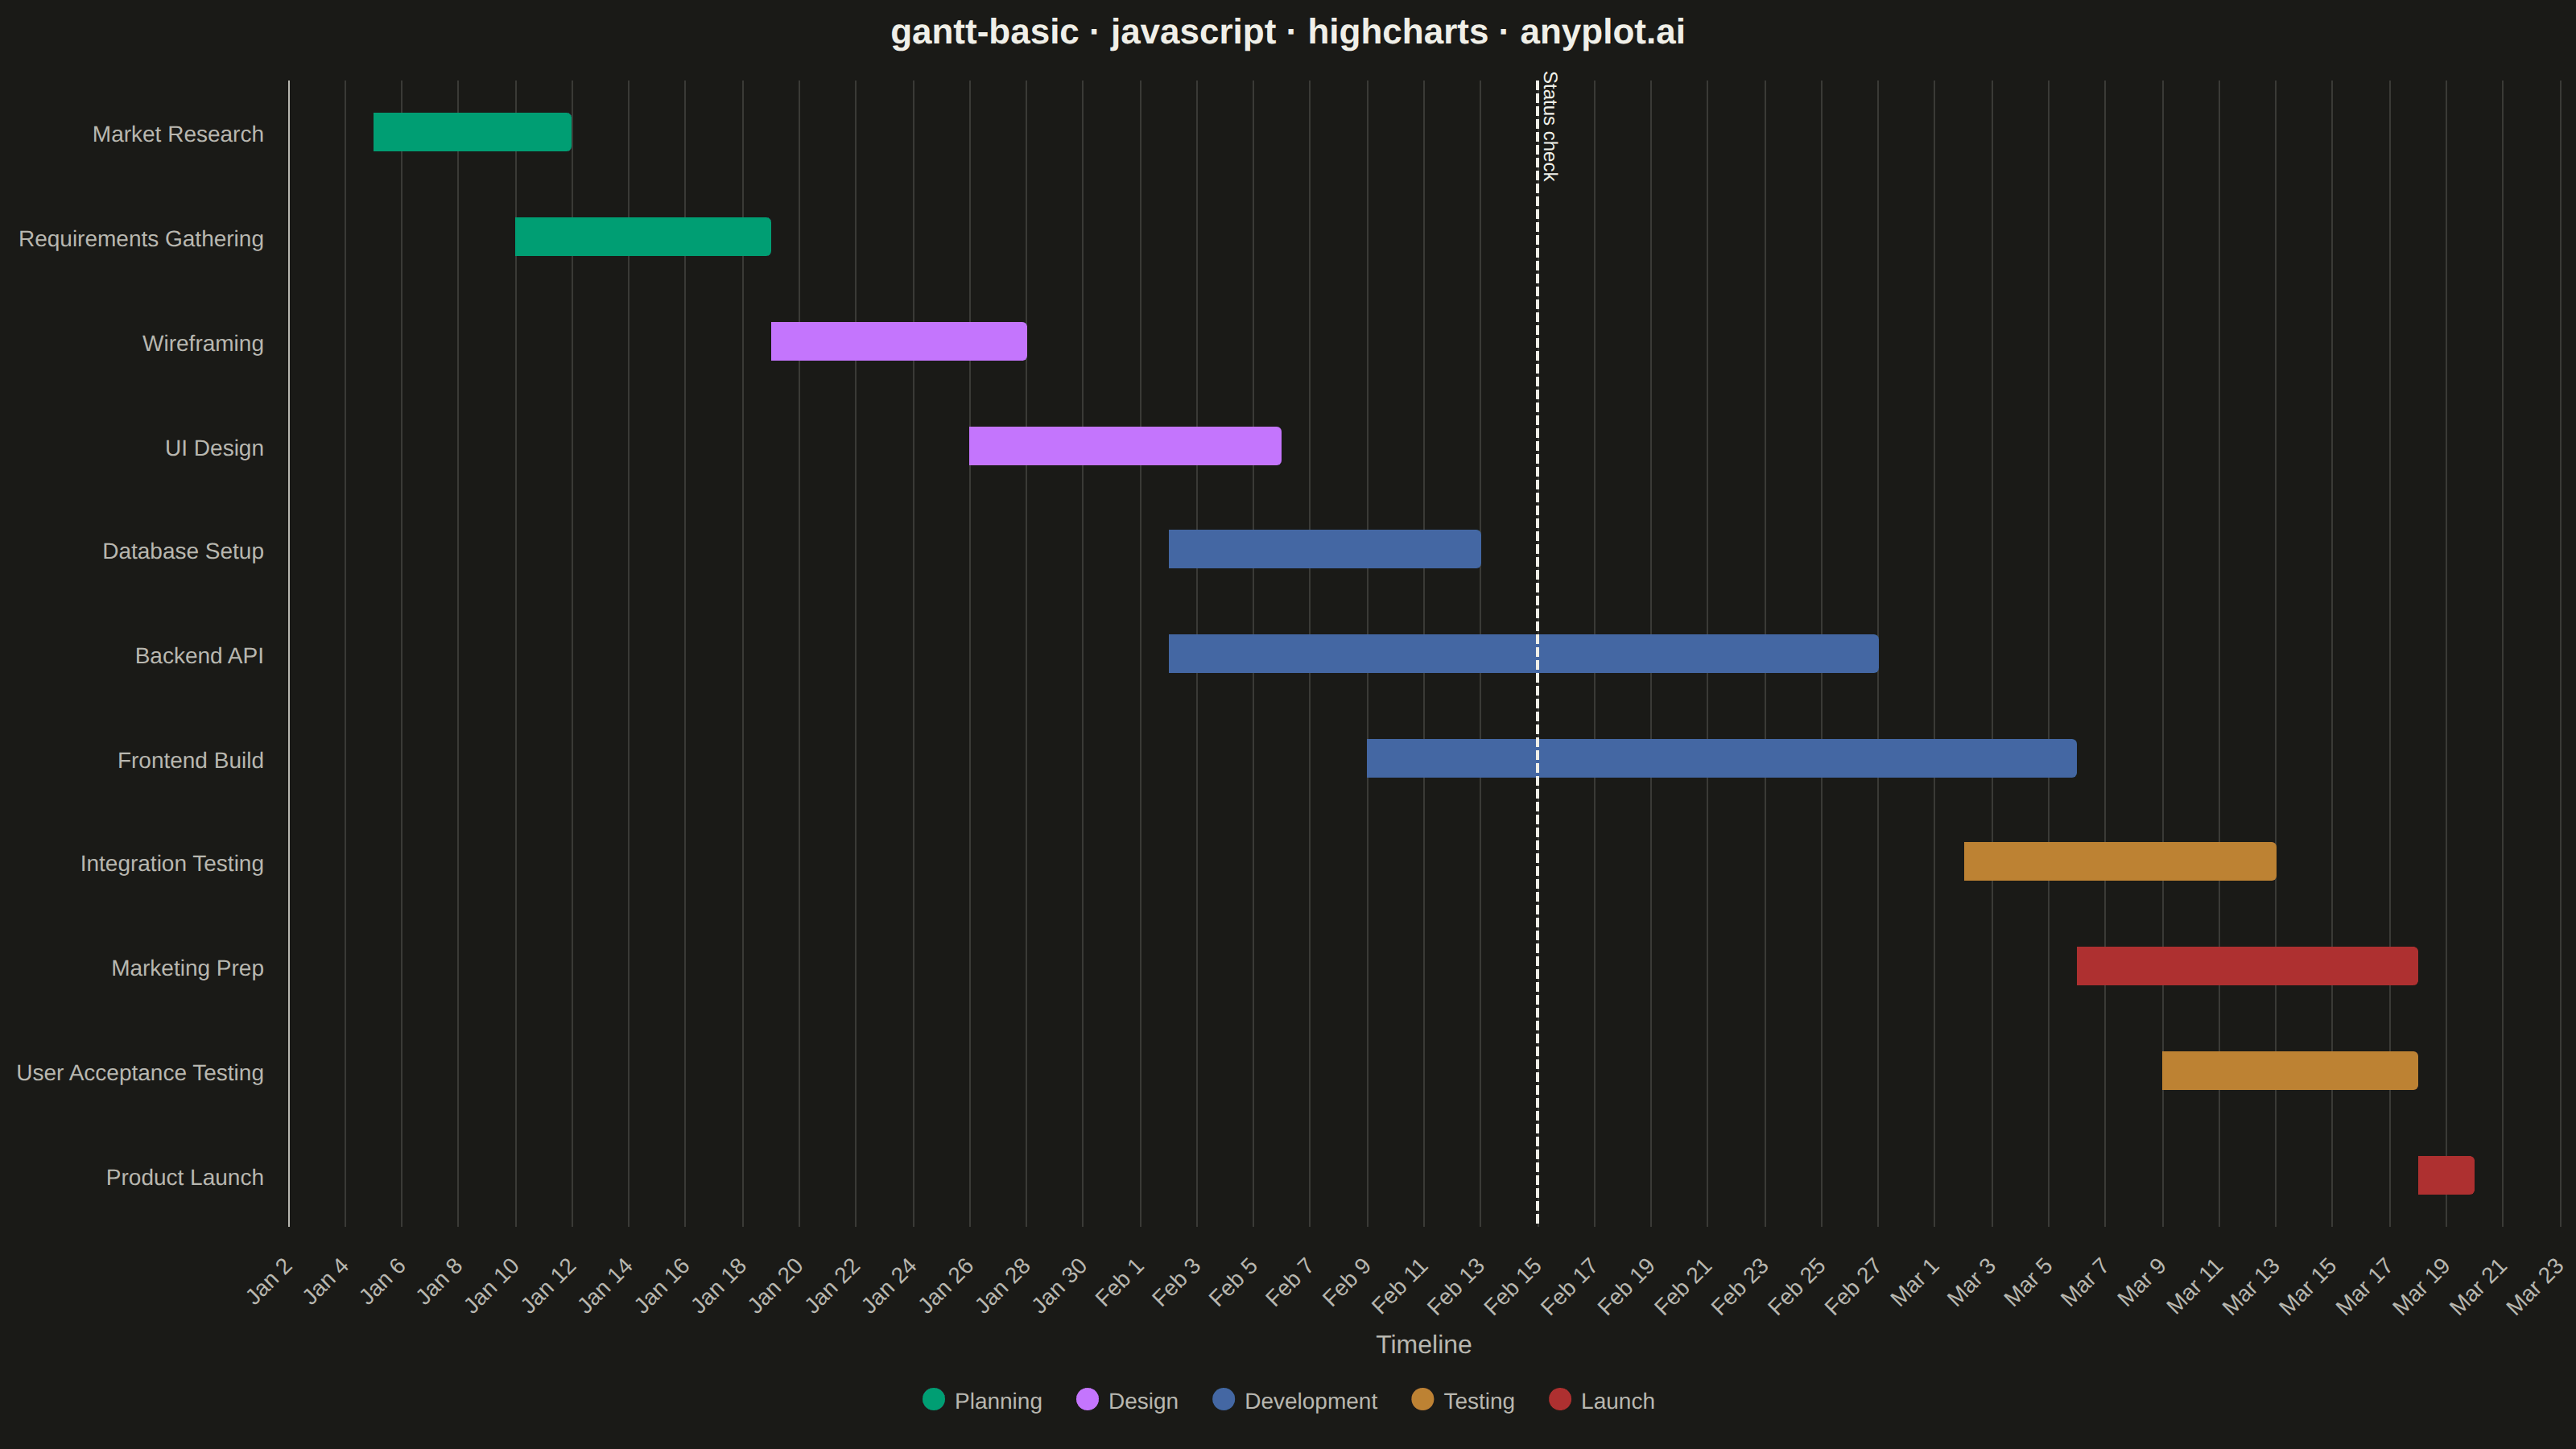
A Gantt chart is a horizontal bar chart that visualizes project schedules and timelines. Each task is represented as a horizontal bar spanning from its start date to end date, making it easy to see task durations, overlaps, and the overall project timeline at a glance. Gantt charts are essential for project management, helping teams understand task sequences and identify scheduling conflicts.
// anyplot.ai
// gantt-basic: Basic Gantt Chart
// Library: highcharts 12.6.0 | JavaScript 22.23.2
// Quality: 91/100 | Created: 2026-09-05

const t = window.ANYPLOT_TOKENS;

// --- Data (in-memory, deterministic) ---------------------------------------
// Software launch project timeline, ordered by start date. Only the core
// Highcharts bundle is loaded (no highcharts-gantt / xrange module), so the
// timeline is built from a stacked horizontal bar chart: an invisible
// "offset" series pushes each bar's start to the right date, and one visible
// series per category supplies the duration segment on top of it.
const categories = ["Planning", "Design", "Development", "Testing", "Launch"];
const categoryColors = {
  Planning: t.palette[0],
  Design: t.palette[1],
  Development: t.palette[2],
  Testing: t.palette[3],
  Launch: t.palette[4],
};

const tasks = [
  { task: "Market Research", start: Date.UTC(2026, 0, 5), end: Date.UTC(2026, 0, 12), category: "Planning" },
  { task: "Requirements Gathering", start: Date.UTC(2026, 0, 10), end: Date.UTC(2026, 0, 19), category: "Planning" },
  { task: "Wireframing", start: Date.UTC(2026, 0, 19), end: Date.UTC(2026, 0, 28), category: "Design" },
  { task: "UI Design", start: Date.UTC(2026, 0, 26), end: Date.UTC(2026, 1, 6), category: "Design" },
  { task: "Database Setup", start: Date.UTC(2026, 1, 2), end: Date.UTC(2026, 1, 13), category: "Development" },
  { task: "Backend API", start: Date.UTC(2026, 1, 2), end: Date.UTC(2026, 1, 27), category: "Development" },
  { task: "Frontend Build", start: Date.UTC(2026, 1, 9), end: Date.UTC(2026, 2, 6), category: "Development" },
  { task: "Integration Testing", start: Date.UTC(2026, 2, 2), end: Date.UTC(2026, 2, 13), category: "Testing" },
  { task: "Marketing Prep", start: Date.UTC(2026, 2, 6), end: Date.UTC(2026, 2, 18), category: "Launch" },
  { task: "User Acceptance Testing", start: Date.UTC(2026, 2, 9), end: Date.UTC(2026, 2, 18), category: "Testing" },
  { task: "Product Launch", start: Date.UTC(2026, 2, 18), end: Date.UTC(2026, 2, 20), category: "Launch" },
];

const taskNames = tasks.map((d) => d.task);
const offsets = tasks.map((d) => d.start);

const dayMs = 24 * 3600 * 1000;
const projectStart = Math.min(...tasks.map((d) => d.start));
const projectEnd = Math.max(...tasks.map((d) => d.end));
const statusCheck = Date.UTC(2026, 1, 15); // mid-project progress check

// One series per category (sparse, null elsewhere) so the legend doubles as
// the category key while still sharing a single stack with the offset series.
// Tasks fully finished before the status check render at reduced opacity, a
// lightweight "done vs. upcoming" hierarchy relative to the reference line.
const categorySeries = categories.map((cat) => ({
  name: cat,
  color: categoryColors[cat],
  stack: "gantt",
  data: tasks.map((d) =>
    d.category === cat ? { y: d.end - d.start, opacity: d.end <= statusCheck ? 0.55 : 1 } : null
  ),
}));

// --- Chart -------------------------------------------------------------------
Highcharts.chart("container", {
  chart: {
    type: "bar",
    backgroundColor: "transparent",
    animation: false,
    style: { fontFamily: "inherit" },
  },
  credits: { enabled: false },
  colors: t.palette,
  title: {
    text: "gantt-basic · javascript · highcharts · anyplot.ai",
    style: { color: t.ink, fontSize: "22px", fontWeight: "600" },
  },
  xAxis: {
    categories: taskNames,
    reversed: true,
    lineColor: t.inkSoft,
    tickColor: t.inkSoft,
    labels: { style: { color: t.inkSoft, fontSize: "14px" } },
  },
  yAxis: {
    type: "datetime",
    min: projectStart - 3 * dayMs,
    max: projectEnd + 3 * dayMs,
    startOnTick: false,
    endOnTick: false,
    // Highcharts stacks series bottom-to-top in *reverse* array order by
    // default (reversedStacks: true) — that would put the invisible "offset"
    // series on top and the visible duration segment at the zero baseline
    // (off-screen). Keep array order so offset stacks first, at the bottom.
    reversedStacks: false,
    title: { text: "Project Timeline (2026)", style: { color: t.inkSoft, fontSize: "16px" } },
    gridLineColor: t.grid,
    lineColor: t.inkSoft,
    tickColor: t.inkSoft,
    labels: {
      style: { color: t.inkSoft, fontSize: "14px" },
      format: "{value:%b %e}",
    },
    plotLines: [
      {
        value: statusCheck,
        color: t.ink,
        width: 2,
        dashStyle: "ShortDash",
        zIndex: 5,
        label: {
          text: "Status check",
          rotation: 0,
          align: "center",
          verticalAlign: "top",
          style: { color: t.ink, fontSize: "12px", fontWeight: "600" },
          y: -6,
        },
      },
    ],
  },
  legend: {
    itemStyle: { color: t.inkSoft, fontSize: "14px" },
    itemHoverStyle: { color: t.ink },
  },
  tooltip: {
    backgroundColor: t.elevatedBg,
    borderColor: t.inkSoft,
    style: { color: t.ink, fontSize: "13px" },
    formatter: function () {
      const d = tasks[this.point.index];
      const fmt = "%b %e, %Y";
      return (
        "<b>" + d.task + "</b><br/>" +
        d.category + "<br/>" +
        Highcharts.dateFormat(fmt, d.start) + " – " + Highcharts.dateFormat(fmt, d.end)
      );
    },
  },
  plotOptions: {
    series: { animation: false, stacking: "normal" },
    bar: { groupPadding: 0.1, pointPadding: 0.02, borderWidth: 0, pointWidth: 24 },
  },
  series: [
    {
      name: "offset",
      data: offsets,
      stack: "gantt",
      color: "transparent",
      enableMouseTracking: false,
      showInLegend: false,
    },
    ...categorySeries,
  ],
});
Runnable source as JSON, for any HTTP client: https://api.anyplot.ai/specs/gantt-basic/highcharts/code. Any spec id and library id listed in llms-full.txt fit the same URL shape; every URL below is complete and callable.
{
  "spec_id": "gantt-basic",
  "language": "javascript",
  "library": "highcharts",
  "page": "https://anyplot.ai/gantt-basic/javascript/highcharts",
  "hub": "https://anyplot.ai/gantt-basic",
  "code_json": "https://api.anyplot.ai/specs/gantt-basic/highcharts/code",
  "spec_json": "https://api.anyplot.ai/specs/gantt-basic",
  "render_light_png": "https://storage.googleapis.com/anyplot-images/plots/gantt-basic/javascript/highcharts/plot-light.png",
  "render_dark_png": "https://storage.googleapis.com/anyplot-images/plots/gantt-basic/javascript/highcharts/plot-dark.png",
  "interactive_light_html": "https://storage.googleapis.com/anyplot-images/plots/gantt-basic/javascript/highcharts/plot-light.html",
  "interactive_dark_html": "https://storage.googleapis.com/anyplot-images/plots/gantt-basic/javascript/highcharts/plot-dark.html",
  "quality_score": 91.0,
  "license": "MIT",
  "guide": "https://anyplot.ai/llms.txt"
}
Part of Basic Gantt Chart on anyplot.ai.