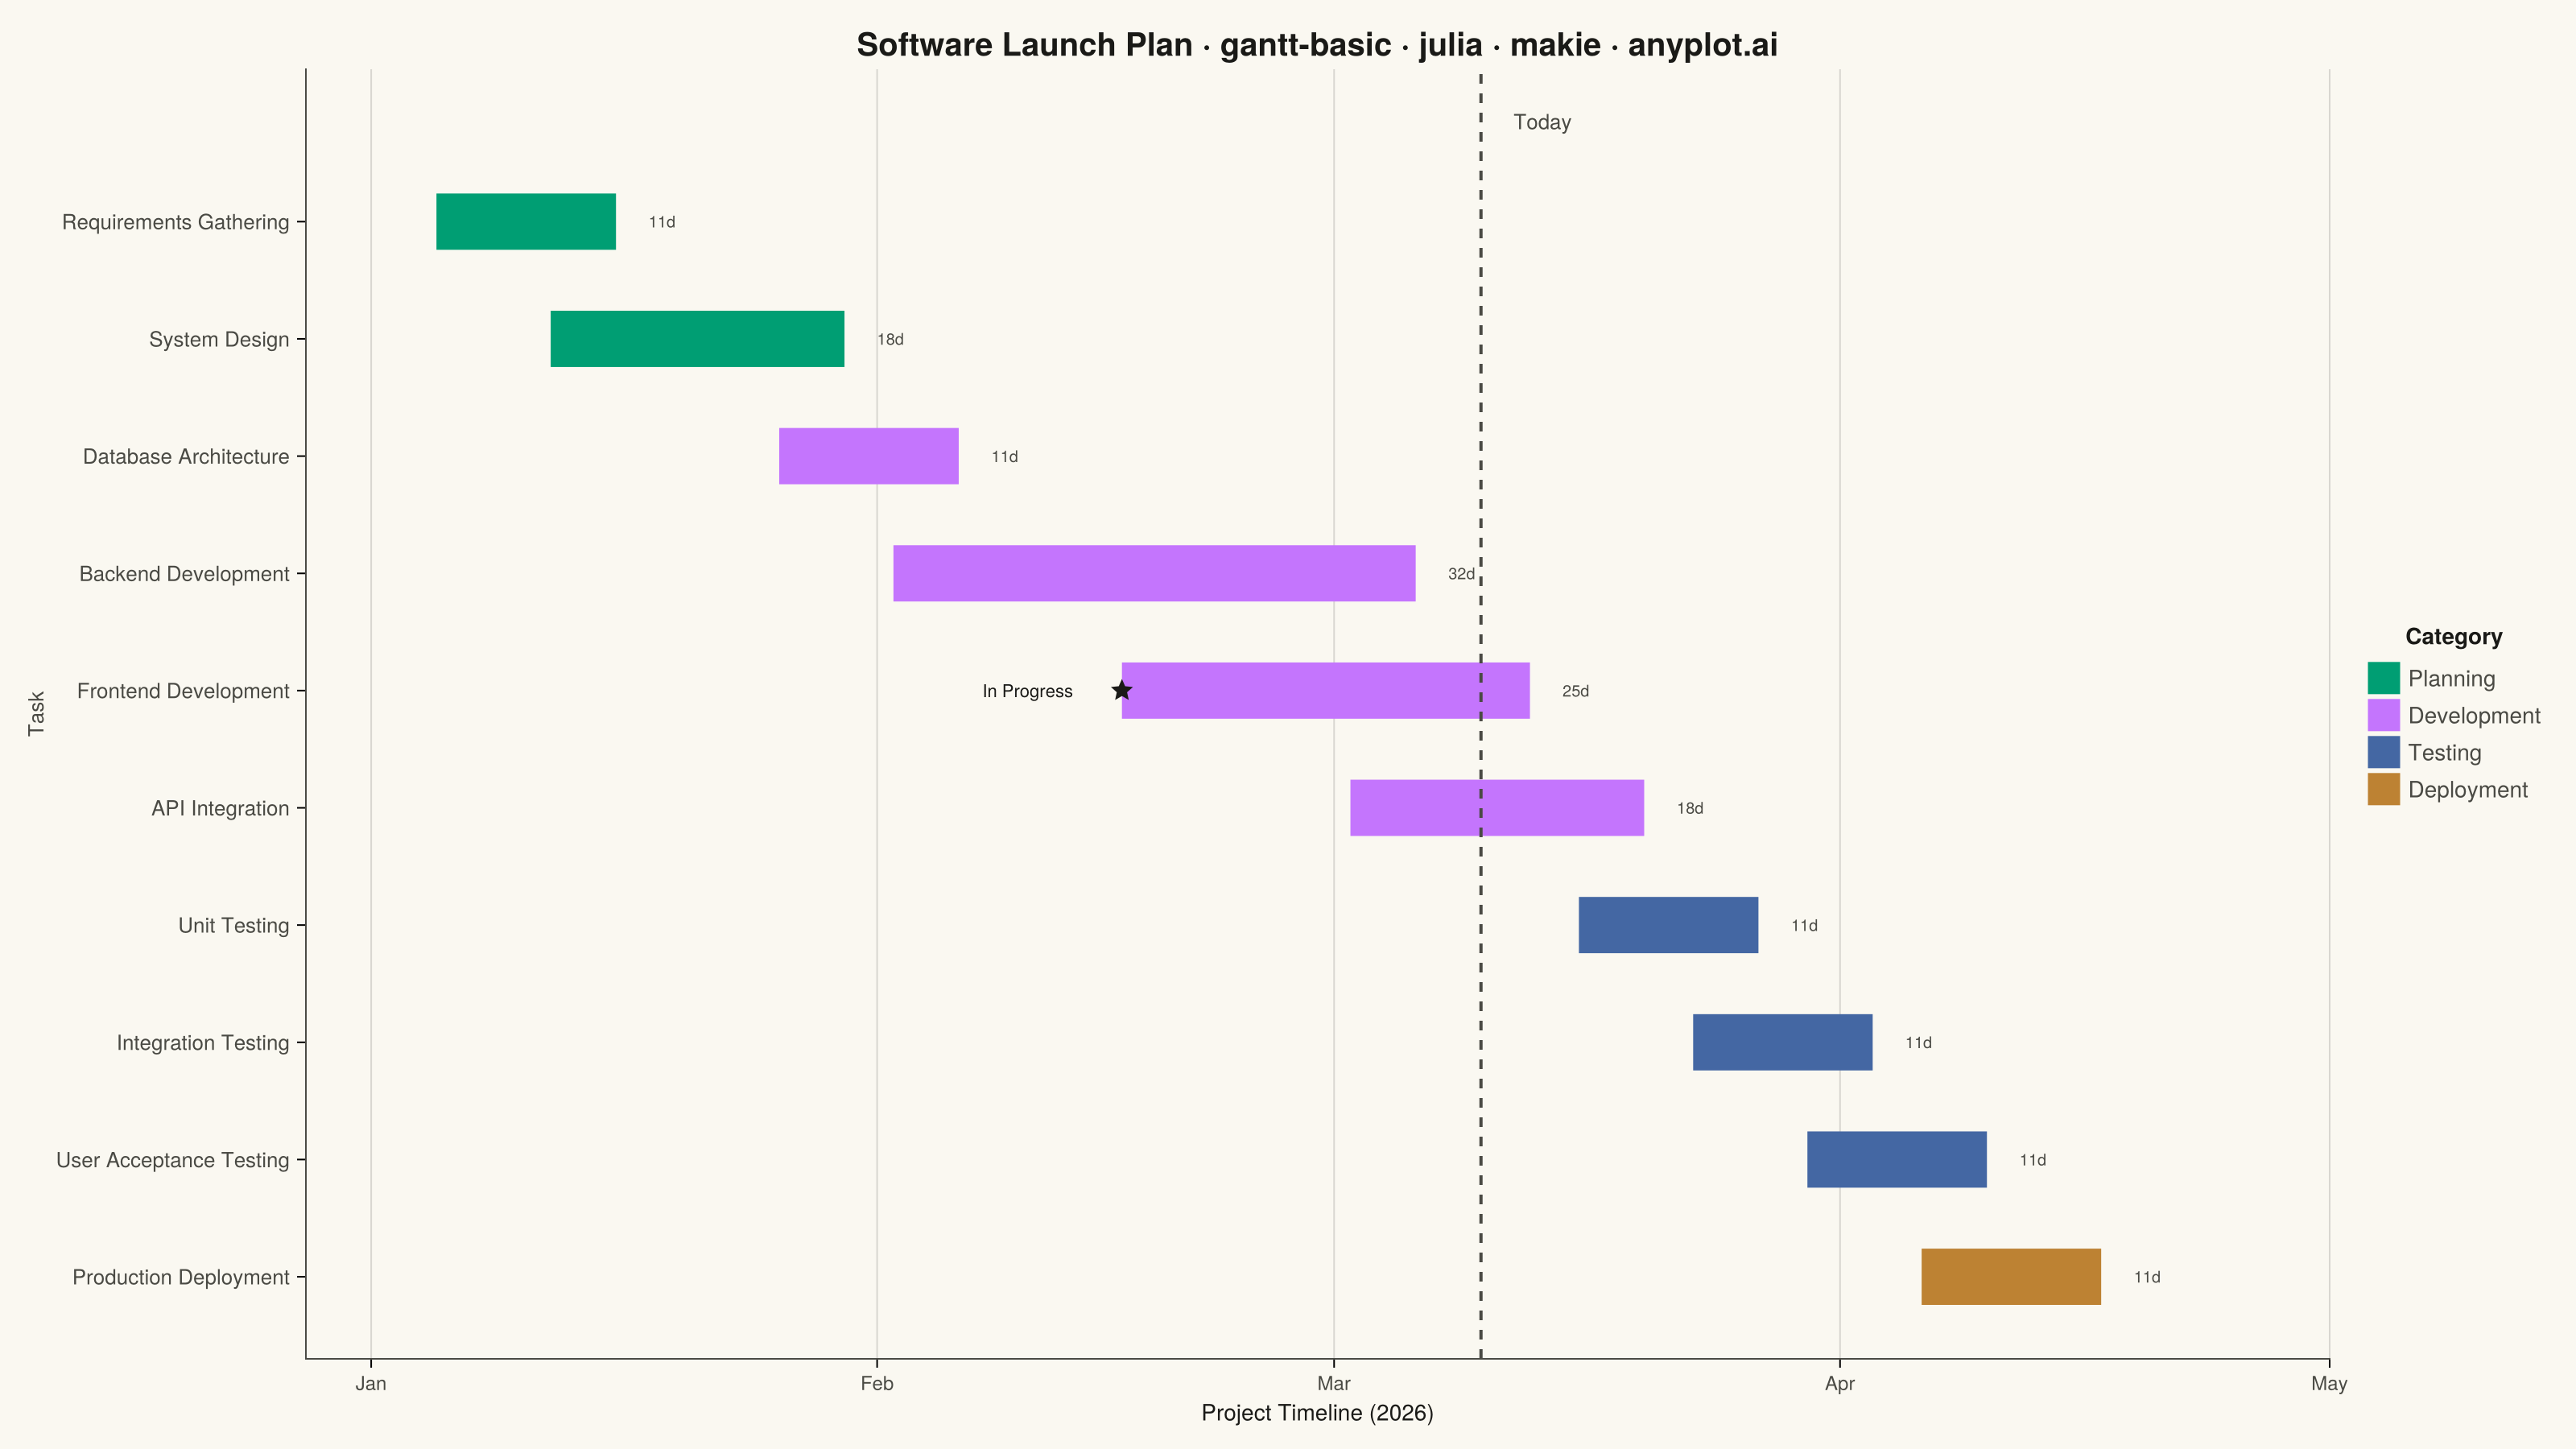
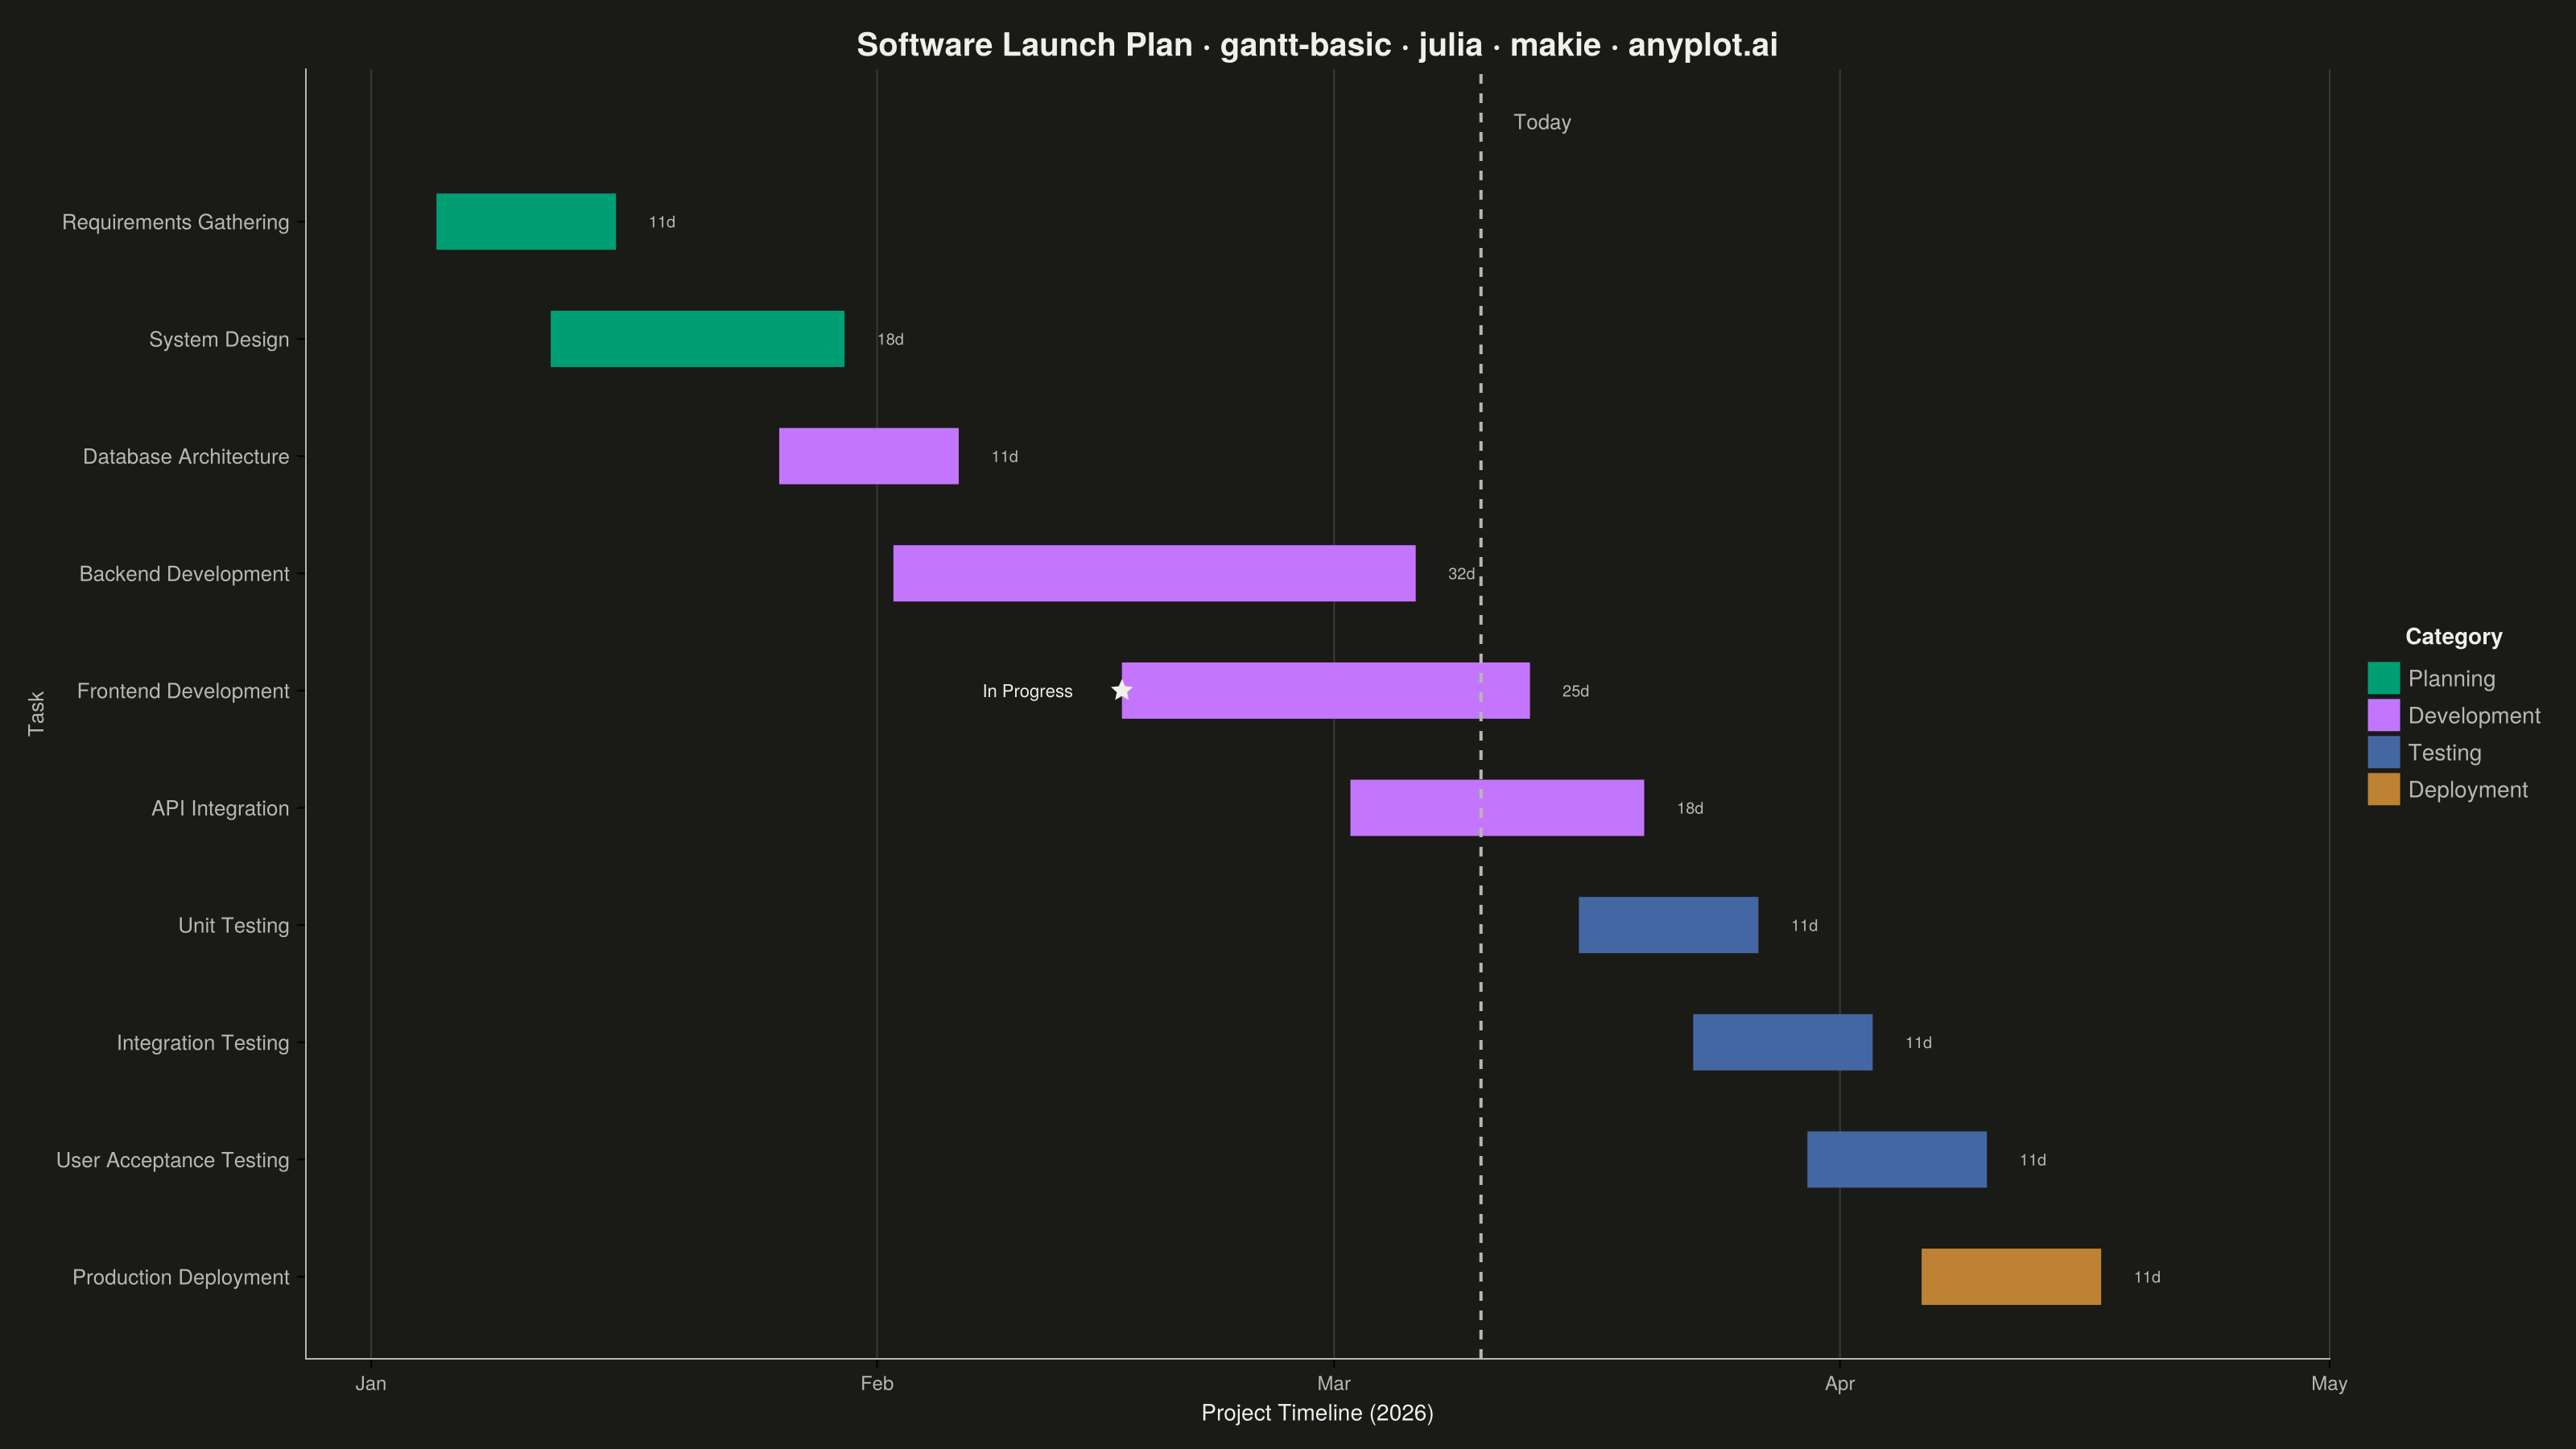
The same plot in 14 other libraries — Python: Altair, Bokeh, lets-plot, Matplotlib, Plotly, plotnine, Pygal, Seaborn; R: ggplot2; JavaScript: Chart.js, D3.js, Apache ECharts, Highcharts, MUI X Charts. Compare all 15 side by side: Basic Gantt Chart in Python, R, Julia and JavaScript.
A Gantt chart is a horizontal bar chart that visualizes project schedules and timelines. Each task is represented as a horizontal bar spanning from its start date to end date, making it easy to see task durations, overlaps, and the overall project timeline at a glance. Gantt charts are essential for project management, helping teams understand task sequences and identify scheduling conflicts.
# anyplot.ai
# gantt-basic: Basic Gantt Chart
# Library: makie 0.21.9 | Julia 1.11.9
# Quality: 91/100 | Created: 2026-09-05

using CairoMakie
using Dates
using Colors
using Random

Random.seed!(42)

# --- Theme tokens -----------------------------------------------------------
THEME    = get(ENV, "ANYPLOT_THEME", "light")
PAGE_BG  = THEME == "light" ? colorant"#FAF8F1" : colorant"#1A1A17"
INK      = THEME == "light" ? colorant"#1A1A17" : colorant"#F0EFE8"
INK_SOFT = THEME == "light" ? colorant"#4A4A44" : colorant"#B8B7B0"
IMPRINT_PALETTE = [
    colorant"#009E73", colorant"#C475FD", colorant"#4467A3", colorant"#BD8233",
]

# --- Data ---------------------------------------------------------------------
tasks = [
    "Requirements Gathering", "System Design", "Database Architecture",
    "Backend Development", "Frontend Development", "API Integration",
    "Unit Testing", "Integration Testing", "User Acceptance Testing",
    "Production Deployment",
]

categories = [
    "Planning", "Planning", "Development",
    "Development", "Development", "Development",
    "Testing", "Testing", "Testing",
    "Deployment",
]

starts = Date.([
    "2026-01-05", "2026-01-12", "2026-01-26",
    "2026-02-02", "2026-02-16", "2026-03-02",
    "2026-03-16", "2026-03-23", "2026-03-30",
    "2026-04-06",
])

ends = Date.([
    "2026-01-16", "2026-01-30", "2026-02-06",
    "2026-03-06", "2026-03-13", "2026-03-20",
    "2026-03-27", "2026-04-03", "2026-04-10",
    "2026-04-17",
])

n_tasks = length(tasks)
start_nums = Dates.value.(starts)
end_nums = Dates.value.(ends)
durations = end_nums .- start_nums
y_positions = collect(n_tasks:-1:1)  # earliest task plotted at the top
today_num = Dates.value(Date(2026, 3, 10))
active_idx = findfirst(i -> start_nums[i] <= today_num <= end_nums[i], 1:n_tasks)

unique_categories = unique(categories)
category_colors = Dict(zip(unique_categories, IMPRINT_PALETTE[1:length(unique_categories)]))

# --- Plot ---------------------------------------------------------------------
title_str = "Software Launch Plan · gantt-basic · julia · makie · anyplot.ai"
title_fontsize = length(title_str) > 67 ? round(Int, 20 * 67 / length(title_str)) : 20

fig = Figure(
    resolution      = (1600, 900),
    fontsize        = 14,
    backgroundcolor = PAGE_BG,
)

ax = Axis(
    fig[1, 1];
    title             = title_str,
    titlesize         = title_fontsize,
    titlecolor        = INK,
    xlabel            = "Project Timeline (2026)",
    xlabelsize        = 14,
    xlabelcolor       = INK,
    ylabel            = "Task",
    ylabelsize        = 13,
    ylabelcolor       = INK_SOFT,
    yticklabelcolor   = INK_SOFT,
    xticklabelcolor   = INK_SOFT,
    yticklabelsize    = 13,
    xticklabelsize    = 12,
    backgroundcolor   = PAGE_BG,
    topspinevisible   = false,
    rightspinevisible = false,
    leftspinecolor    = INK_SOFT,
    bottomspinecolor  = INK_SOFT,
    xgridcolor        = RGBAf(INK.r, INK.g, INK.b, 0.15),
    ygridvisible      = false,
    yticks            = (1:n_tasks, reverse(tasks)),
)

month_starts = Date(2026, 1, 1):Month(1):Date(2026, 5, 1)
ax.xticks = (Dates.value.(month_starts), Dates.format.(month_starts, "u"))

for cat in unique_categories
    idx = findall(==(cat), categories)
    barplot!(
        ax, y_positions[idx], end_nums[idx];
        fillto    = start_nums[idx],
        direction = :x,
        width     = 0.6,
        color     = category_colors[cat],
        label     = cat,
    )
end

for i in 1:n_tasks
    text!(
        ax, end_nums[i] + 2, y_positions[i];
        text = "$(durations[i])d", color = INK_SOFT, fontsize = 10, align = (:left, :center),
    )
end

if active_idx !== nothing
    scatter!(
        ax, [start_nums[active_idx]], [y_positions[active_idx]];
        marker = :star5, markersize = 16, color = INK, strokewidth = 0,
    )
    text!(
        ax, start_nums[active_idx] - 3, y_positions[active_idx];
        text = "In Progress", color = INK, fontsize = 11, align = (:right, :center),
    )
end

vlines!(ax, [today_num]; color = INK_SOFT, linestyle = :dash, linewidth = 2)
text!(
    ax, today_num + 2, n_tasks + 0.75;
    text = "Today", color = INK_SOFT, fontsize = 13, align = (:left, :bottom),
)

ylims!(ax, 0.3, n_tasks + 1.3)
xlims!(ax, minimum(start_nums) - 8, maximum(end_nums) + 14)

Legend(
    fig[1, 2], ax, "Category";
    framevisible    = false,
    backgroundcolor = PAGE_BG,
    labelcolor      = INK_SOFT,
    titlecolor      = INK,
)

# --- Save -----------------------------------------------------------------
save("plot-$(THEME).png", fig; px_per_unit = 2)
Runnable source as JSON, for any HTTP client: https://api.anyplot.ai/specs/gantt-basic/makie/code. Any spec id and library id listed in llms-full.txt fit the same URL shape; every URL below is complete and callable.
{
  "spec_id": "gantt-basic",
  "language": "julia",
  "library": "makie",
  "page": "https://anyplot.ai/gantt-basic/julia/makie",
  "hub": "https://anyplot.ai/gantt-basic",
  "code_json": "https://api.anyplot.ai/specs/gantt-basic/makie/code",
  "spec_json": "https://api.anyplot.ai/specs/gantt-basic",
  "render_light_png": "https://storage.googleapis.com/anyplot-images/plots/gantt-basic/julia/makie/plot-light.png",
  "render_dark_png": "https://storage.googleapis.com/anyplot-images/plots/gantt-basic/julia/makie/plot-dark.png",
  "quality_score": 91.0,
  "license": "MIT",
  "guide": "https://anyplot.ai/llms.txt"
}
Part of Basic Gantt Chart on anyplot.ai.