The same plot in 14 other libraries — Python: Altair, Bokeh, lets-plot, Matplotlib, Plotly, plotnine, Pygal, Seaborn; Julia: Makie.jl; JavaScript: Chart.js, D3.js, Apache ECharts, Highcharts, MUI X Charts. Compare all 15 side by side: Basic Gantt Chart in Python, R, Julia and JavaScript.
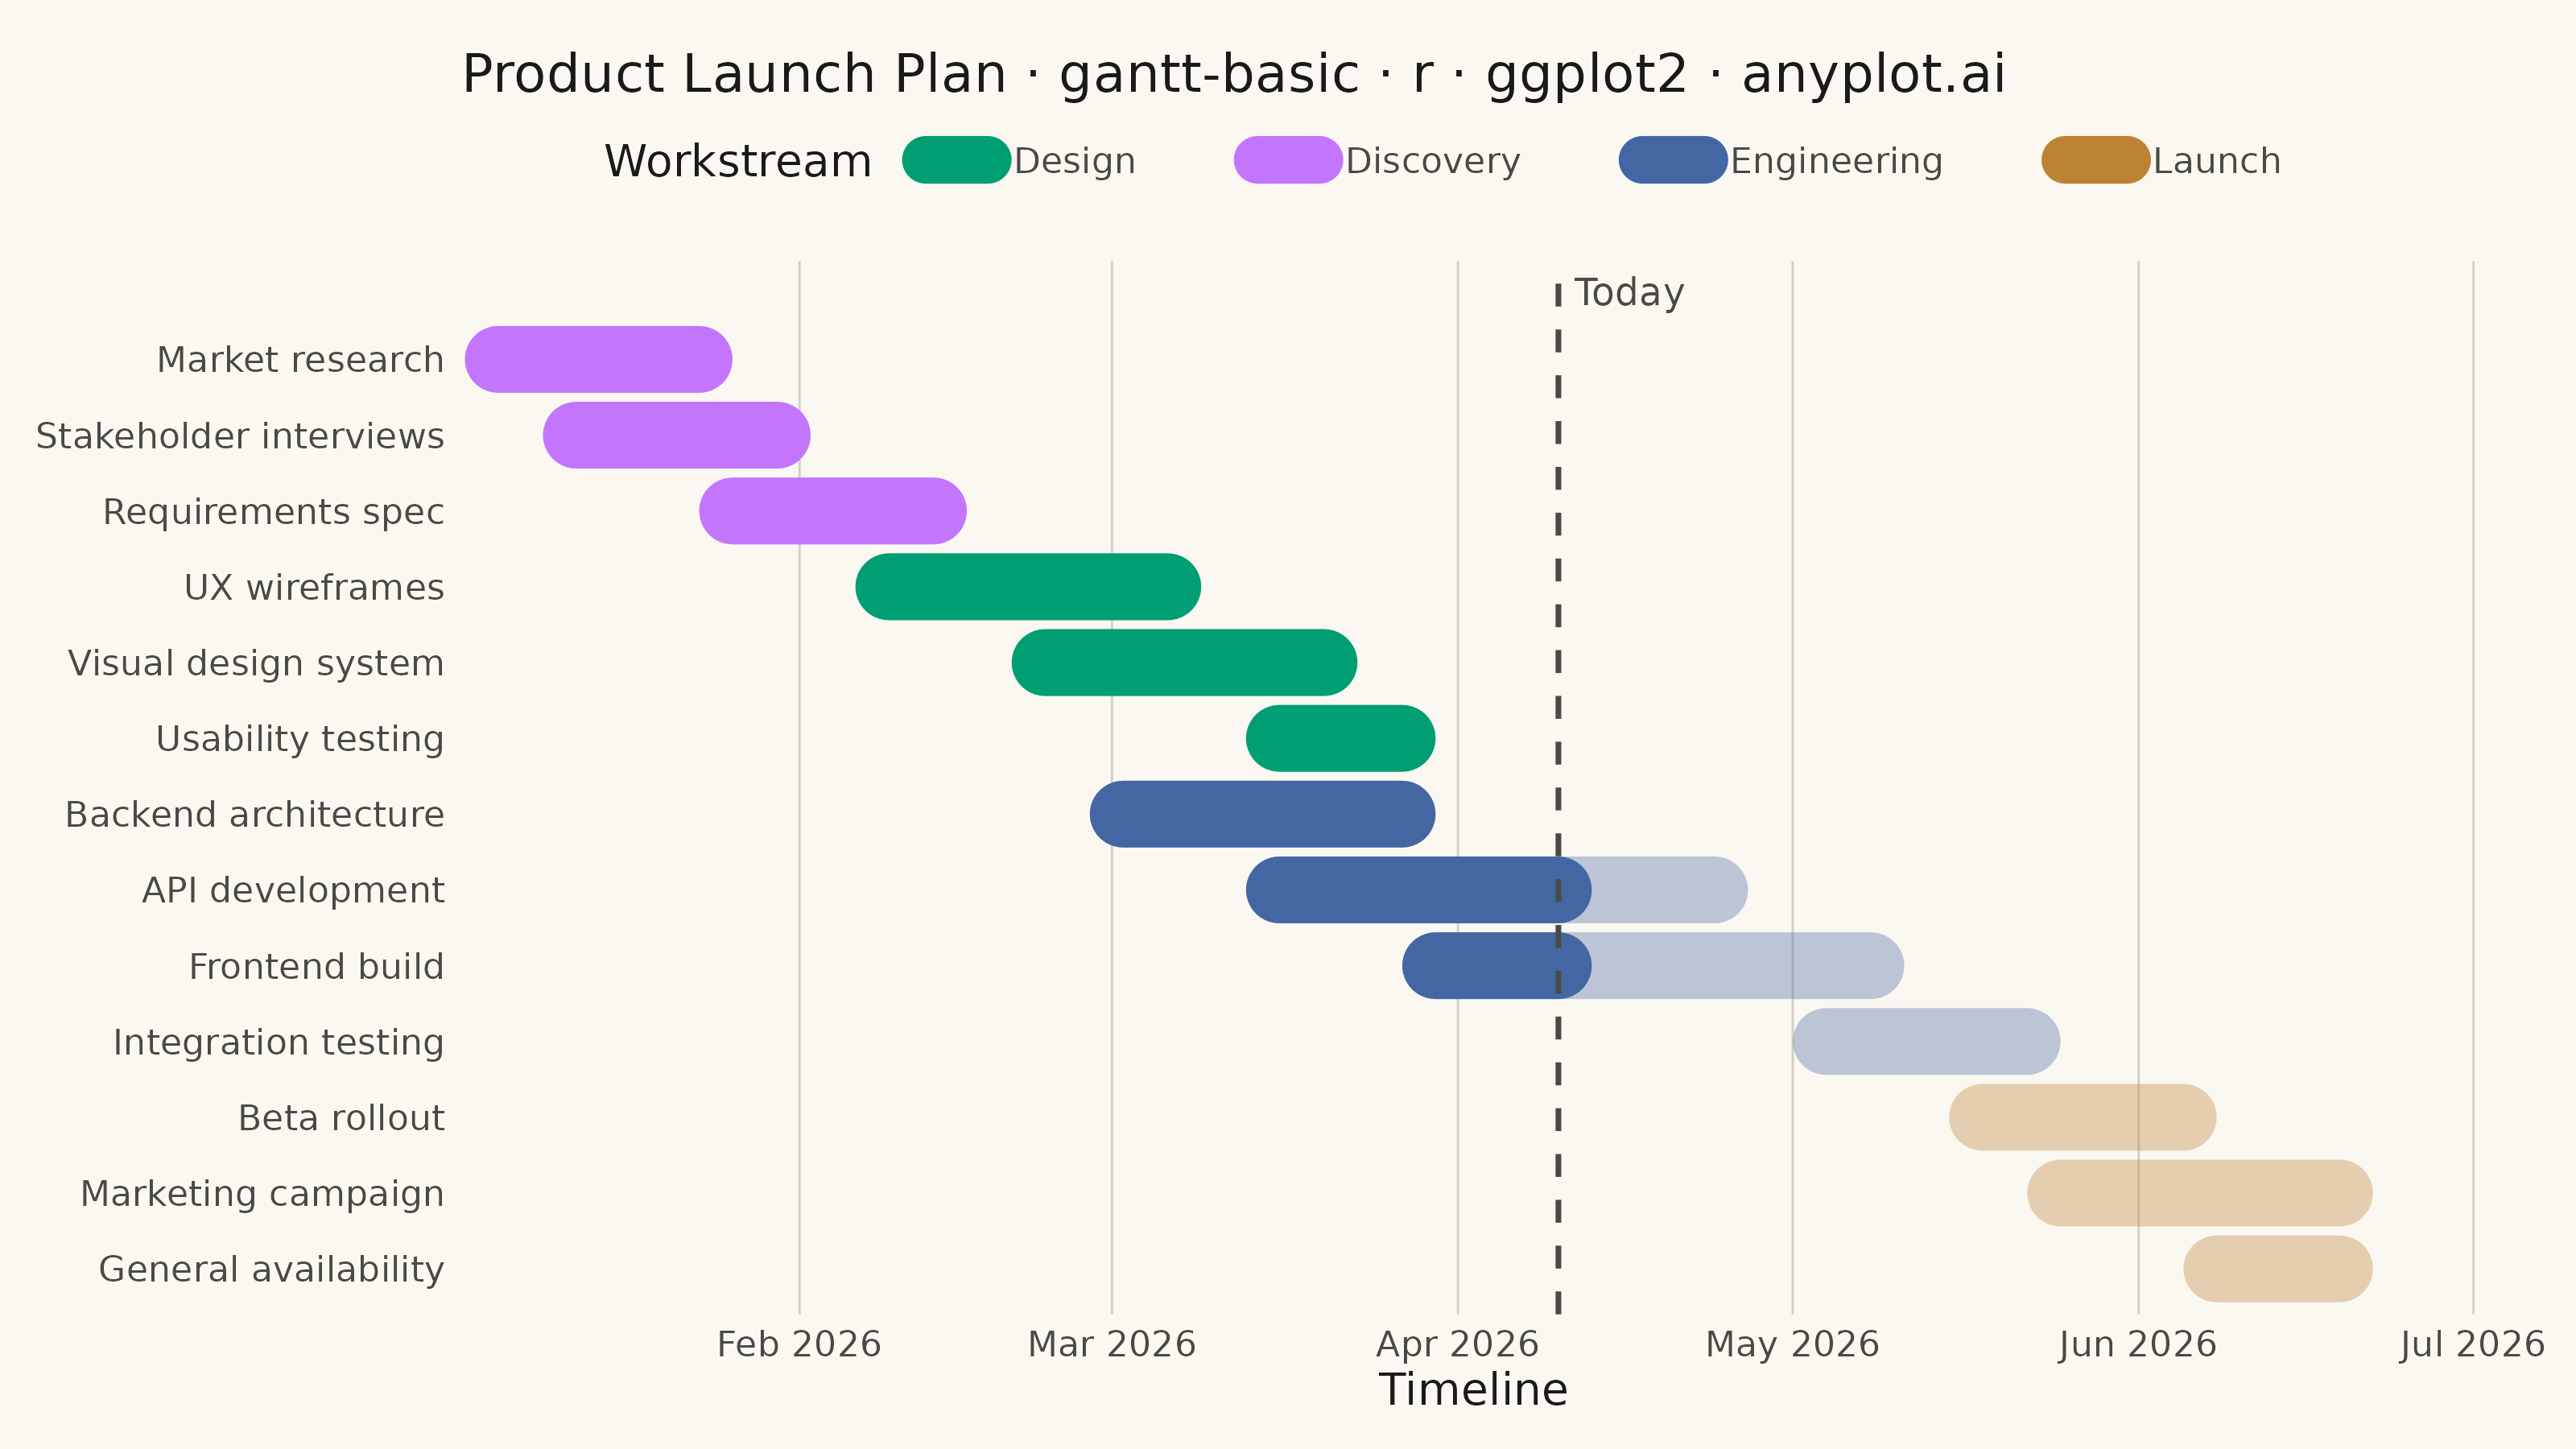
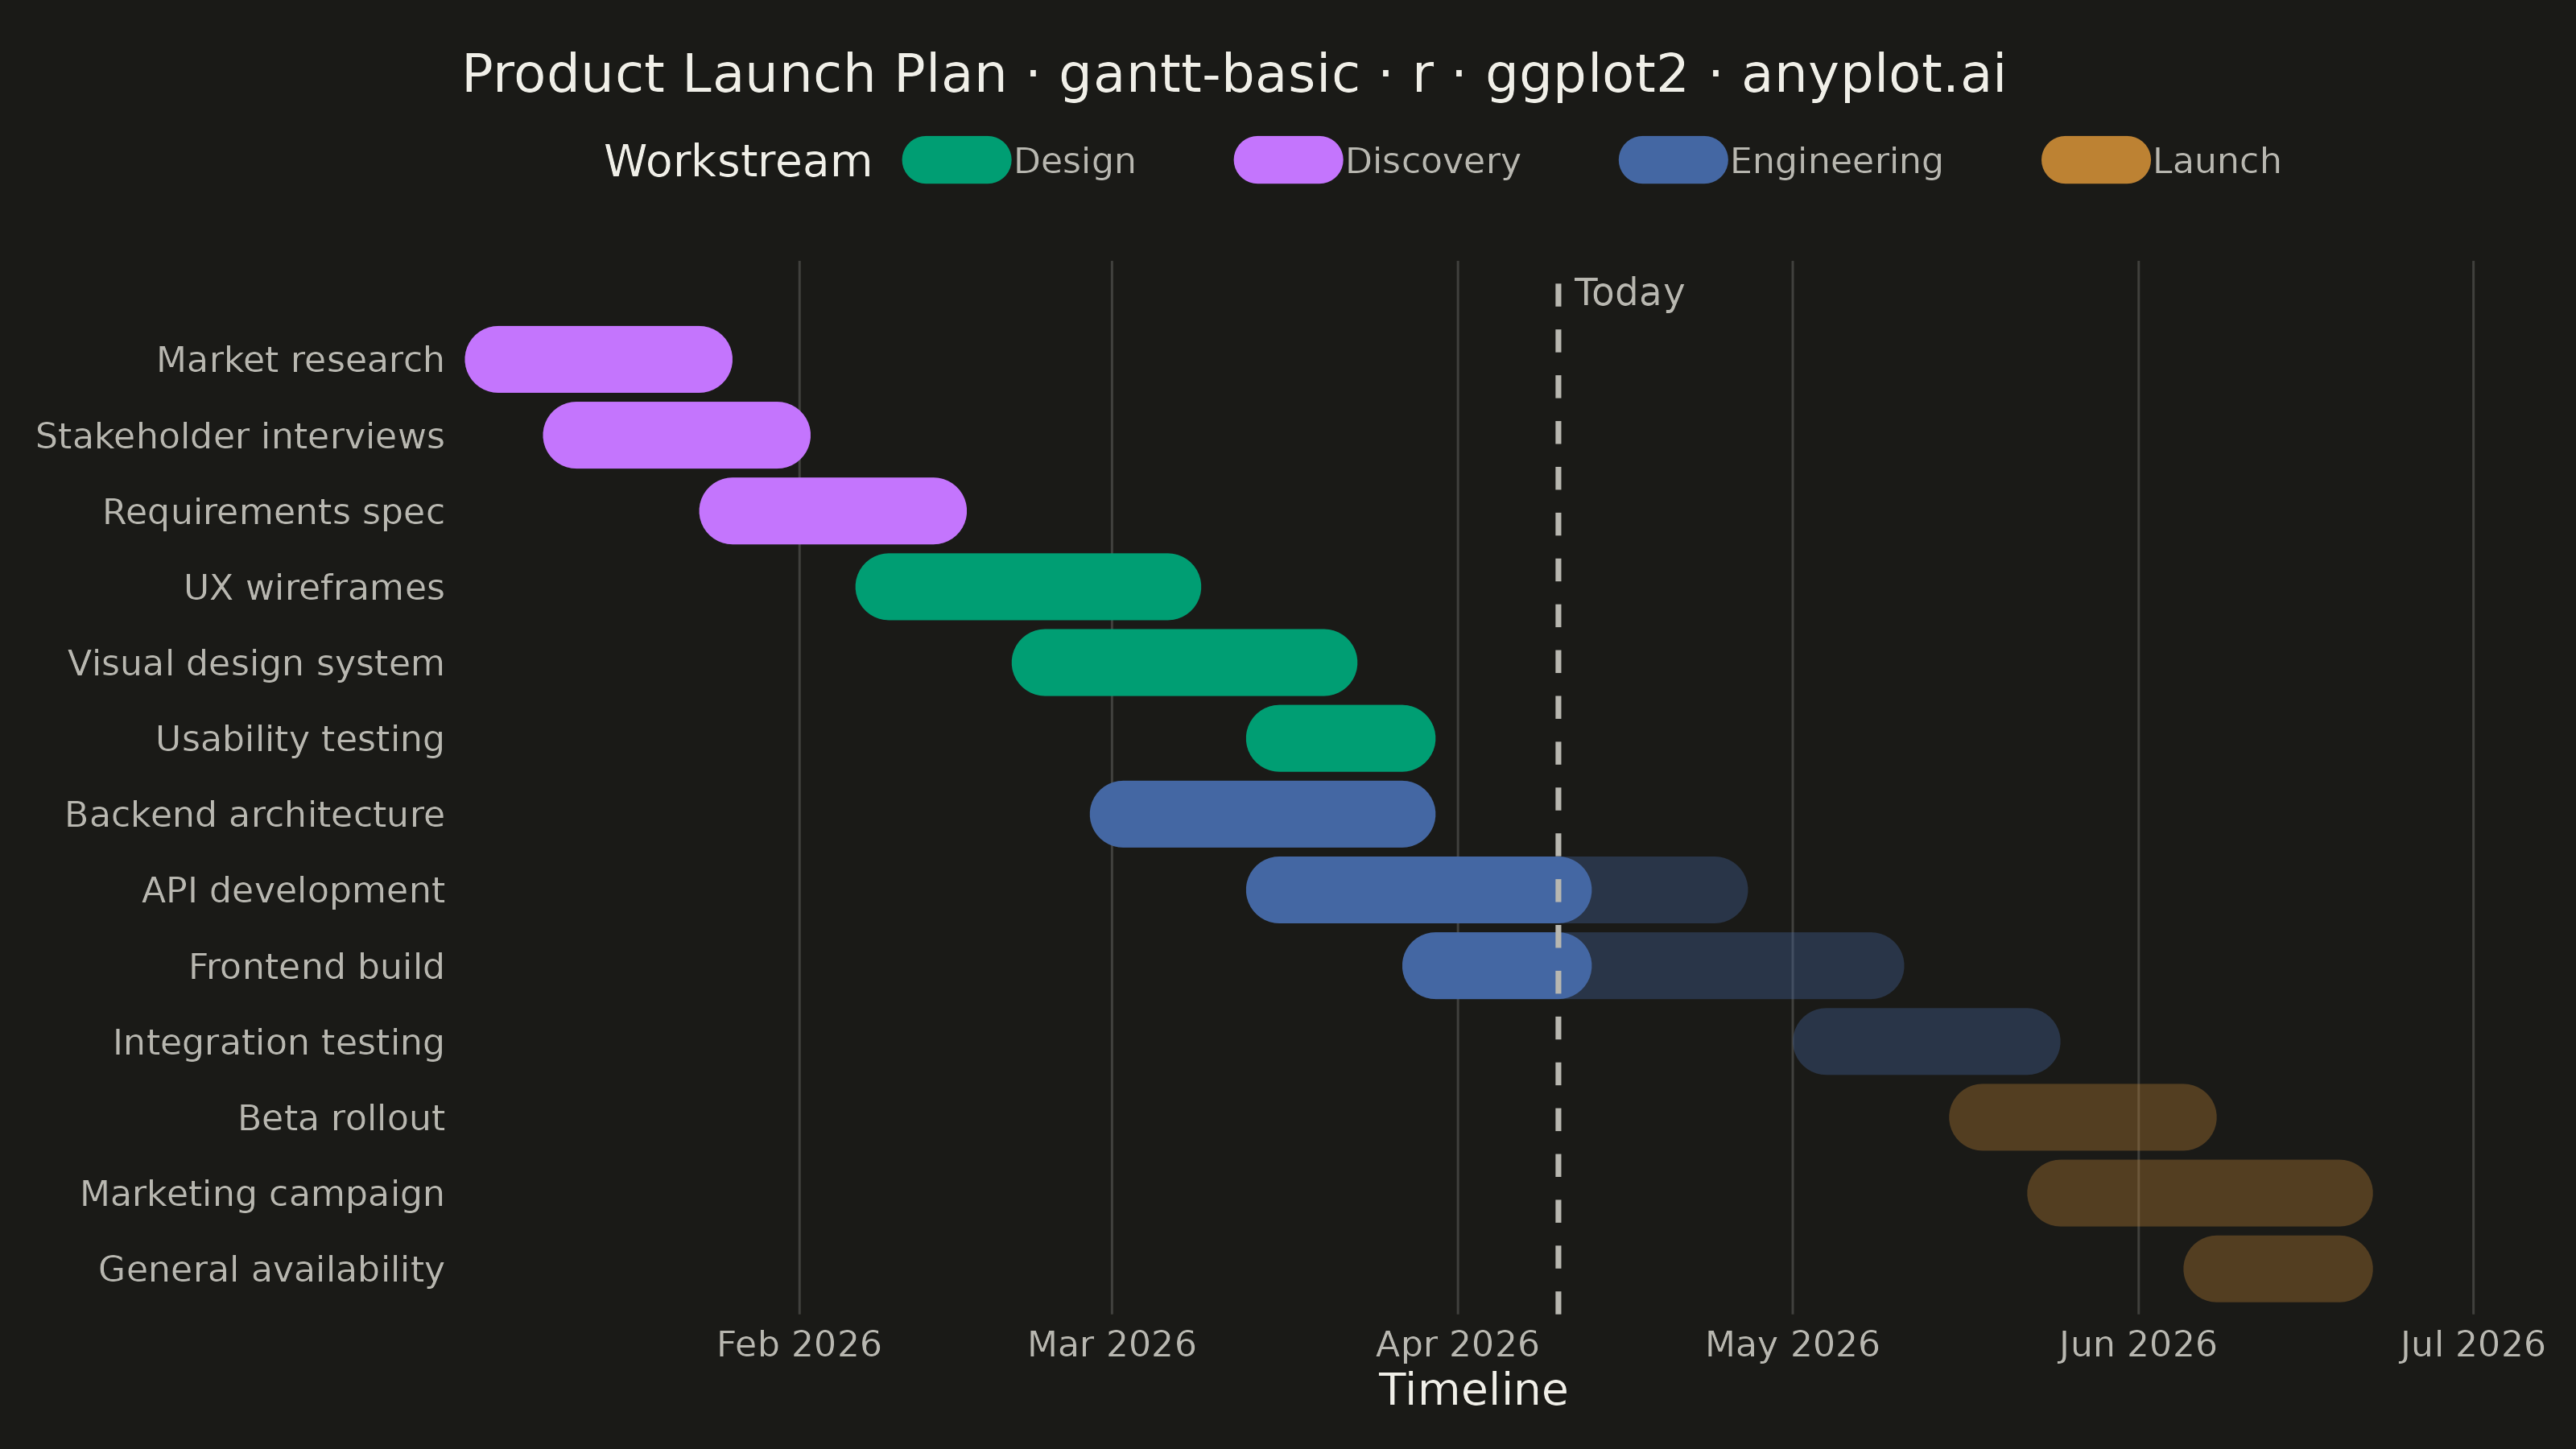
A Gantt chart is a horizontal bar chart that visualizes project schedules and timelines. Each task is represented as a horizontal bar spanning from its start date to end date, making it easy to see task durations, overlaps, and the overall project timeline at a glance. Gantt charts are essential for project management, helping teams understand task sequences and identify scheduling conflicts.
#' anyplot.ai
#' gantt-basic: Basic Gantt Chart
#' Library: ggplot2 3.5.1 | R 4.4.1
#' Quality: 93/100 | Created: 2026-09-05

library(ggplot2)
library(dplyr)
library(ragg)
library(scales)

set.seed(42)

# --- Theme tokens -----------------------------------------------------------
THEME       <- Sys.getenv("ANYPLOT_THEME", "light")
PAGE_BG     <- if (THEME == "light") "#FAF8F1" else "#1A1A17"
INK         <- if (THEME == "light") "#1A1A17" else "#F0EFE8"
INK_SOFT    <- if (THEME == "light") "#4A4A44" else "#B8B7B0"
IMPRINT_PALETTE <- c("#009E73", "#C475FD", "#4467A3", "#BD8233",
                     "#AE3030", "#2ABCCD", "#954477", "#99B314")

# --- Data ---------------------------------------------------------------
# Product launch project plan: phases grouped by workstream.
tasks <- tibble::tribble(
  ~task,                     ~start,       ~end,         ~workstream,
  "Market research",         "2026-01-05", "2026-01-23", "Discovery",
  "Stakeholder interviews",  "2026-01-12", "2026-01-30", "Discovery",
  "Requirements spec",       "2026-01-26", "2026-02-13", "Discovery",
  "UX wireframes",           "2026-02-09", "2026-03-06", "Design",
  "Visual design system",    "2026-02-23", "2026-03-20", "Design",
  "Usability testing",       "2026-03-16", "2026-03-27", "Design",
  "Backend architecture",    "2026-03-02", "2026-03-27", "Engineering",
  "API development",         "2026-03-16", "2026-04-24", "Engineering",
  "Frontend build",          "2026-03-30", "2026-05-08", "Engineering",
  "Integration testing",     "2026-05-04", "2026-05-22", "Engineering",
  "Beta rollout",            "2026-05-18", "2026-06-05", "Launch",
  "Marketing campaign",      "2026-05-25", "2026-06-19", "Launch",
  "General availability",    "2026-06-08", "2026-06-19", "Launch"
) %>%
  mutate(
    start = as.Date(start),
    end   = as.Date(end),
    task  = factor(task, levels = rev(task))
  )

today <- as.Date("2026-04-10")

# --- Plot -----------------------------------------------------------------
n_tasks <- length(levels(tasks$task))

# Progress-to-date shading: the full task duration renders faded, while the
# portion already elapsed (start -> min(end, today)) is overlaid at full
# opacity, so in-flight and completed work read as darker than upcoming work.
started <- tasks %>%
  filter(start <= today) %>%
  mutate(progress_end = pmin(end, today))

p <- ggplot(tasks, aes(y = task, x = start, xend = end, color = workstream)) +
  geom_segment(aes(xend = end, yend = task), linewidth = 7,
               lineend = "round", alpha = 0.35) +
  geom_segment(data = started,
               aes(xend = progress_end, yend = task),
               linewidth = 7, lineend = "round", alpha = 1,
               show.legend = FALSE) +
  geom_vline(xintercept = today, color = INK_SOFT,
             linewidth = 0.6, linetype = "dashed") +
  annotate("text", x = today, y = n_tasks + 0.9,
           label = "Today", color = INK_SOFT, size = 3, hjust = -0.15) +
  scale_color_manual(values = IMPRINT_PALETTE) +
  scale_x_date(date_labels = "%b %Y", date_breaks = "1 month",
               expand = expansion(mult = c(0.02, 0.08))) +
  scale_y_discrete(expand = expansion(add = c(0.6, 1.3))) +
  guides(color = guide_legend(override.aes = list(linewidth = 5, alpha = 1))) +
  labs(
    title = "Product Launch Plan · gantt-basic · r · ggplot2 · anyplot.ai",
    x = "Timeline", y = NULL, color = "Workstream"
  ) +
  theme_minimal(base_size = 8) +
  theme(
    plot.background   = element_rect(fill = PAGE_BG, color = PAGE_BG),
    panel.background  = element_rect(fill = PAGE_BG, color = NA),
    panel.grid.major.x = element_line(color = alpha(INK, 0.18), linewidth = 0.25),
    panel.grid.major.y = element_blank(),
    panel.grid.minor  = element_blank(),
    axis.title        = element_text(color = INK, size = 10),
    axis.text.x       = element_text(color = INK_SOFT, size = 8),
    axis.text.y       = element_text(color = INK_SOFT, size = 8),
    axis.ticks        = element_blank(),
    plot.title        = element_text(color = INK, size = 12, face = "plain"),
    legend.position     = "top",
    legend.background   = element_rect(fill = PAGE_BG, color = NA),
    legend.text         = element_text(color = INK_SOFT, size = 8, margin = margin(l = 4, r = 14)),
    legend.title        = element_text(color = INK, size = 10, margin = margin(r = 10)),
    legend.key          = element_rect(fill = PAGE_BG, color = NA),
    legend.key.spacing.x = unit(0.4, "cm"),
    legend.margin       = margin(b = 6),
    plot.margin         = margin(12, 20, 8, 8)
  )

# --- Save -------------------------------------------------------------------
ggsave(
  filename = sprintf("plot-%s.png", THEME),
  plot     = p,
  device   = ragg::agg_png,
  width    = 8,
  height   = 4.5,
  units    = "in",
  dpi      = 400
)
Runnable source as JSON, for any HTTP client: https://api.anyplot.ai/specs/gantt-basic/ggplot2/code. Any spec id and library id listed in llms-full.txt fit the same URL shape; every URL below is complete and callable.
{
  "spec_id": "gantt-basic",
  "language": "r",
  "library": "ggplot2",
  "page": "https://anyplot.ai/gantt-basic/r/ggplot2",
  "hub": "https://anyplot.ai/gantt-basic",
  "code_json": "https://api.anyplot.ai/specs/gantt-basic/ggplot2/code",
  "spec_json": "https://api.anyplot.ai/specs/gantt-basic",
  "render_light_png": "https://storage.googleapis.com/anyplot-images/plots/gantt-basic/r/ggplot2/plot-light.png",
  "render_dark_png": "https://storage.googleapis.com/anyplot-images/plots/gantt-basic/r/ggplot2/plot-dark.png",
  "quality_score": 93.0,
  "license": "MIT",
  "guide": "https://anyplot.ai/llms.txt"
}
Part of Basic Gantt Chart on anyplot.ai.