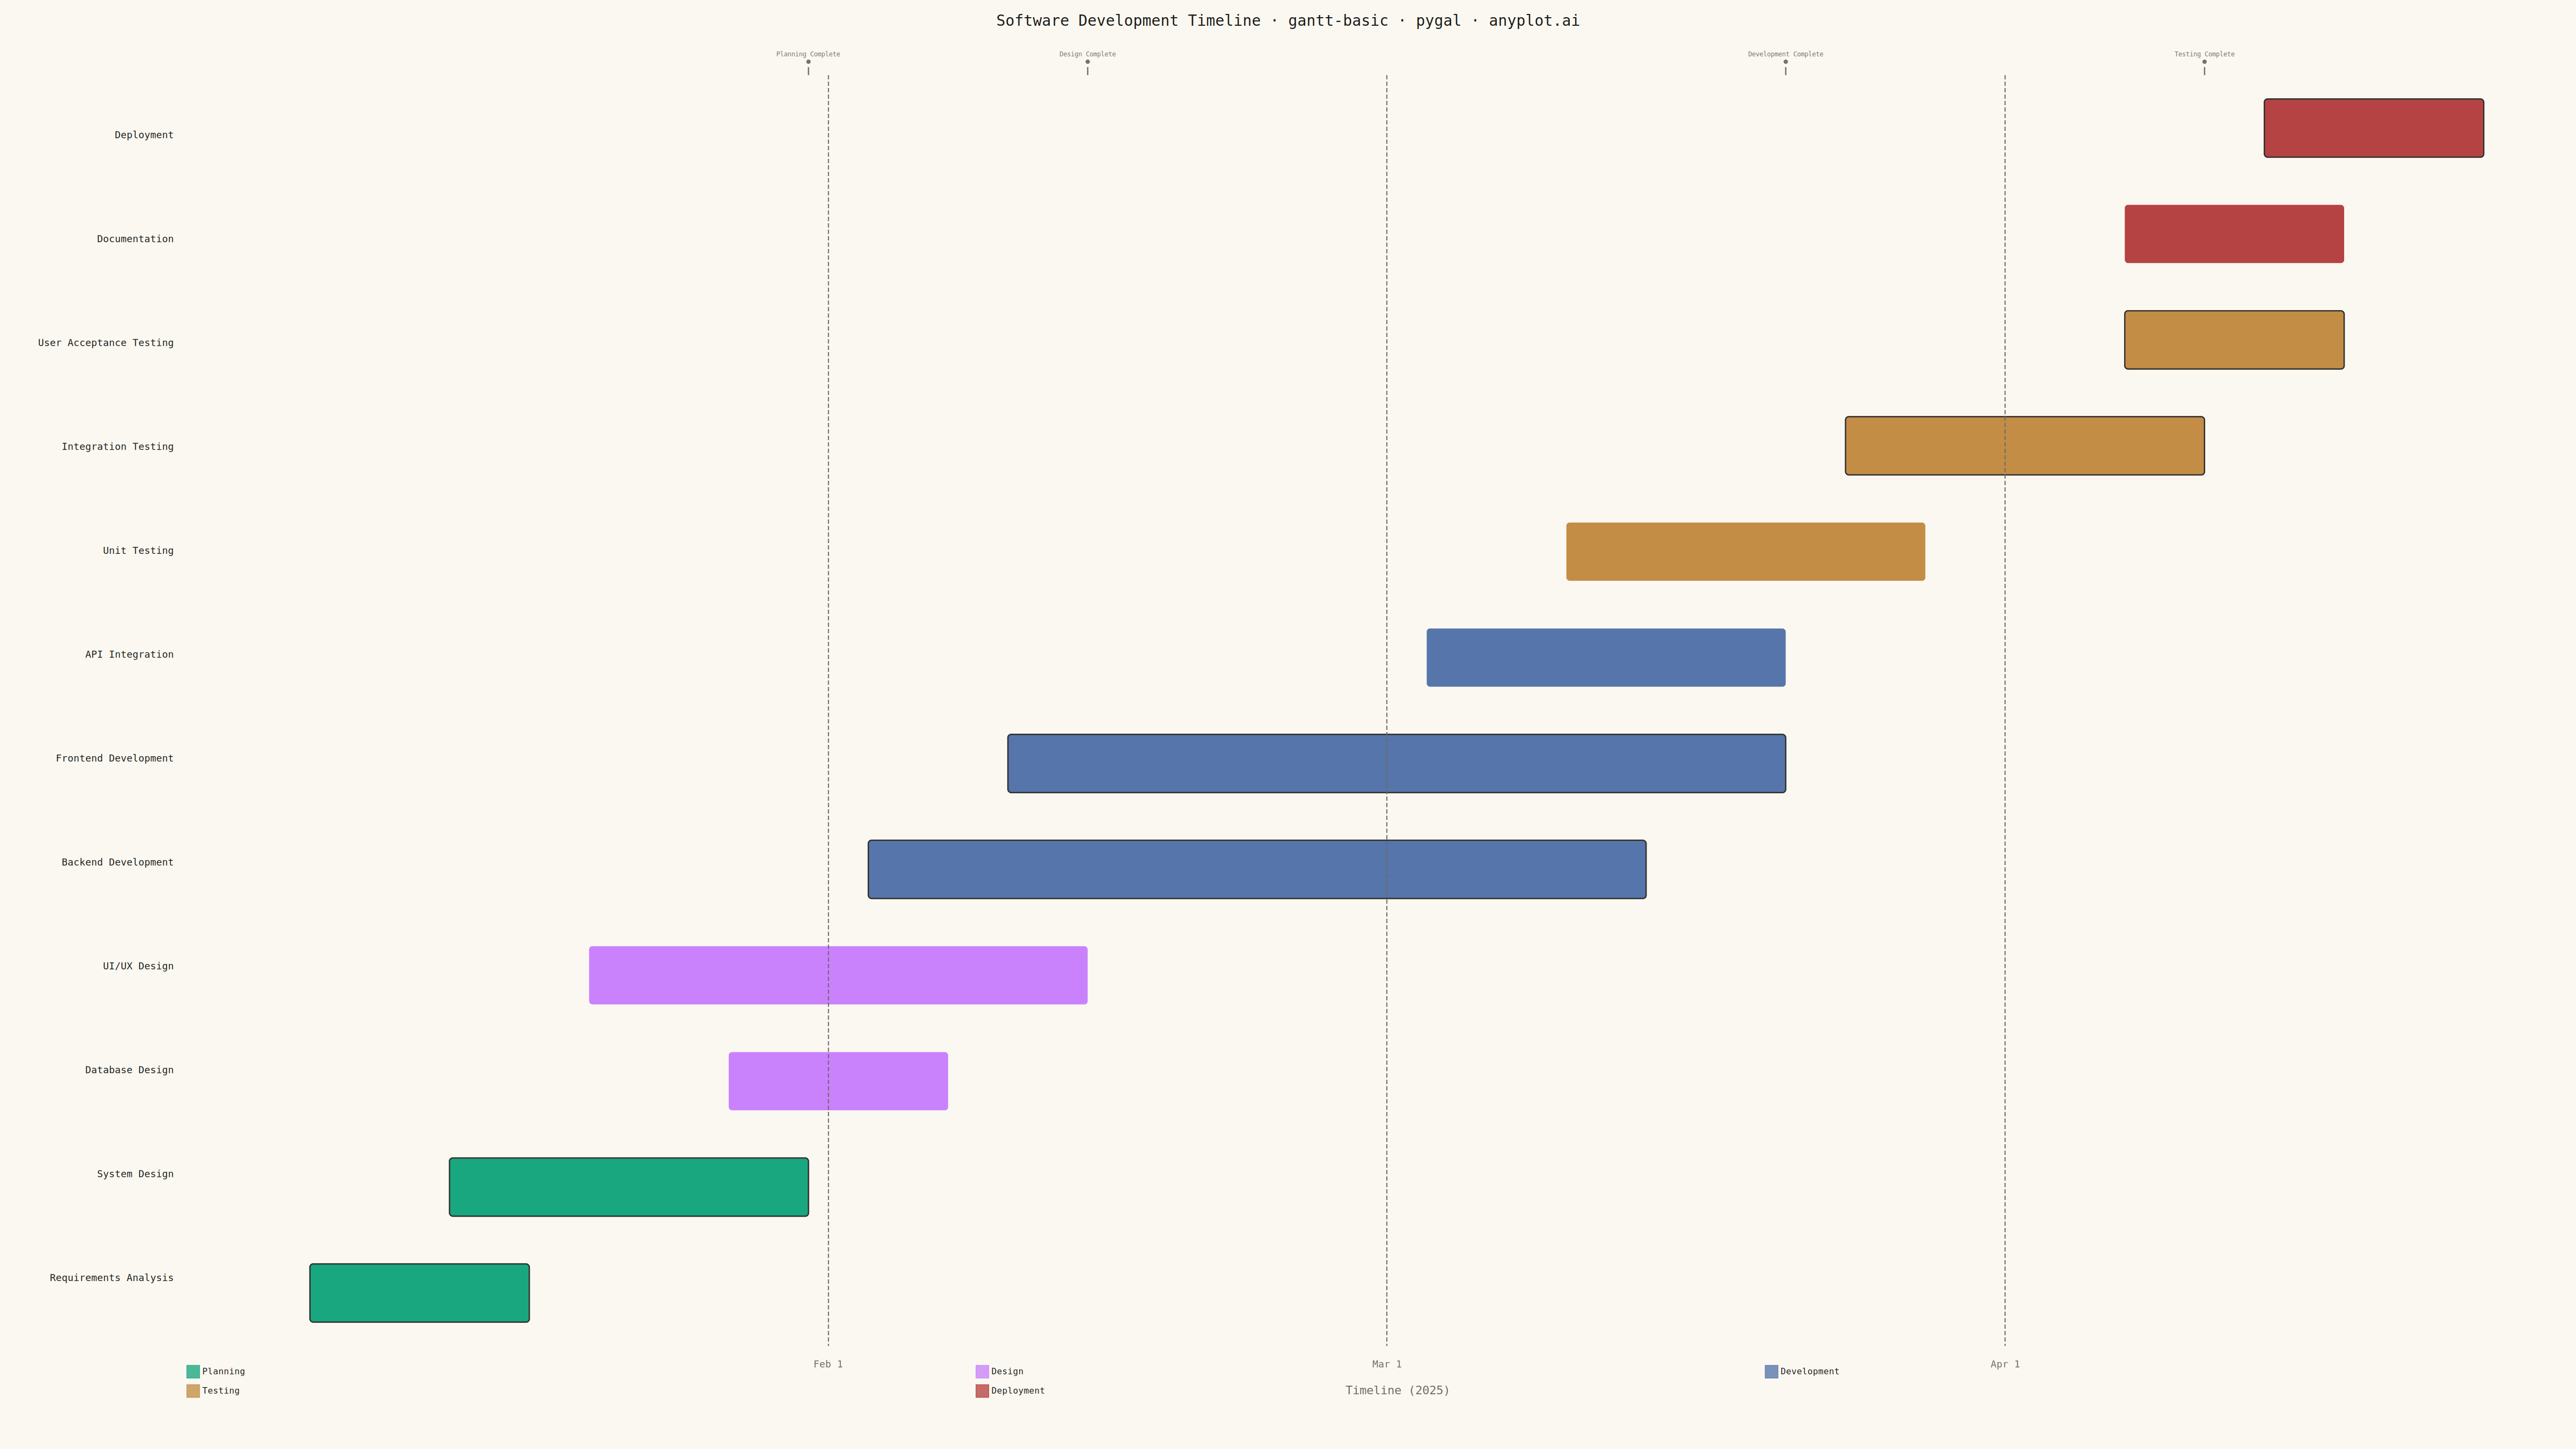
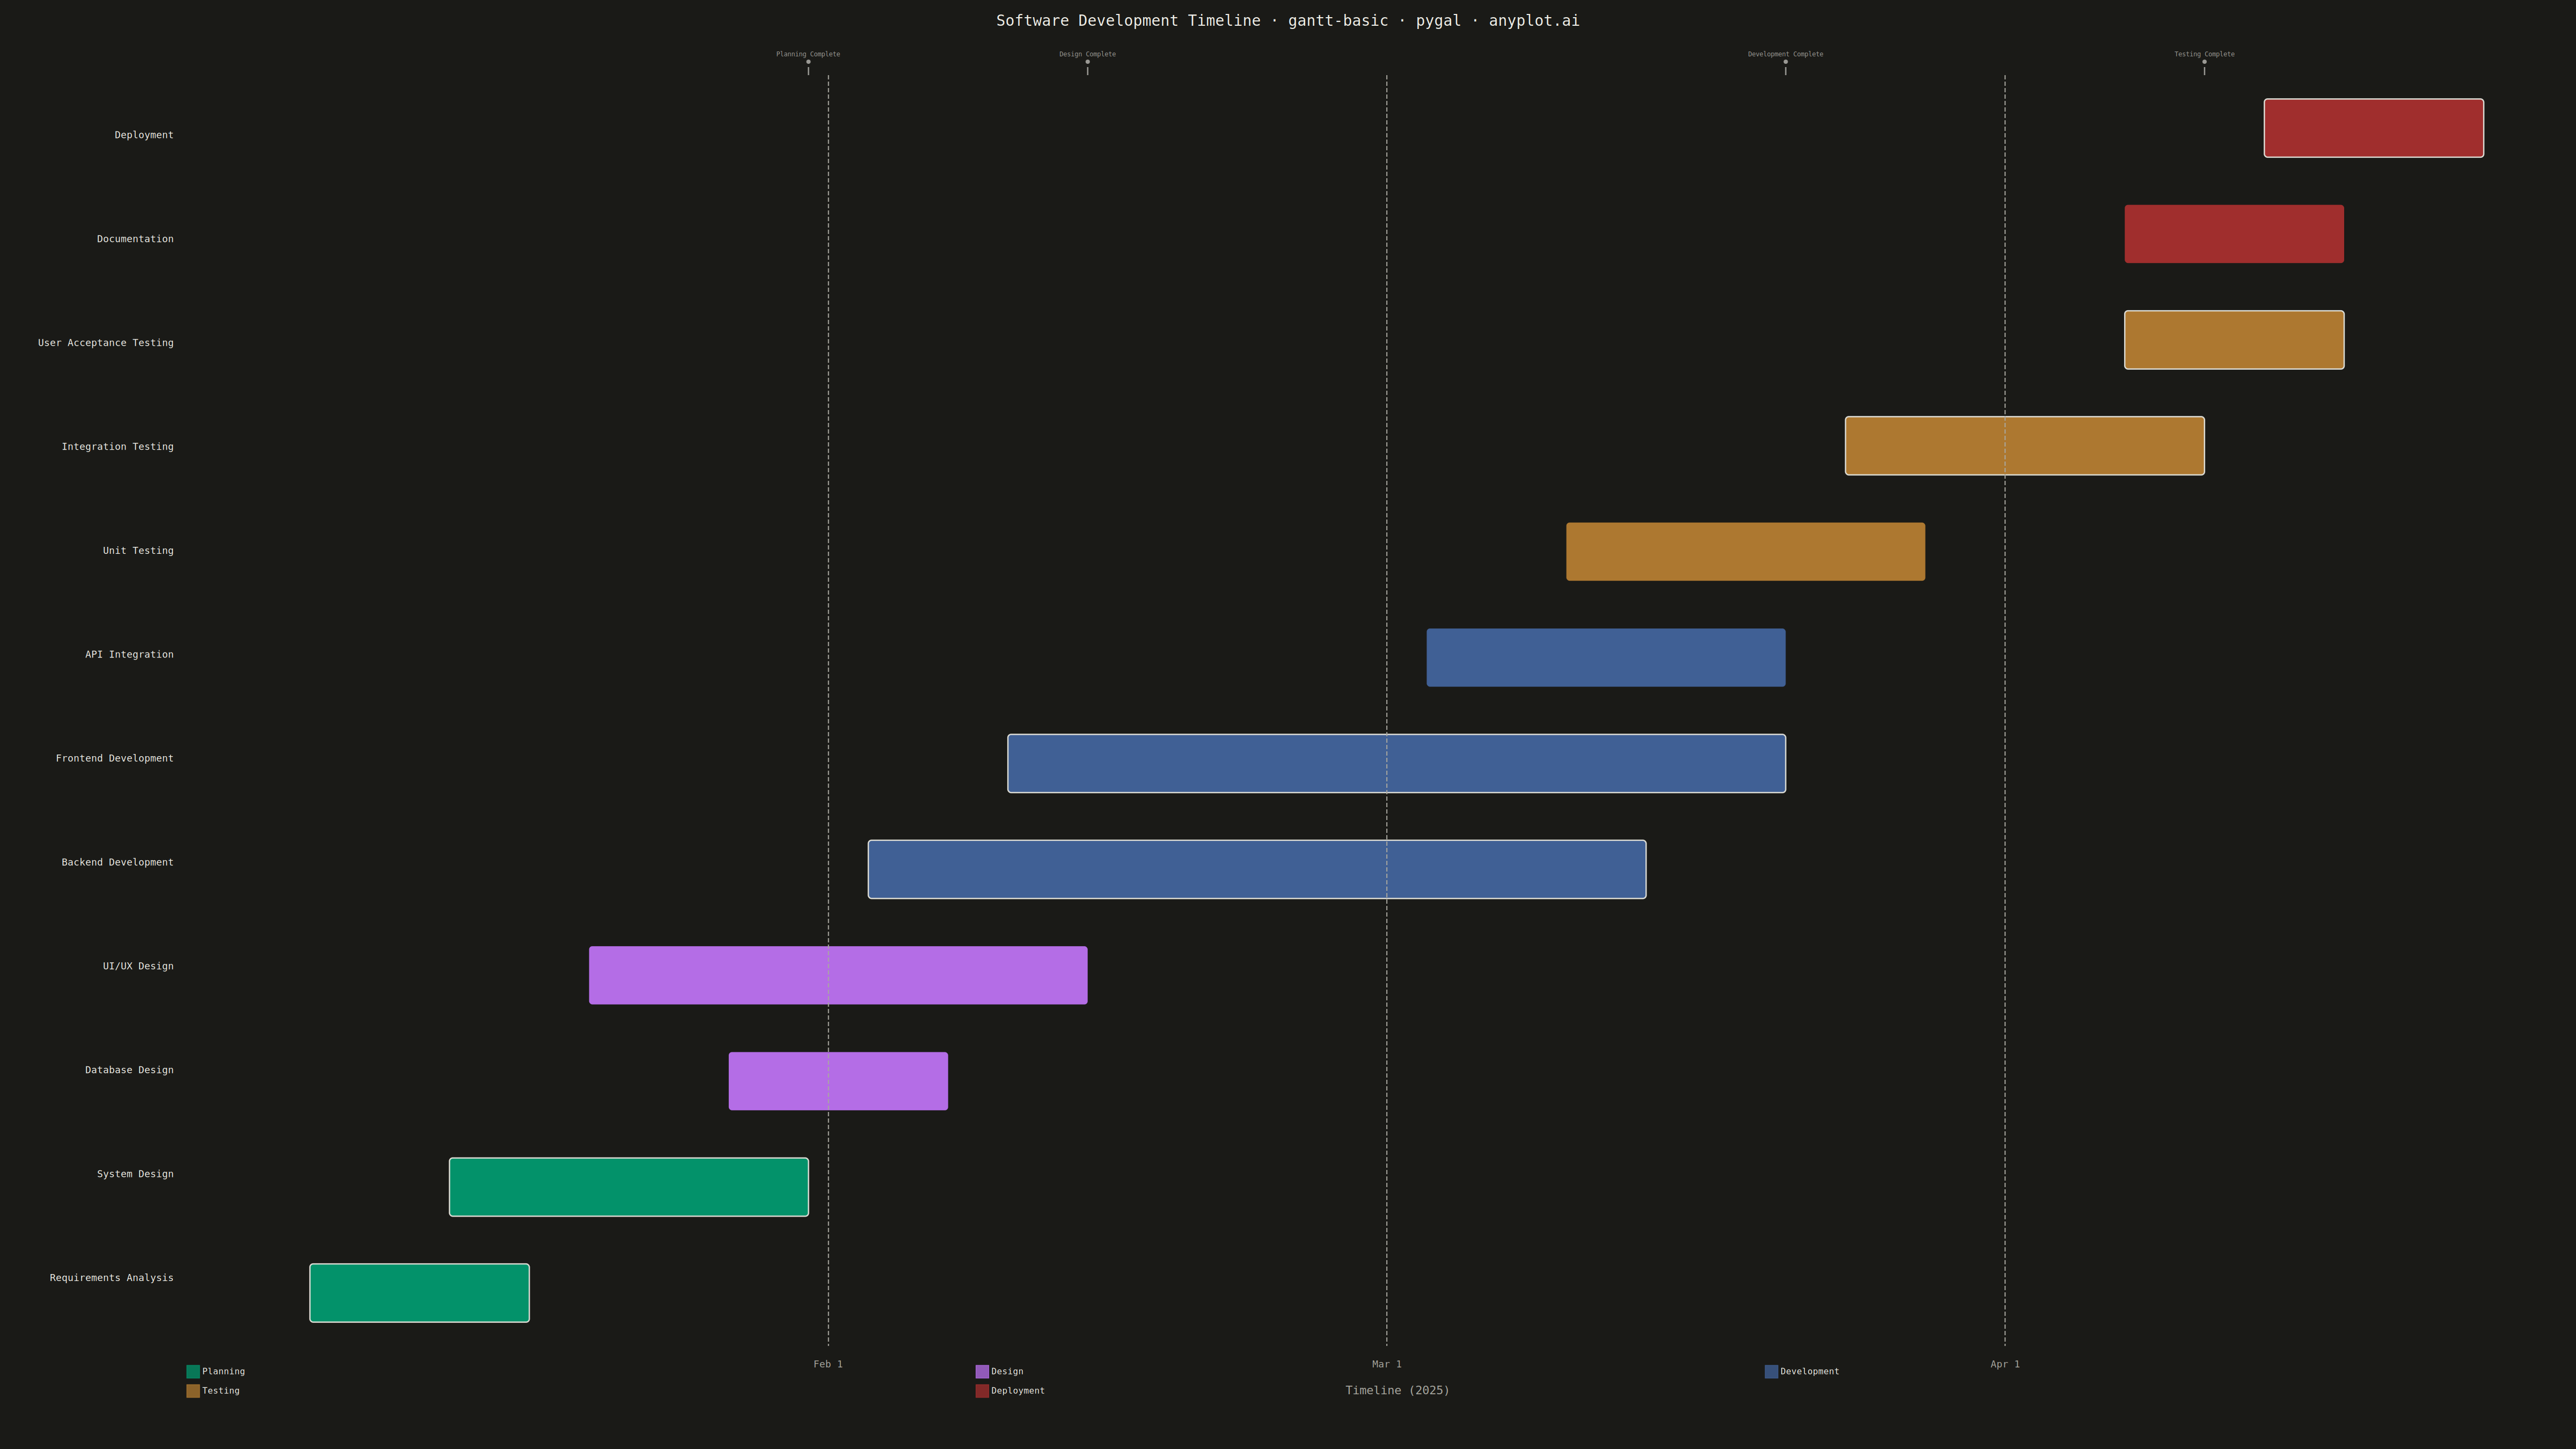
A Gantt chart is a horizontal bar chart that visualizes project schedules and timelines. Each task is represented as a horizontal bar spanning from its start date to end date, making it easy to see task durations, overlaps, and the overall project timeline at a glance. Gantt charts are essential for project management, helping teams understand task sequences and identify scheduling conflicts.
""" anyplot.ai
gantt-basic: Basic Gantt Chart
Library: pygal 3.1.0 | Python 3.13.13
Quality: 90/100 | Updated: 2026-05-10
"""
import os
import sys
from datetime import date
# Ensure venv site-packages is at the front of sys.path to avoid shadowing
venv_site = "/home/runner/work/anyplot/anyplot/.venv/lib/python3.13/site-packages"
sys.path.insert(0, venv_site)
import cairosvg
import pygal
from pygal.style import Style
THEME = os.getenv("ANYPLOT_THEME", "light")
PAGE_BG = "#FAF8F1" if THEME == "light" else "#1A1A17"
INK = "#1A1A17" if THEME == "light" else "#F0EFE8"
INK_MUTED = "#6B6A63" if THEME == "light" else "#A8A79F"
IMPRINT = ("#009E73", "#C475FD", "#4467A3", "#BD8233", "#AE3030")
custom_style = Style(
background=PAGE_BG,
plot_background=PAGE_BG,
foreground=INK,
foreground_strong=INK,
foreground_subtle=INK_MUTED,
colors=IMPRINT,
title_font_size=28,
label_font_size=18,
major_label_font_size=16,
legend_font_size=16,
value_font_size=14,
tooltip_font_size=14,
)
tasks = [
("Requirements Analysis", "Planning", date(2025, 1, 6), date(2025, 1, 17), True),
("System Design", "Planning", date(2025, 1, 13), date(2025, 1, 31), True),
("Database Design", "Design", date(2025, 1, 27), date(2025, 2, 7), False),
("UI/UX Design", "Design", date(2025, 1, 20), date(2025, 2, 14), False),
("Backend Development", "Development", date(2025, 2, 3), date(2025, 3, 14), True),
("Frontend Development", "Development", date(2025, 2, 10), date(2025, 3, 21), True),
("API Integration", "Development", date(2025, 3, 3), date(2025, 3, 21), False),
("Unit Testing", "Testing", date(2025, 3, 10), date(2025, 3, 28), False),
("Integration Testing", "Testing", date(2025, 3, 24), date(2025, 4, 11), True),
("User Acceptance Testing", "Testing", date(2025, 4, 7), date(2025, 4, 18), True),
("Documentation", "Deployment", date(2025, 4, 7), date(2025, 4, 18), False),
("Deployment", "Deployment", date(2025, 4, 14), date(2025, 4, 25), True),
]
reference_date = date(2025, 1, 1)
category_colors = {
"Planning": IMPRINT[0],
"Design": IMPRINT[1],
"Development": IMPRINT[2],
"Testing": IMPRINT[3],
"Deployment": IMPRINT[4],
}
all_dates = []
for _, _, start, end, _ in tasks:
all_dates.extend([start, end])
min_date = min(all_dates)
max_date = max(all_dates)
start_day = (min_date - reference_date).days - 3
end_day = (max_date - reference_date).days + 3
day_range = end_day - start_day
task_labels = [t[0] for t in tasks]
num_tasks = len(tasks)
chart = pygal.HorizontalBar(
width=4800,
height=2700,
style=custom_style,
title="Software Development Timeline · gantt-basic · pygal · anyplot.ai",
show_legend=True,
legend_at_bottom=True,
legend_box_size=24,
print_values=False,
show_y_guides=False,
show_x_guides=False,
show_x_labels=False,
margin=60,
spacing=20,
range=(0, 100),
)
chart.x_labels = task_labels
categories_in_order = ["Planning", "Design", "Development", "Testing", "Deployment"]
for cat in categories_in_order:
chart.add(cat, [None] * num_tasks)
svg_string = chart.render().decode("utf-8")
PLOT_ORIGIN_X = 466
PLOT_ORIGIN_Y = 140
PLOT_WIDTH = 4273.6
PLOT_HEIGHT = 2368.0
PLOT_LEFT = PLOT_ORIGIN_X
PLOT_TOP = PLOT_ORIGIN_Y
row_height = PLOT_HEIGHT / num_tasks
bar_height = row_height * 0.55
bar_elements = []
for i, (task_name, category, start, end, on_critical_path) in enumerate(tasks):
start_day_val = (start - reference_date).days
end_day_val = (end - reference_date).days
x_start = PLOT_LEFT + ((start_day_val - start_day) / day_range) * PLOT_WIDTH
x_end = PLOT_LEFT + ((end_day_val - start_day) / day_range) * PLOT_WIDTH
width = x_end - x_start
reversed_i = num_tasks - 1 - i
y_center = PLOT_TOP + (reversed_i + 0.5) * row_height
y_top = y_center - bar_height / 2
color = category_colors[category]
duration = (end - start).days
stroke_style = ""
if on_critical_path:
stroke_style = f' stroke="{INK}" stroke-width="2.5"'
bar_elements.append(
f'<rect x="{x_start:.1f}" y="{y_top:.1f}" width="{width:.1f}" '
f'height="{bar_height:.1f}" fill="{color}" rx="6" ry="6" opacity="0.9"{stroke_style}>'
f"<title>{task_name} {start.strftime('%b %d')} - {end.strftime('%b %d')} "
f"({duration} days){' • CRITICAL PATH' if on_critical_path else ''}</title></rect>"
)
milestone_dates = [
(date(2025, 1, 31), "Planning Complete"),
(date(2025, 2, 14), "Design Complete"),
(date(2025, 3, 21), "Development Complete"),
(date(2025, 4, 11), "Testing Complete"),
]
milestone_markers = []
for milestone_date, milestone_label in milestone_dates:
day_val = (milestone_date - reference_date).days
if start_day <= day_val <= end_day:
x_pos = PLOT_LEFT + ((day_val - start_day) / day_range) * PLOT_WIDTH
milestone_markers.append(
f'<line x1="{x_pos:.1f}" y1="{PLOT_TOP - 15}" x2="{x_pos:.1f}" '
f'y2="{PLOT_TOP}" stroke="{INK}" stroke-width="2.5" opacity="0.6"/>'
)
milestone_markers.append(f'<circle cx="{x_pos:.1f}" cy="{PLOT_TOP - 25}" r="4" fill="{INK}" opacity="0.6"/>')
milestone_markers.append(
f'<text x="{x_pos:.1f}" y="{PLOT_TOP - 35}" '
f'font-family="Consolas, monospace" font-size="12" fill="{INK}" opacity="0.6" '
f'text-anchor="middle">{milestone_label}</text>'
)
month_markers = []
for month in range(1, 5):
month_date = date(2025, month, 1)
day_val = (month_date - reference_date).days
if start_day <= day_val <= end_day:
x_pos = PLOT_LEFT + ((day_val - start_day) / day_range) * PLOT_WIDTH
month_name = month_date.strftime("%b")
month_markers.append(
f'<line x1="{x_pos:.1f}" y1="{PLOT_TOP}" x2="{x_pos:.1f}" '
f'y2="{PLOT_TOP + PLOT_HEIGHT}" stroke="{INK_MUTED}" stroke-width="2" '
f'stroke-dasharray="8,4"/>'
)
month_markers.append(
f'<text x="{x_pos:.1f}" y="{PLOT_TOP + PLOT_HEIGHT + 40}" '
f'font-family="Consolas, monospace" font-size="18" fill="{INK_MUTED}" '
f'text-anchor="middle">{month_name} 1</text>'
)
month_markers.append(
f'<text x="{PLOT_LEFT + PLOT_WIDTH / 2}" y="{PLOT_TOP + PLOT_HEIGHT + 90}" '
f'font-family="Consolas, monospace" font-size="22" fill="{INK_MUTED}" '
f'text-anchor="middle">Timeline (2025)</text>'
)
all_elements = "\n".join(bar_elements + milestone_markers + month_markers)
svg_output = svg_string.replace("</svg>", f"{all_elements}\n</svg>")
svg_output = svg_output.replace(">No data<", "><")
with open(f"plot-{THEME}.html", "w") as f:
f.write(svg_output)
cairosvg.svg2png(bytestring=svg_output.encode(), write_to=f"plot-{THEME}.png")
Runnable source as JSON, for any HTTP client: https://api.anyplot.ai/specs/gantt-basic/pygal/code. Any spec id and library id listed in llms-full.txt fit the same URL shape; every URL below is complete and callable.
{
  "spec_id": "gantt-basic",
  "language": "python",
  "library": "pygal",
  "page": "https://anyplot.ai/gantt-basic/python/pygal",
  "hub": "https://anyplot.ai/gantt-basic",
  "code_json": "https://api.anyplot.ai/specs/gantt-basic/pygal/code",
  "spec_json": "https://api.anyplot.ai/specs/gantt-basic",
  "render_light_png": "https://storage.googleapis.com/anyplot-images/plots/gantt-basic/python/pygal/plot-light.png",
  "render_dark_png": "https://storage.googleapis.com/anyplot-images/plots/gantt-basic/python/pygal/plot-dark.png",
  "interactive_light_html": "https://storage.googleapis.com/anyplot-images/plots/gantt-basic/python/pygal/plot-light.html",
  "interactive_dark_html": "https://storage.googleapis.com/anyplot-images/plots/gantt-basic/python/pygal/plot-dark.html",
  "quality_score": 90.0,
  "license": "MIT",
  "guide": "https://anyplot.ai/llms.txt"
}
Part of Basic Gantt Chart on anyplot.ai.