The same plot in 14 other libraries — JavaScript: Chart.js, Apache ECharts, Highcharts, MUI X Charts; Python: Altair, Bokeh, lets-plot, Matplotlib, Plotly, plotnine, Pygal, Seaborn; R: ggplot2; Julia: Makie.jl. Compare all 15 side by side: Basic Gantt Chart in Python, R, Julia and JavaScript.
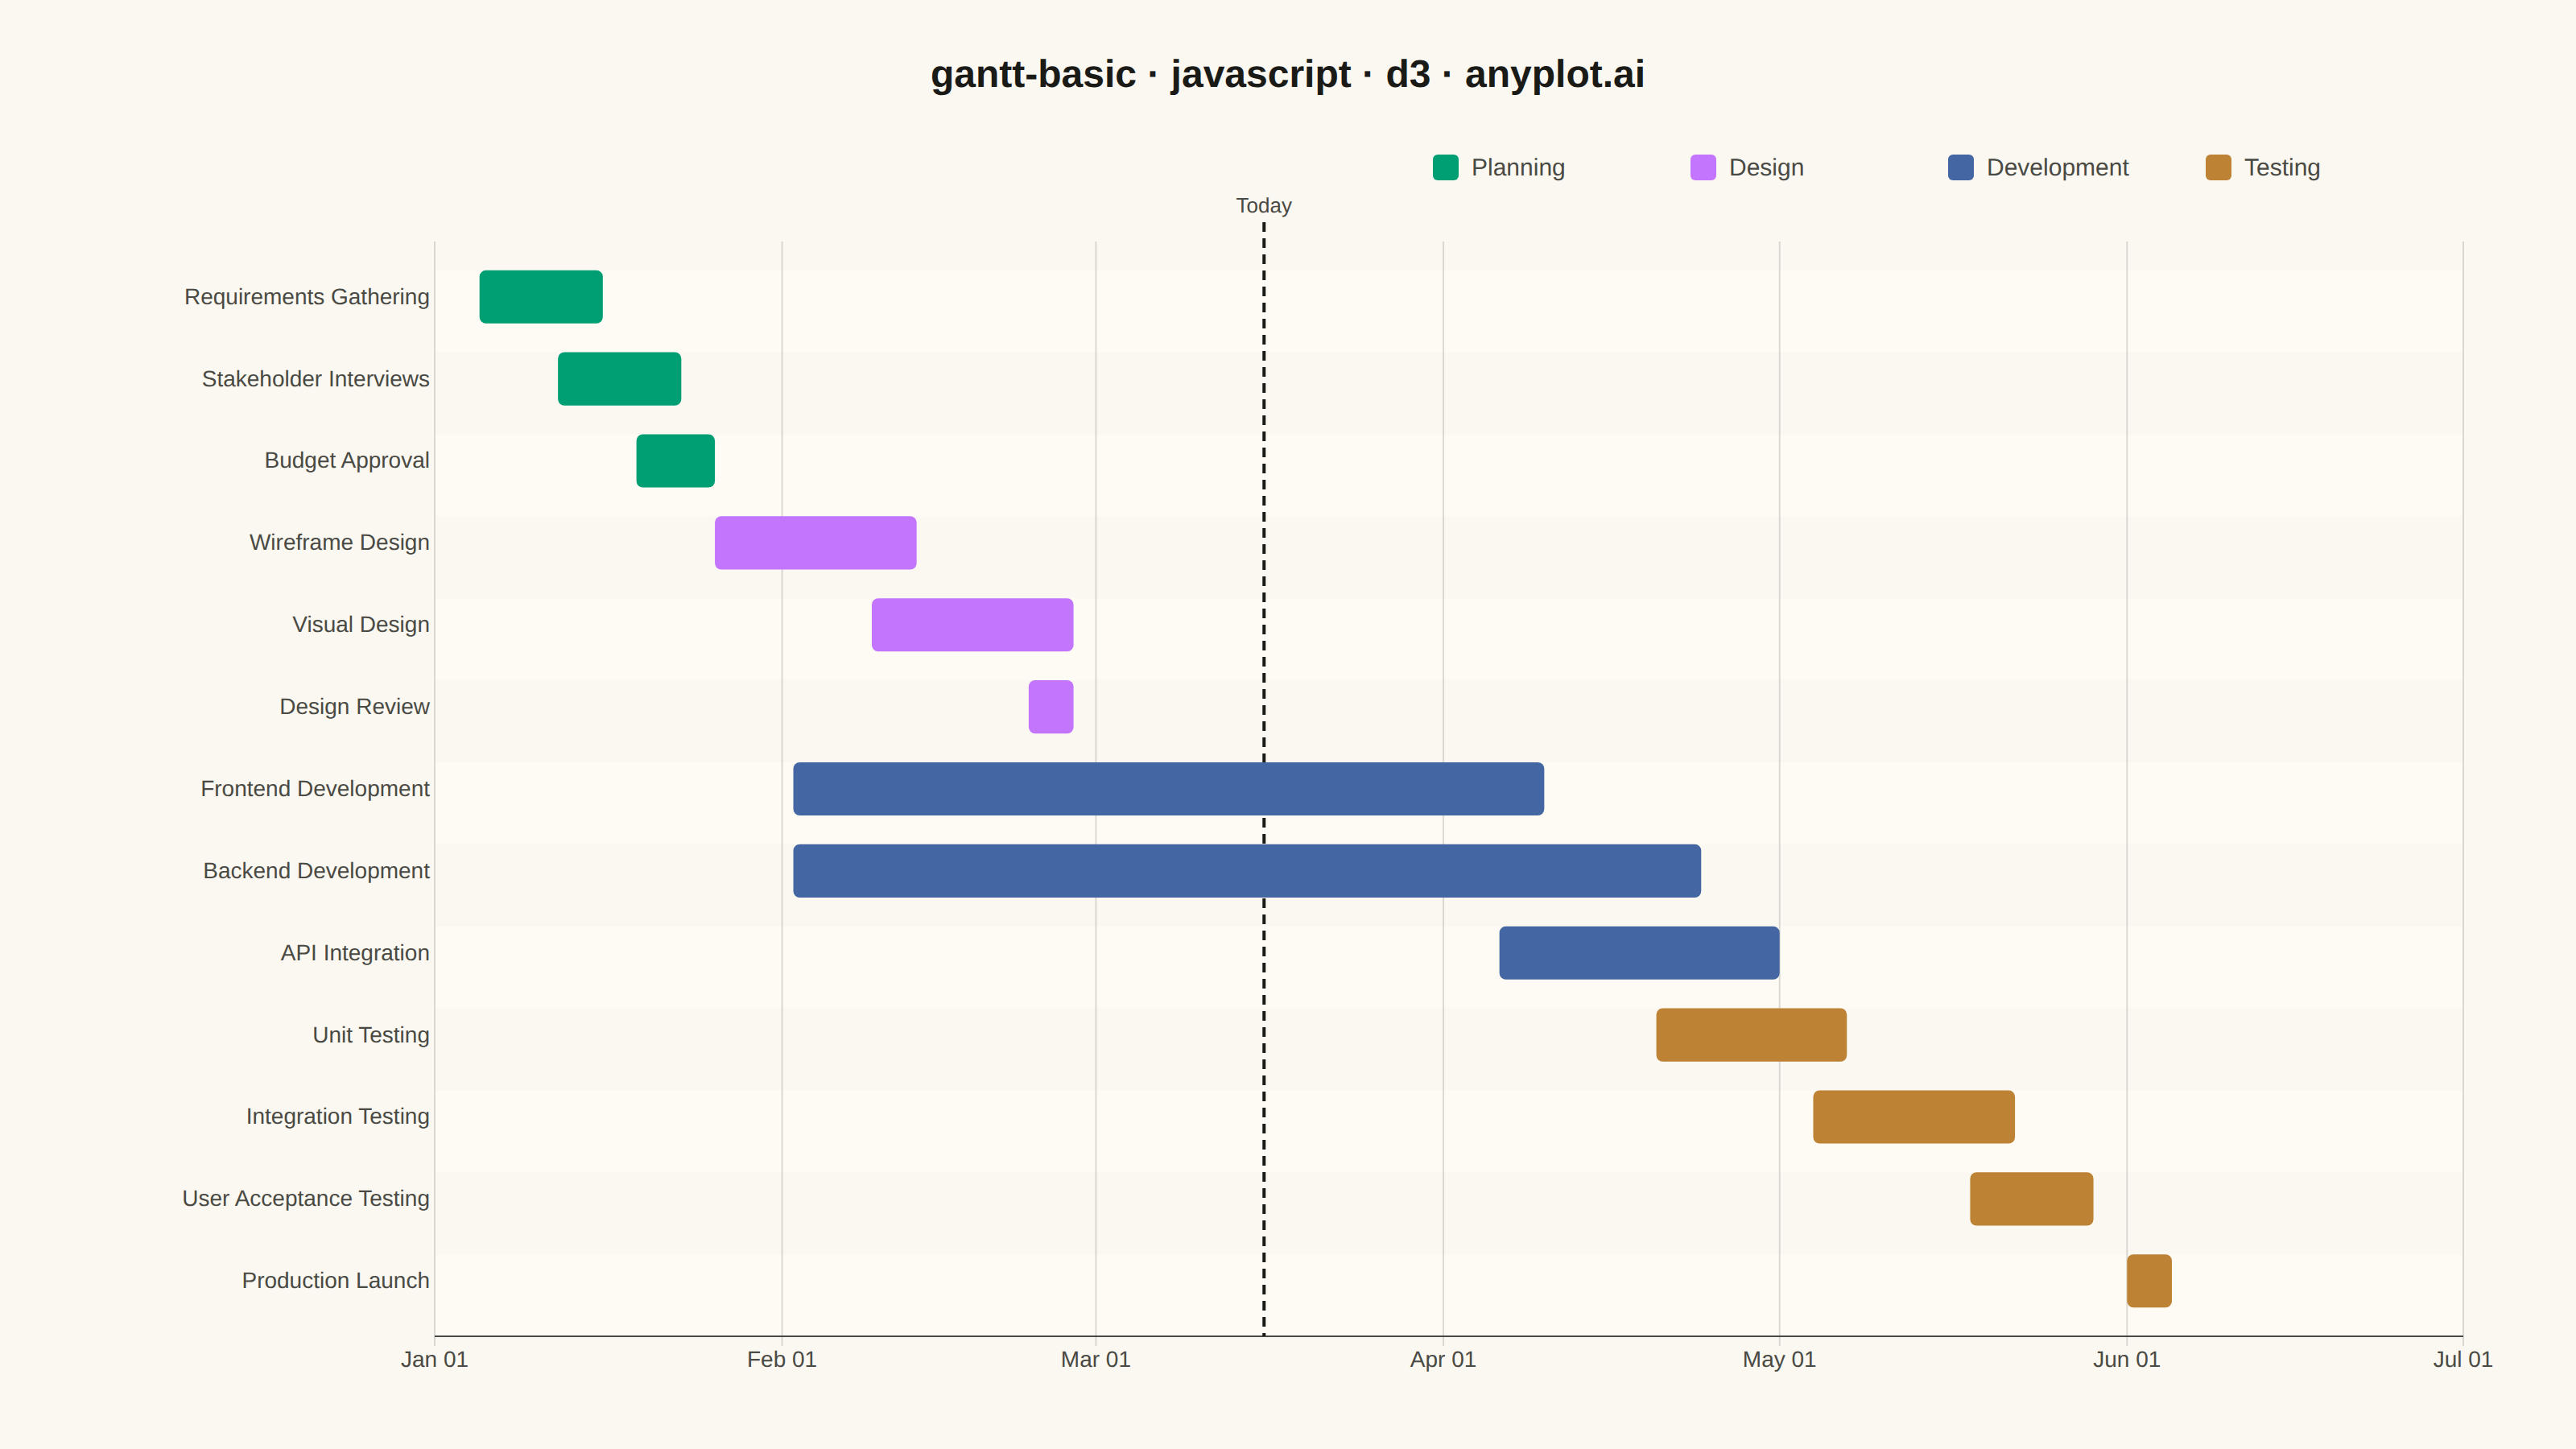
A Gantt chart is a horizontal bar chart that visualizes project schedules and timelines. Each task is represented as a horizontal bar spanning from its start date to end date, making it easy to see task durations, overlaps, and the overall project timeline at a glance. Gantt charts are essential for project management, helping teams understand task sequences and identify scheduling conflicts.
// anyplot.ai
// gantt-basic: Basic Gantt Chart
// Library: d3 7.9.0 | JavaScript 22.23.2
// Quality: 92/100 | Created: 2026-09-05

const t = window.ANYPLOT_TOKENS;
const { width, height } = window.ANYPLOT_SIZE;
const margin = { top: 150, right: 70, bottom: 70, left: 270 };
const iw = width - margin.left - margin.right;
const ih = height - margin.top - margin.bottom;

// --- Data (in-memory, deterministic) ----------------------------------------
// Website redesign project schedule, ordered by start date (earliest on top).
const tasks = [
  { task: "Requirements Gathering", start: new Date(2026, 0, 5), end: new Date(2026, 0, 16), category: "Planning" },
  { task: "Stakeholder Interviews", start: new Date(2026, 0, 12), end: new Date(2026, 0, 23), category: "Planning" },
  { task: "Budget Approval", start: new Date(2026, 0, 19), end: new Date(2026, 0, 26), category: "Planning" },
  { task: "Wireframe Design", start: new Date(2026, 0, 26), end: new Date(2026, 1, 13), category: "Design" },
  { task: "Visual Design", start: new Date(2026, 1, 9), end: new Date(2026, 1, 27), category: "Design" },
  { task: "Design Review", start: new Date(2026, 1, 23), end: new Date(2026, 1, 27), category: "Design" },
  { task: "Frontend Development", start: new Date(2026, 1, 2), end: new Date(2026, 3, 10), category: "Development" },
  { task: "Backend Development", start: new Date(2026, 1, 2), end: new Date(2026, 3, 24), category: "Development" },
  { task: "API Integration", start: new Date(2026, 3, 6), end: new Date(2026, 4, 1), category: "Development" },
  { task: "Unit Testing", start: new Date(2026, 3, 20), end: new Date(2026, 4, 7), category: "Testing" },
  { task: "Integration Testing", start: new Date(2026, 4, 4), end: new Date(2026, 4, 22), category: "Testing" },
  { task: "User Acceptance Testing", start: new Date(2026, 4, 18), end: new Date(2026, 4, 29), category: "Testing" },
  { task: "Production Launch", start: new Date(2026, 5, 1), end: new Date(2026, 5, 5), category: "Testing" },
];

const categories = ["Planning", "Design", "Development", "Testing"];
const color = d3.scaleOrdinal().domain(categories).range(t.palette.slice(0, categories.length));
const referenceDate = new Date(2026, 2, 16);

// --- Scales ------------------------------------------------------------------
const x = d3
  .scaleTime()
  .domain([d3.min(tasks, (d) => d.start), d3.max(tasks, (d) => d.end)])
  .nice(d3.timeMonth)
  .range([0, iw]);

const y = d3
  .scaleBand()
  .domain(tasks.map((d) => d.task))
  .range([0, ih])
  .padding(0.35);

// --- SVG mount ---------------------------------------------------------------
const svg = d3.select("#container").append("svg").attr("width", width).attr("height", height);

// --- Title ---------------------------------------------------------------------
svg
  .append("text")
  .attr("x", width / 2)
  .attr("y", 54)
  .attr("text-anchor", "middle")
  .attr("fill", t.ink)
  .style("font-size", "24px")
  .style("font-weight", "600")
  .text("gantt-basic · javascript · d3 · anyplot.ai");

// --- Legend (category color key) ---------------------------------------------
const legend = svg.append("g").attr("transform", `translate(${width - margin.right - 640},96)`);
const legendItem = legend
  .selectAll("g")
  .data(categories)
  .join("g")
  .attr("transform", (_d, i) => `translate(${i * 160},0)`);
legendItem
  .append("rect")
  .attr("width", 16)
  .attr("height", 16)
  .attr("rx", 3)
  .attr("fill", (d) => color(d));
legendItem
  .append("text")
  .attr("x", 24)
  .attr("y", 13)
  .attr("fill", t.inkSoft)
  .style("font-size", "15px")
  .text((d) => d);

const g = svg.append("g").attr("transform", `translate(${margin.left},${margin.top})`);

// --- Row banding (alternating rows aid scanning across many tasks) -----------
g.selectAll(".row-band")
  .data(tasks)
  .join("rect")
  .attr("class", "row-band")
  .attr("x", 0)
  .attr("y", (d) => y(d.task))
  .attr("width", iw)
  .attr("height", y.bandwidth() / (1 - 0.35))
  .attr("fill", t.elevatedBg)
  .attr("opacity", (_d, i) => (i % 2 === 0 ? 0.5 : 0));

// --- Vertical gridlines (aligned to x-axis month ticks) -----------------------
g.append("g")
  .attr("class", "grid")
  .selectAll("line")
  .data(x.ticks(d3.timeMonth.every(1)))
  .join("line")
  .attr("x1", (d) => x(d))
  .attr("x2", (d) => x(d))
  .attr("y1", 0)
  .attr("y2", ih)
  .attr("stroke", t.grid);

// --- Axes ----------------------------------------------------------------------
const xAxis = g
  .append("g")
  .attr("transform", `translate(0,${ih})`)
  .call(d3.axisBottom(x).ticks(d3.timeMonth.every(1)).tickFormat(d3.timeFormat("%b %d")).tickSizeOuter(0));
xAxis.selectAll("text").attr("fill", t.inkSoft).style("font-size", "14px");
xAxis.selectAll("line").attr("stroke", t.grid);
xAxis.select(".domain").attr("stroke", t.inkSoft);

const yAxis = g.append("g").call(d3.axisLeft(y).tickSize(0));
yAxis.selectAll("text").attr("fill", t.inkSoft).style("font-size", "14px");
yAxis.select(".domain").remove();

// --- Reference line (current-date marker) -------------------------------------
g.append("line")
  .attr("x1", x(referenceDate))
  .attr("x2", x(referenceDate))
  .attr("y1", -12)
  .attr("y2", ih)
  .attr("stroke", t.ink)
  .attr("stroke-width", 2)
  .attr("stroke-dasharray", "6,4");
g.append("text")
  .attr("x", x(referenceDate))
  .attr("y", -18)
  .attr("text-anchor", "middle")
  .attr("fill", t.inkSoft)
  .style("font-size", "13px")
  .text("Today");

// --- Task bars -------------------------------------------------------------
g.selectAll(".task-bar")
  .data(tasks)
  .join("rect")
  .attr("class", "task-bar")
  .attr("x", (d) => x(d.start))
  .attr("y", (d) => y(d.task))
  .attr("width", (d) => Math.max(2, x(d.end) - x(d.start)))
  .attr("height", y.bandwidth())
  .attr("rx", 4)
  .attr("fill", (d) => color(d.category));
Runnable source as JSON, for any HTTP client: https://api.anyplot.ai/specs/gantt-basic/d3/code. Any spec id and library id listed in llms-full.txt fit the same URL shape; every URL below is complete and callable.
{
  "spec_id": "gantt-basic",
  "language": "javascript",
  "library": "d3",
  "page": "https://anyplot.ai/gantt-basic/javascript/d3",
  "hub": "https://anyplot.ai/gantt-basic",
  "code_json": "https://api.anyplot.ai/specs/gantt-basic/d3/code",
  "spec_json": "https://api.anyplot.ai/specs/gantt-basic",
  "render_light_png": "https://storage.googleapis.com/anyplot-images/plots/gantt-basic/javascript/d3/plot-light.png",
  "render_dark_png": "https://storage.googleapis.com/anyplot-images/plots/gantt-basic/javascript/d3/plot-dark.png",
  "interactive_light_html": "https://storage.googleapis.com/anyplot-images/plots/gantt-basic/javascript/d3/plot-light.html",
  "interactive_dark_html": "https://storage.googleapis.com/anyplot-images/plots/gantt-basic/javascript/d3/plot-dark.html",
  "quality_score": 92.0,
  "license": "MIT",
  "guide": "https://anyplot.ai/llms.txt"
}
Part of Basic Gantt Chart on anyplot.ai.