The same plot in 14 other libraries — JavaScript: D3.js, Apache ECharts, Highcharts, MUI X Charts; Python: Altair, Bokeh, lets-plot, Matplotlib, Plotly, plotnine, Pygal, Seaborn; R: ggplot2; Julia: Makie.jl. Compare all 15 side by side: Basic Gantt Chart in Python, R, Julia and JavaScript.
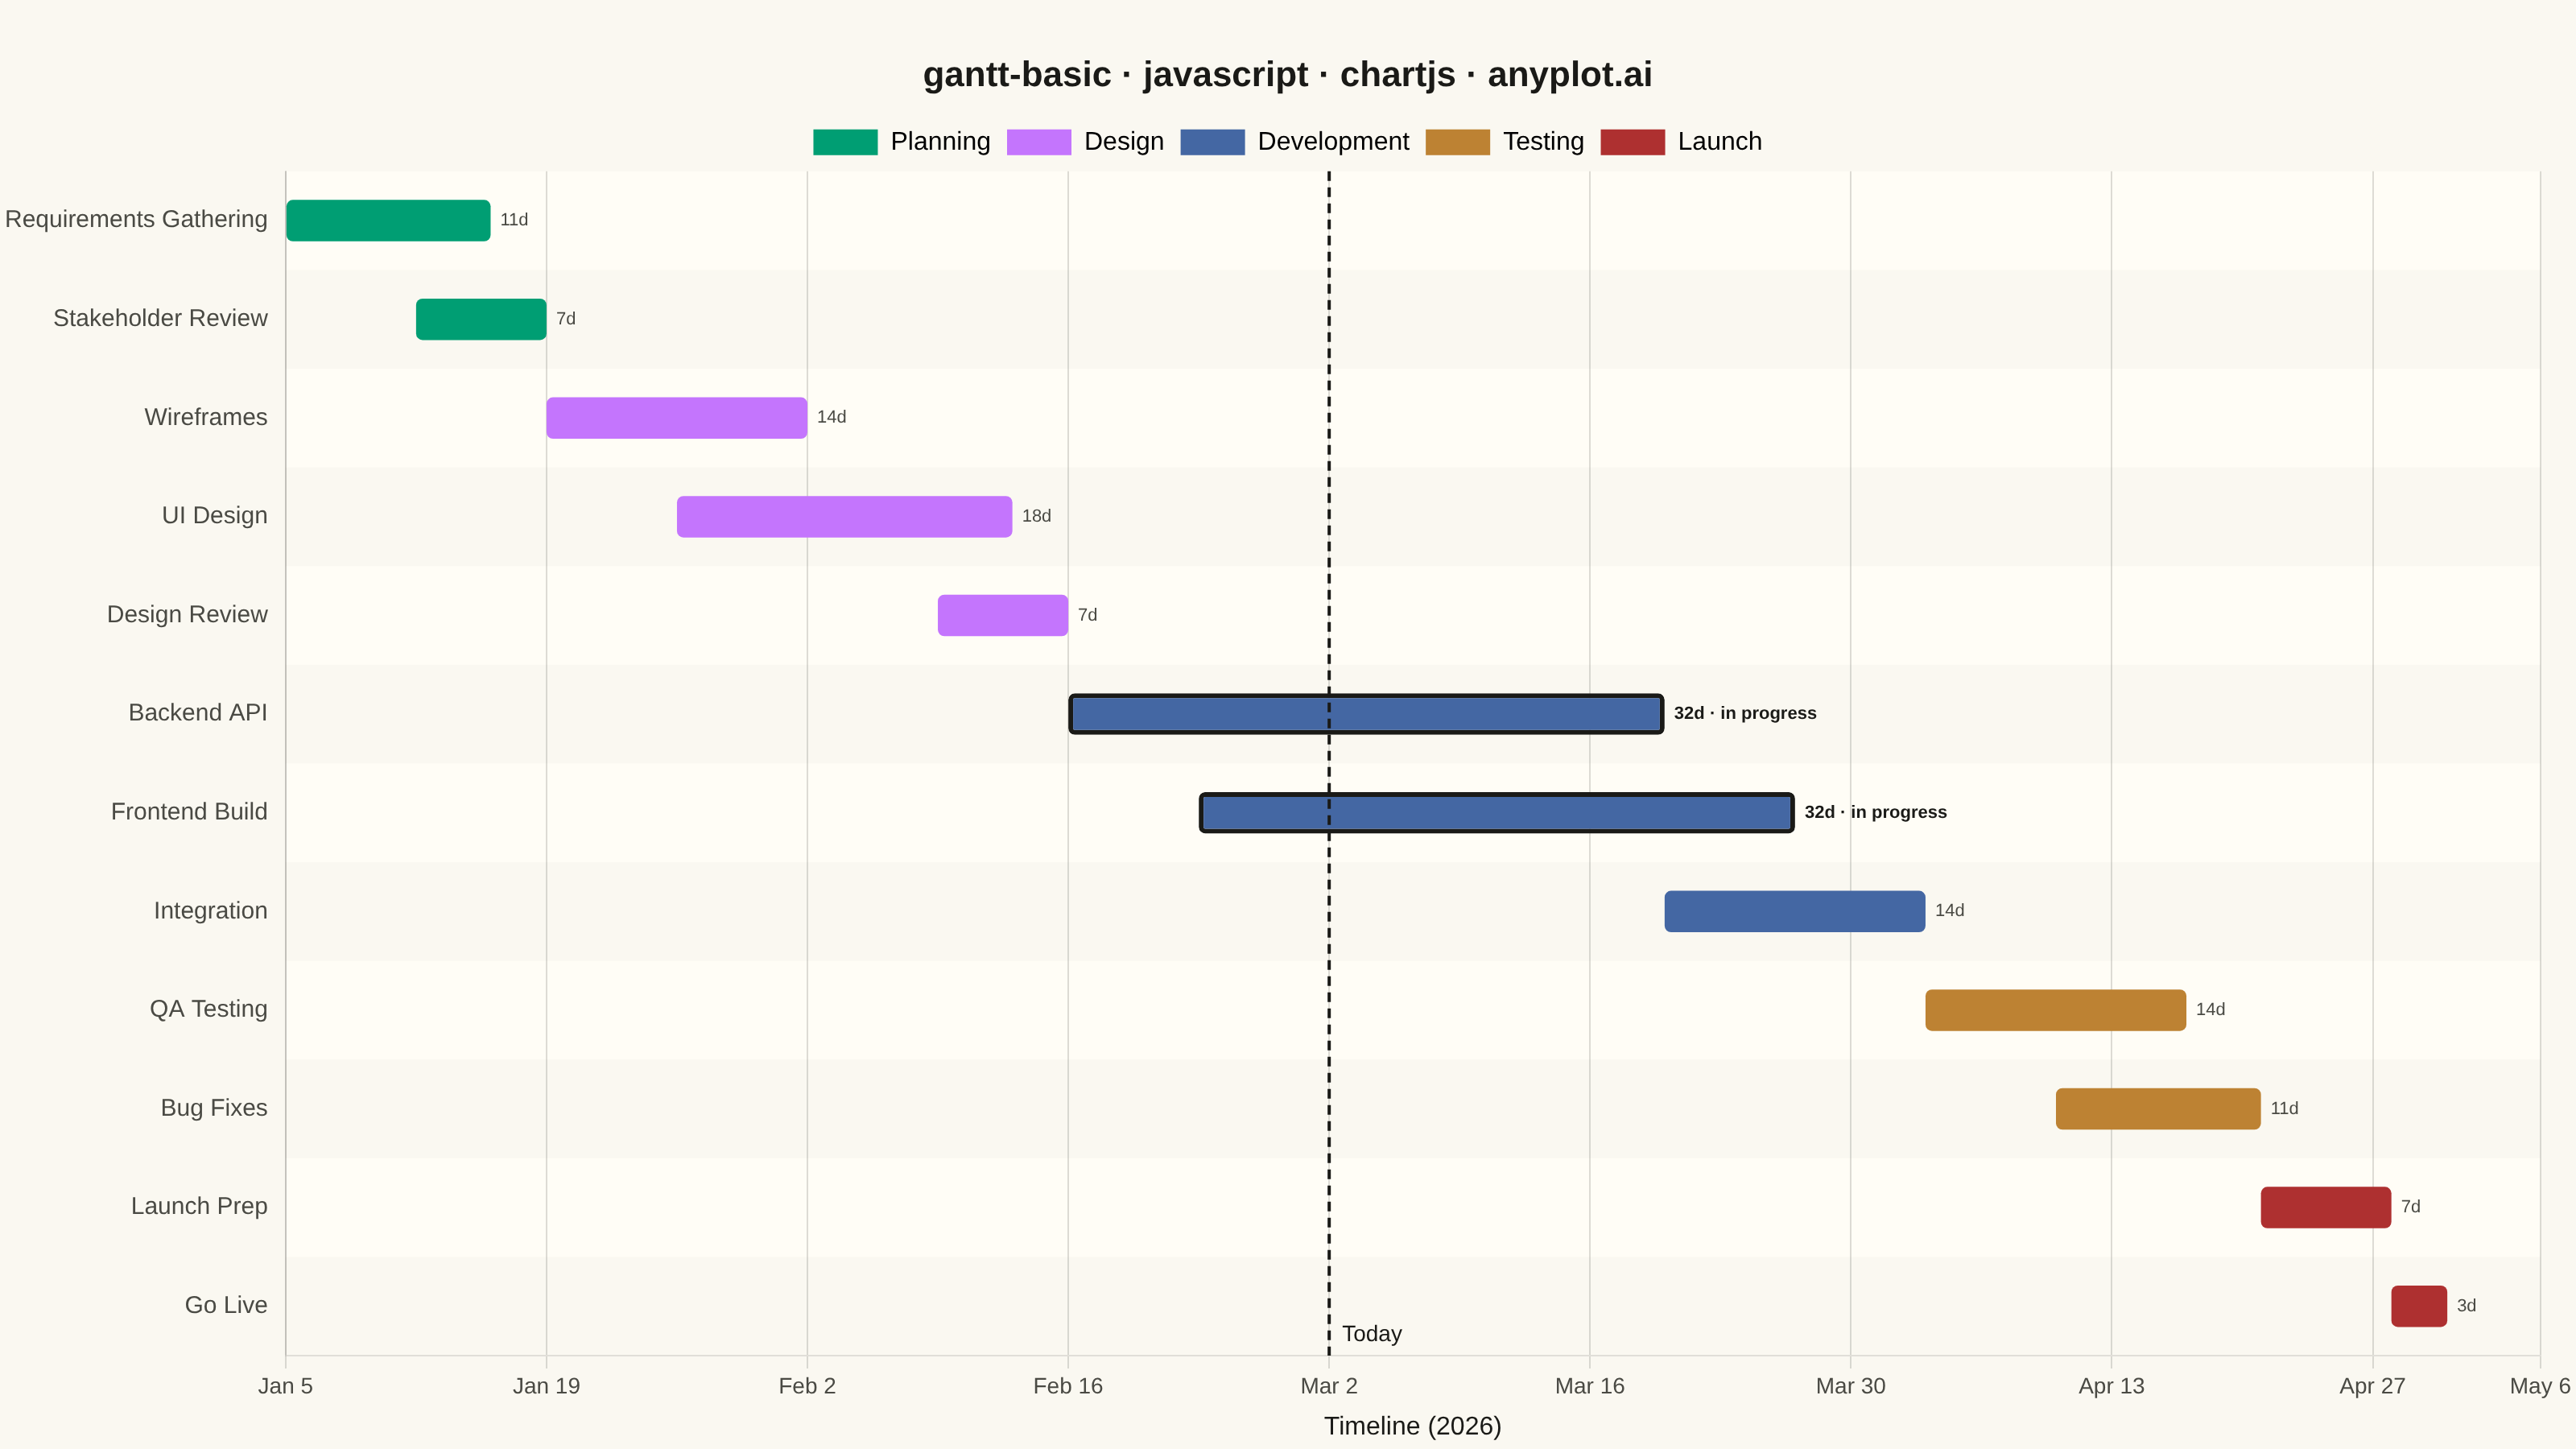
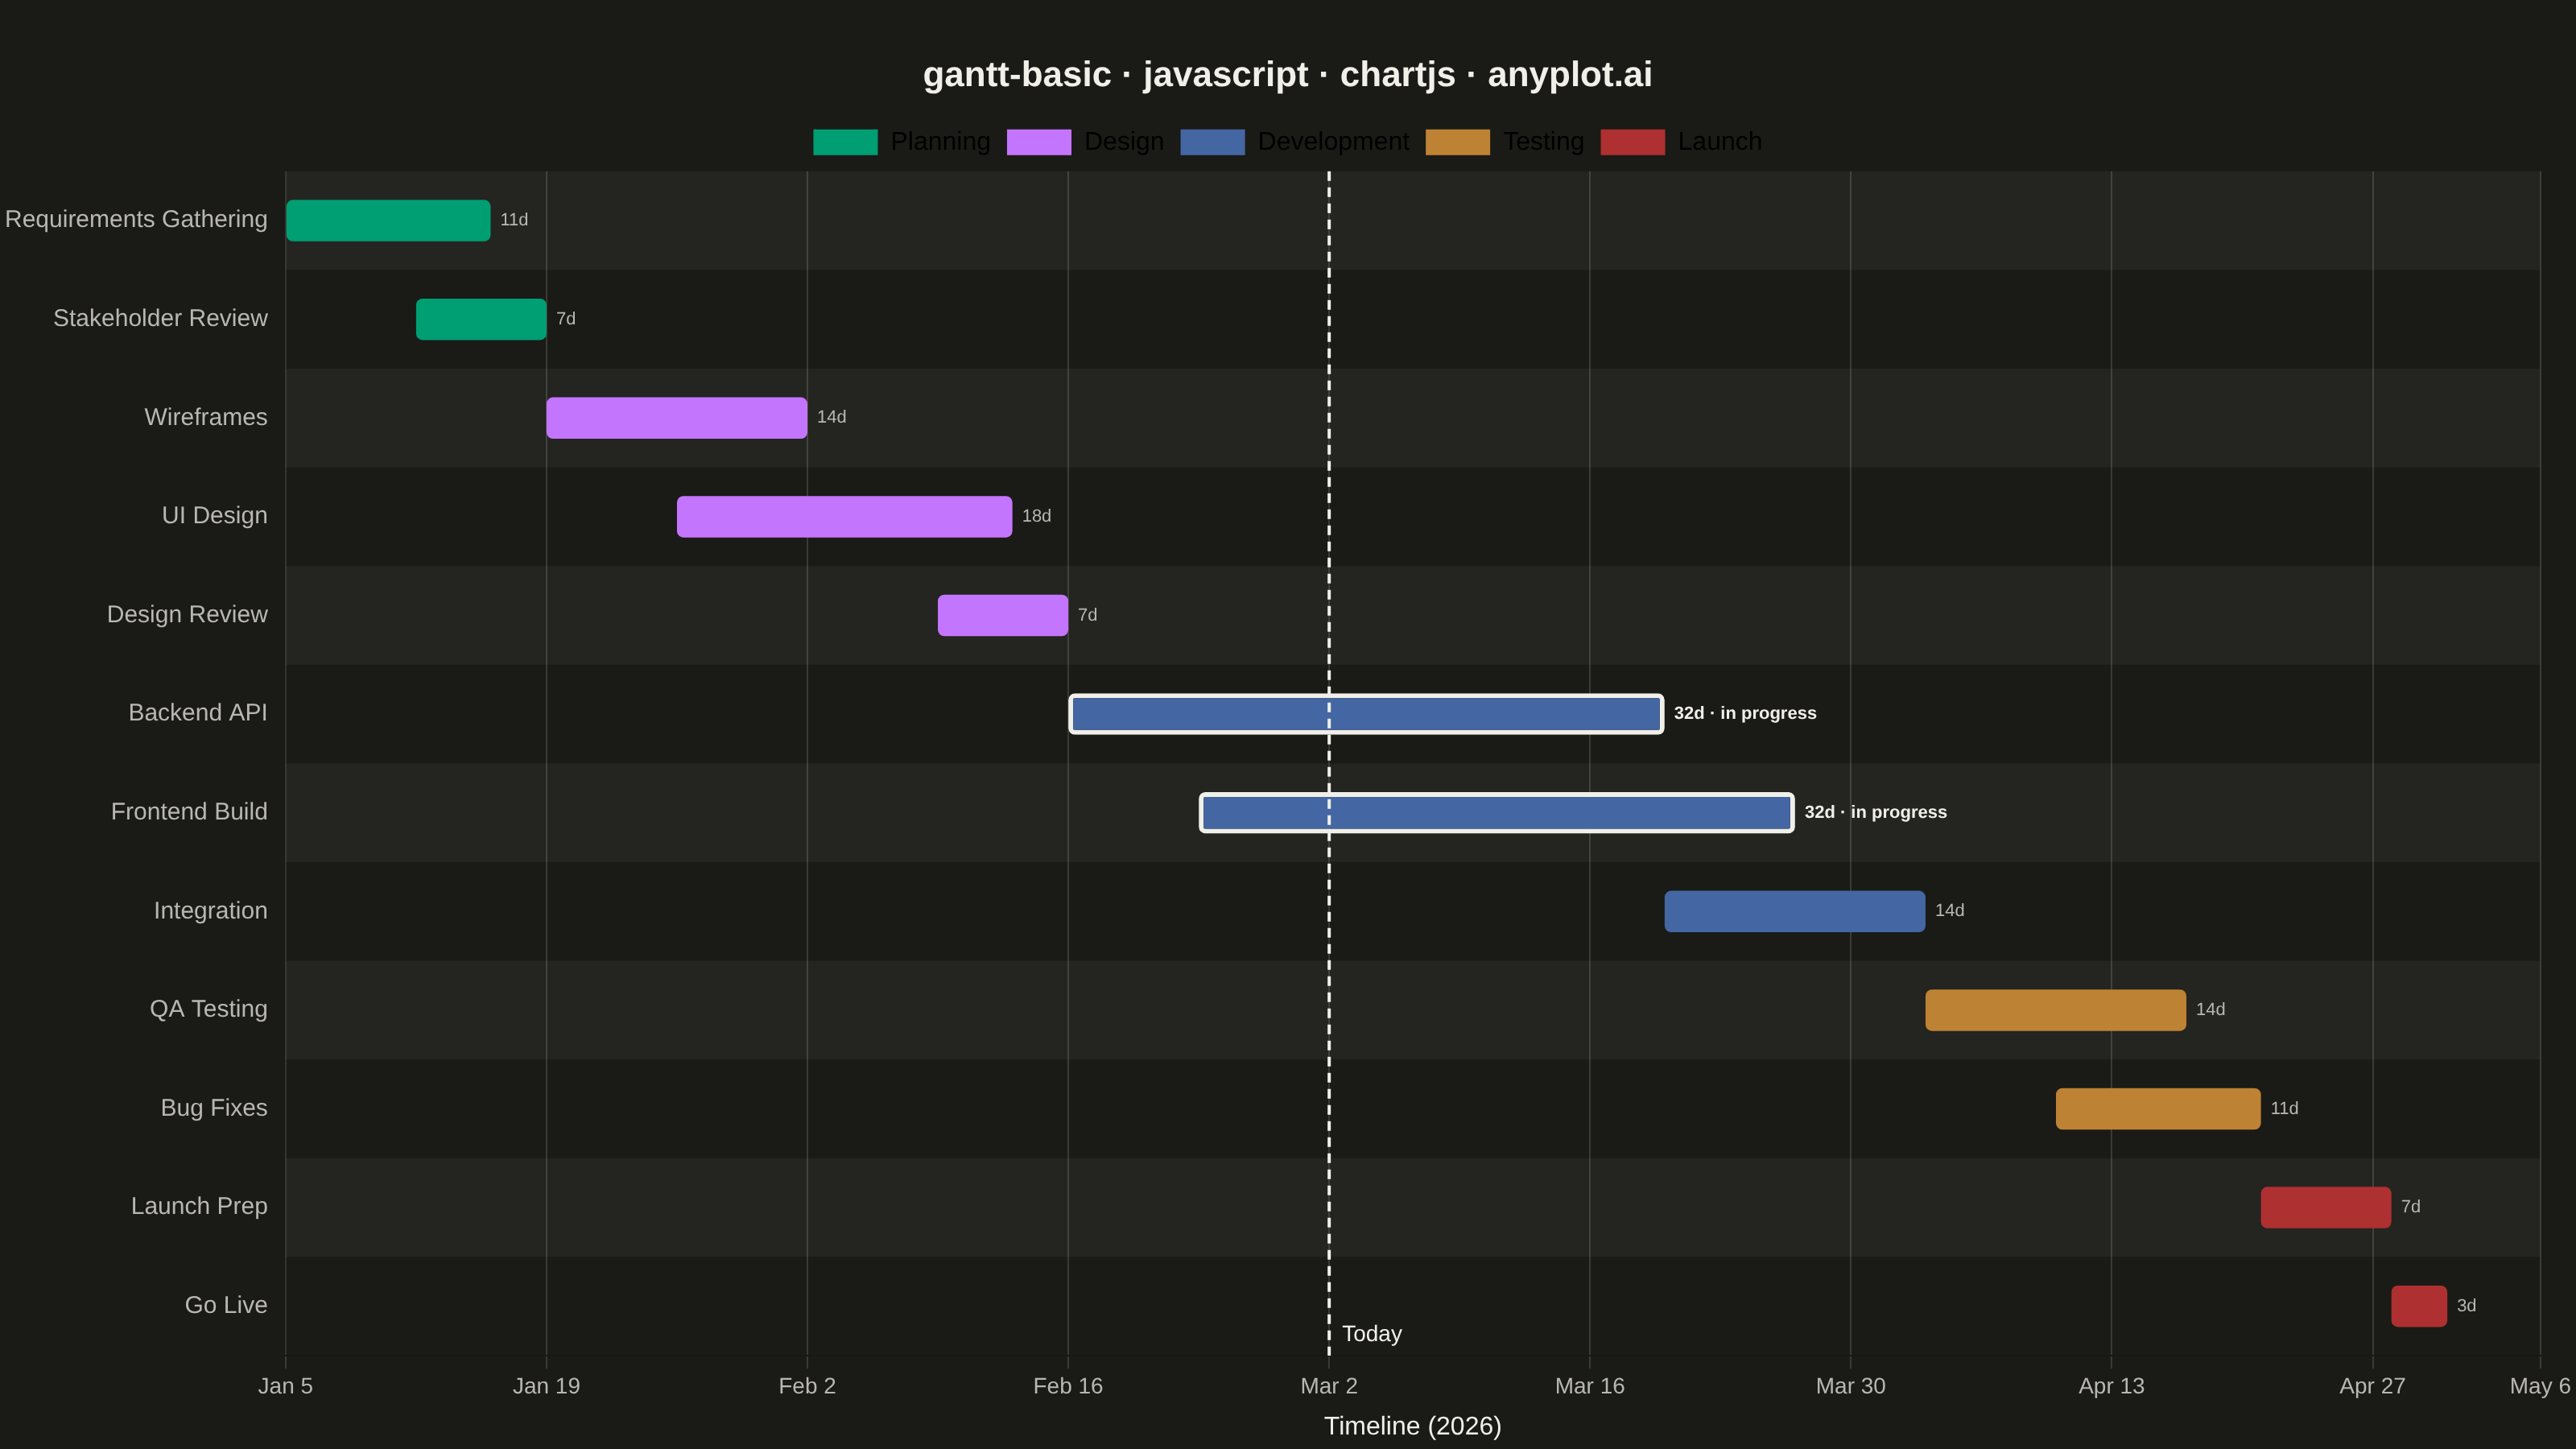
A Gantt chart is a horizontal bar chart that visualizes project schedules and timelines. Each task is represented as a horizontal bar spanning from its start date to end date, making it easy to see task durations, overlaps, and the overall project timeline at a glance. Gantt charts are essential for project management, helping teams understand task sequences and identify scheduling conflicts.
// anyplot.ai
// gantt-basic: Basic Gantt Chart
// Library: chartjs 4.4.7 | JavaScript 22.23.2
// Quality: 92/100 | Created: 2026-09-05

const t = window.ANYPLOT_TOKENS;

// --- Data (in-memory, deterministic) ----------------------------------------
// A software-release schedule. Chart.js ships no date-scale adapter in this
// runtime, so dates are converted to day offsets from PROJECT_START and the
// linear x-axis ticks are formatted back into calendar dates.
const PROJECT_START = new Date(Date.UTC(2026, 0, 5)); // 2026-01-05
const REFERENCE_DATE = new Date(Date.UTC(2026, 2, 2)); // "current date" marker

const dayOffset = (date) => Math.round((date - PROJECT_START) / 86400000);

const CATEGORIES = ["Planning", "Design", "Development", "Testing", "Launch"];

const tasks = [
  { task: "Requirements Gathering", start: Date.UTC(2026, 0, 5), end: Date.UTC(2026, 0, 16), category: "Planning" },
  { task: "Stakeholder Review", start: Date.UTC(2026, 0, 12), end: Date.UTC(2026, 0, 19), category: "Planning" },
  { task: "Wireframes", start: Date.UTC(2026, 0, 19), end: Date.UTC(2026, 1, 2), category: "Design" },
  { task: "UI Design", start: Date.UTC(2026, 0, 26), end: Date.UTC(2026, 1, 13), category: "Design" },
  { task: "Design Review", start: Date.UTC(2026, 1, 9), end: Date.UTC(2026, 1, 16), category: "Design" },
  { task: "Backend API", start: Date.UTC(2026, 1, 16), end: Date.UTC(2026, 2, 20), category: "Development" },
  { task: "Frontend Build", start: Date.UTC(2026, 1, 23), end: Date.UTC(2026, 2, 27), category: "Development" },
  { task: "Integration", start: Date.UTC(2026, 2, 20), end: Date.UTC(2026, 3, 3), category: "Development" },
  { task: "QA Testing", start: Date.UTC(2026, 3, 3), end: Date.UTC(2026, 3, 17), category: "Testing" },
  { task: "Bug Fixes", start: Date.UTC(2026, 3, 10), end: Date.UTC(2026, 3, 21), category: "Testing" },
  { task: "Launch Prep", start: Date.UTC(2026, 3, 21), end: Date.UTC(2026, 3, 28), category: "Launch" },
  { task: "Go Live", start: Date.UTC(2026, 3, 28), end: Date.UTC(2026, 4, 1), category: "Launch" },
].map((row) => ({ ...row, start: dayOffset(new Date(row.start)), end: dayOffset(new Date(row.end)) }));

const totalDays = Math.max(...tasks.map((row) => row.end)) + 5;
const todayOffset = dayOffset(REFERENCE_DATE);
const isActive = (row) => row.start <= todayOffset && todayOffset <= row.end;

const MONTHS = ["Jan", "Feb", "Mar", "Apr", "May", "Jun", "Jul", "Aug", "Sep", "Oct", "Nov", "Dec"];
function formatDayOffset(offset) {
  const d = new Date(PROJECT_START.getTime() + Math.round(offset) * 86400000);
  return `${MONTHS[d.getUTCMonth()]} ${d.getUTCDate()}`;
}

// --- Mount -------------------------------------------------------------------
const canvas = document.createElement("canvas");
document.getElementById("container").appendChild(canvas);

// --- Chart -------------------------------------------------------------------
// Subtle alternating row bands (drawn behind the grid/bars) to make it easier
// to trace a task row across the full timeline width.
const rowBandPlugin = {
  id: "rowBands",
  beforeDraw(chart) {
    const { ctx, chartArea, scales } = chart;
    const rowHeight = chartArea.height / tasks.length;
    ctx.save();
    ctx.fillStyle = t.elevatedBg;
    tasks.forEach((_, i) => {
      if (i % 2 !== 0) return;
      const center = scales.y.getPixelForValue(i);
      ctx.fillRect(chartArea.left, center - rowHeight / 2, chartArea.width, rowHeight);
    });
    ctx.restore();
  },
};

// Compact "Nd" duration labels next to each bar, with in-progress tasks
// (those straddling REFERENCE_DATE) called out as the chart's focal point.
const durationLabelPlugin = {
  id: "durationLabels",
  afterDatasetsDraw(chart) {
    const { ctx, chartArea } = chart;
    const meta = chart.getDatasetMeta(0);
    ctx.save();
    ctx.textBaseline = "middle";
    meta.data.forEach((bar, i) => {
      const row = tasks[i];
      const active = isActive(row);
      const label = `${row.end - row.start}d${active ? " · in progress" : ""}`;
      ctx.font = `${active ? "bold " : ""}11px -apple-system, BlinkMacSystemFont, sans-serif`;
      ctx.fillStyle = active ? t.ink : t.inkSoft;
      const labelWidth = ctx.measureText(label).width;
      if (bar.x + 6 + labelWidth <= chartArea.right) {
        ctx.textAlign = "left";
        ctx.fillText(label, bar.x + 6, bar.y);
      } else {
        ctx.textAlign = "right";
        ctx.fillText(label, bar.base - 6, bar.y);
      }
    });
    ctx.restore();
  },
};

// A dashed reference line marks REFERENCE_DATE using the theme's ink color
// (the "neutral" semantic anchor — reference lines share the text/grid hue).
const referenceLinePlugin = {
  id: "referenceLine",
  afterDraw(chart) {
    const { x: xScale, y: yScale } = chart.scales;
    const refX = xScale.getPixelForValue(dayOffset(REFERENCE_DATE));
    if (refX < xScale.left || refX > xScale.right) return;
    const { ctx } = chart;
    ctx.save();
    ctx.strokeStyle = t.ink;
    ctx.setLineDash([6, 4]);
    ctx.lineWidth = 2;
    ctx.beginPath();
    ctx.moveTo(refX, yScale.top);
    ctx.lineTo(refX, yScale.bottom);
    ctx.stroke();
    ctx.setLineDash([]);
    ctx.fillStyle = t.ink;
    ctx.font = "14px -apple-system, BlinkMacSystemFont, sans-serif";
    ctx.textAlign = "left";
    ctx.textBaseline = "bottom";
    ctx.fillText("Today", refX + 8, yScale.bottom - 6);
    ctx.restore();
  },
};

new Chart(canvas, {
  type: "bar",
  data: {
    labels: tasks.map((row) => row.task),
    datasets: [
      {
        label: "Tasks",
        data: tasks.map((row) => [row.start, row.end]),
        backgroundColor: tasks.map((row) => t.palette[CATEGORIES.indexOf(row.category) % t.palette.length]),
        borderColor: tasks.map(() => t.ink),
        borderWidth: tasks.map((row) => (isActive(row) ? 3 : 0)),
        borderRadius: 4,
        borderSkipped: false,
        barPercentage: 0.6,
        categoryPercentage: 0.7,
      },
    ],
  },
  options: {
    indexAxis: "y",
    responsive: true,
    maintainAspectRatio: false,
    animation: false,
    layout: { padding: { top: 24 } },
    plugins: {
      title: {
        display: true,
        text: "gantt-basic · javascript · chartjs · anyplot.ai",
        color: t.ink,
        font: { size: 22 },
      },
      legend: {
        labels: {
          color: t.ink,
          font: { size: 16 },
          generateLabels: () =>
            CATEGORIES.map((category, i) => ({
              text: category,
              fillStyle: t.palette[i % t.palette.length],
              strokeStyle: t.palette[i % t.palette.length],
              lineWidth: 0,
            })),
        },
        onClick: () => {},
      },
      tooltip: { enabled: false },
    },
    scales: {
      x: {
        type: "linear",
        min: 0,
        max: totalDays,
        ticks: {
          stepSize: 14,
          color: t.inkSoft,
          font: { size: 14 },
          callback: formatDayOffset,
        },
        grid: { color: t.grid },
        title: { display: true, text: "Timeline (2026)", color: t.ink, font: { size: 16 } },
      },
      y: {
        ticks: { color: t.inkSoft, font: { size: 15 } },
        grid: { display: false },
      },
    },
  },
  plugins: [rowBandPlugin, durationLabelPlugin, referenceLinePlugin],
});
Runnable source as JSON, for any HTTP client: https://api.anyplot.ai/specs/gantt-basic/chartjs/code. Any spec id and library id listed in llms-full.txt fit the same URL shape; every URL below is complete and callable.
{
  "spec_id": "gantt-basic",
  "language": "javascript",
  "library": "chartjs",
  "page": "https://anyplot.ai/gantt-basic/javascript/chartjs",
  "hub": "https://anyplot.ai/gantt-basic",
  "code_json": "https://api.anyplot.ai/specs/gantt-basic/chartjs/code",
  "spec_json": "https://api.anyplot.ai/specs/gantt-basic",
  "render_light_png": "https://storage.googleapis.com/anyplot-images/plots/gantt-basic/javascript/chartjs/plot-light.png",
  "render_dark_png": "https://storage.googleapis.com/anyplot-images/plots/gantt-basic/javascript/chartjs/plot-dark.png",
  "quality_score": 92.0,
  "license": "MIT",
  "guide": "https://anyplot.ai/llms.txt"
}
Part of Basic Gantt Chart on anyplot.ai.