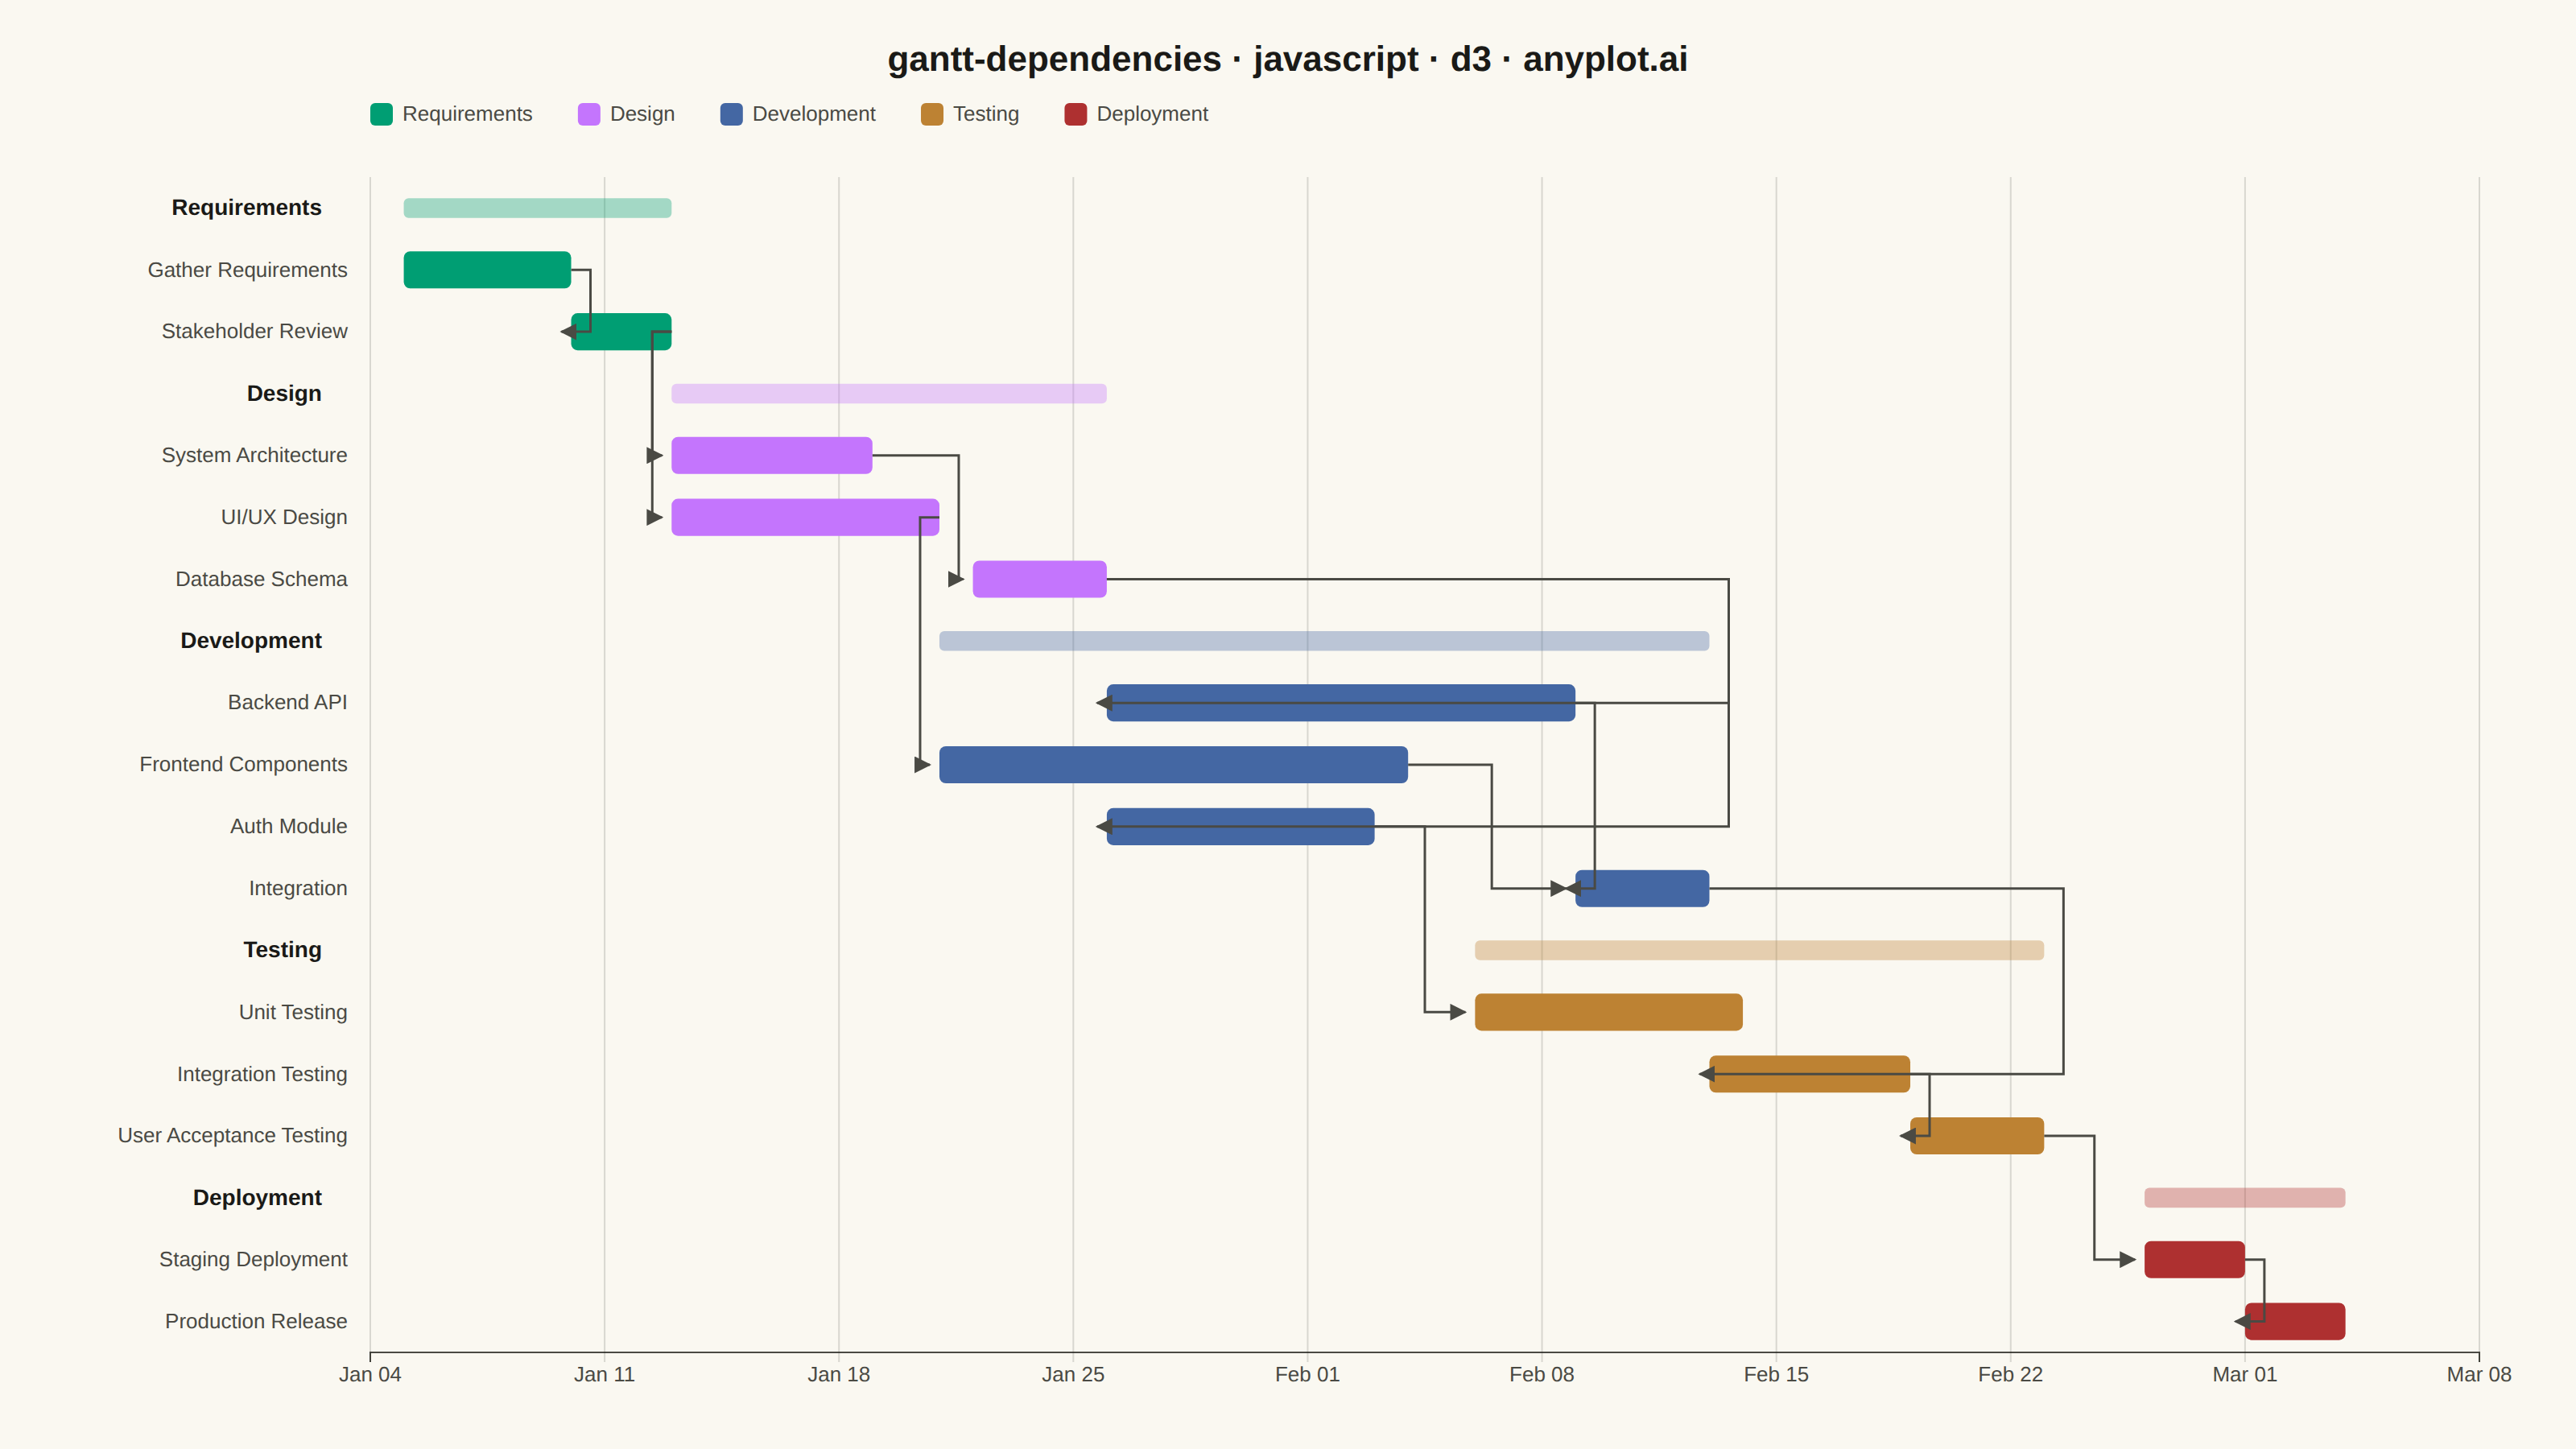
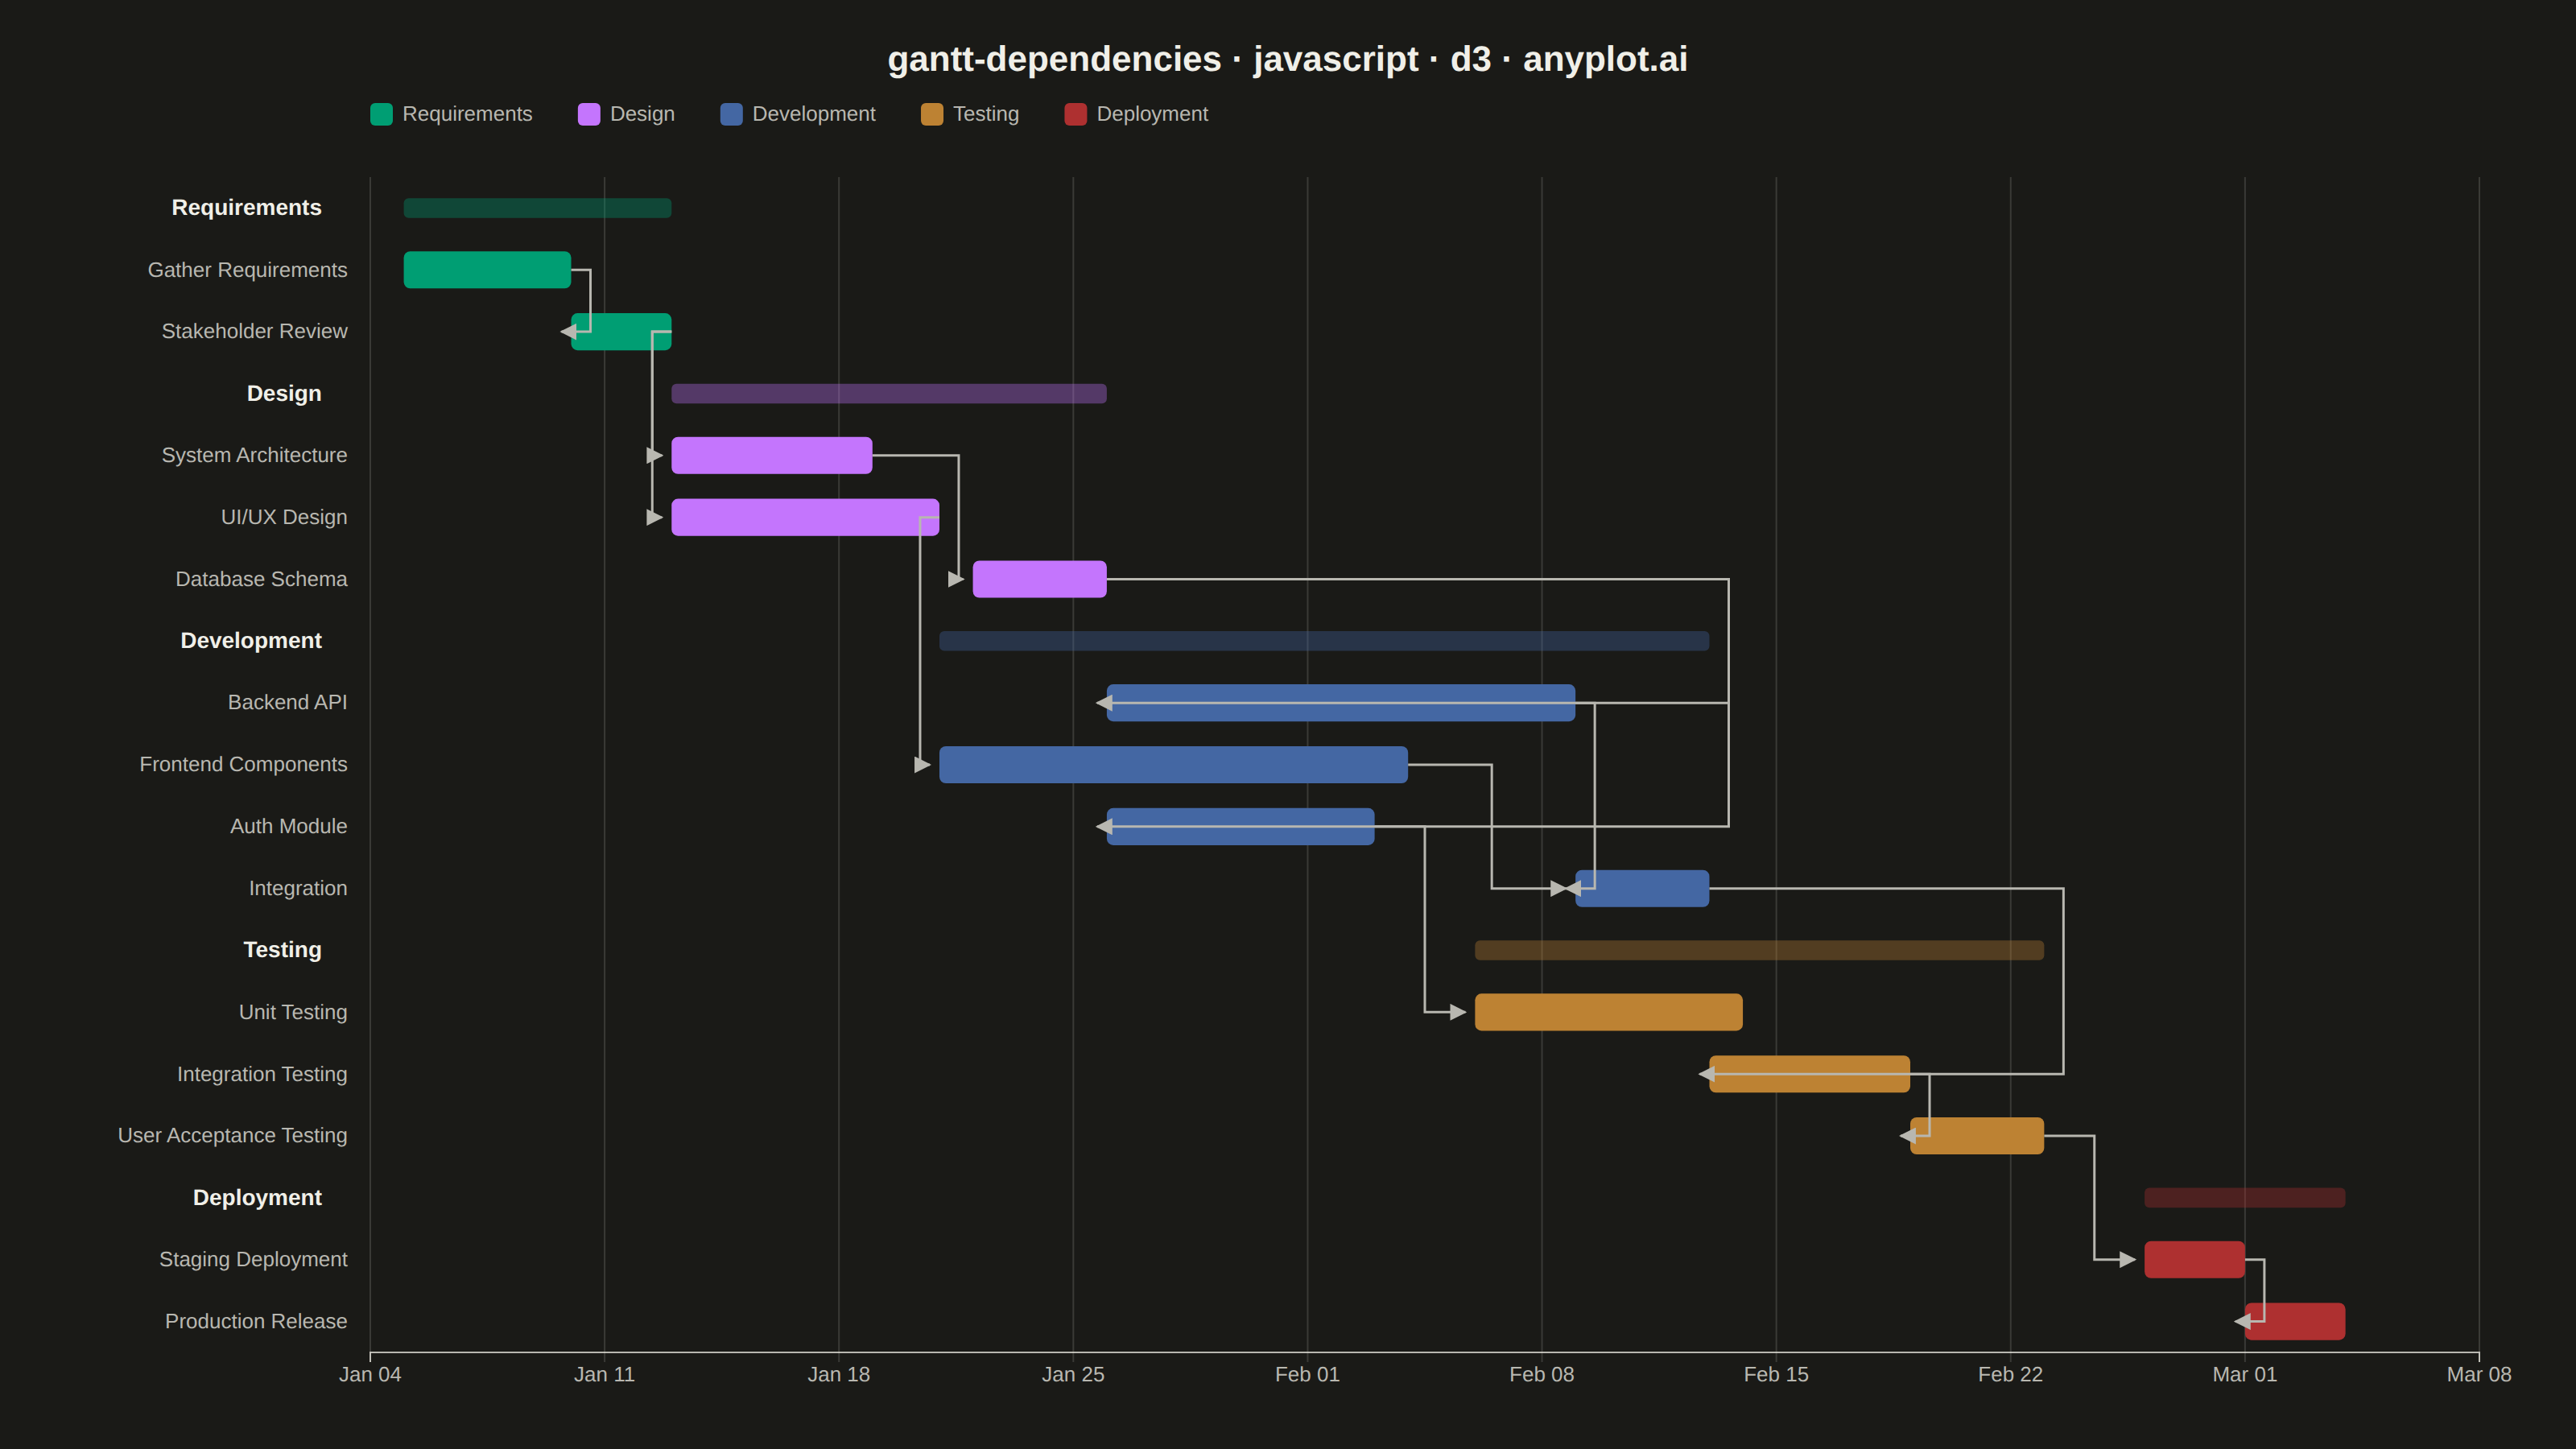
A Gantt chart that visualizes project schedules with task dependencies and groupings. Beyond displaying task timelines, this chart shows relationships between tasks using connector arrows, indicating which tasks must complete before others can begin. Tasks can be organized into groups (phases or work packages) with aggregate timeline bars showing the span of each group. This visualization is essential for understanding critical paths and scheduling constraints in complex projects.
Preview render from the D3.js implementation.