The same plot in 14 other libraries — Python: Altair, Bokeh, lets-plot, Matplotlib, Plotly, plotnine, Pygal, Seaborn; R: ggplot2; JavaScript: Chart.js, D3.js, Apache ECharts, Highcharts, MUI X Charts. Compare all 15 side by side: Gantt Chart with Dependencies in Python, R, Julia and JavaScript.
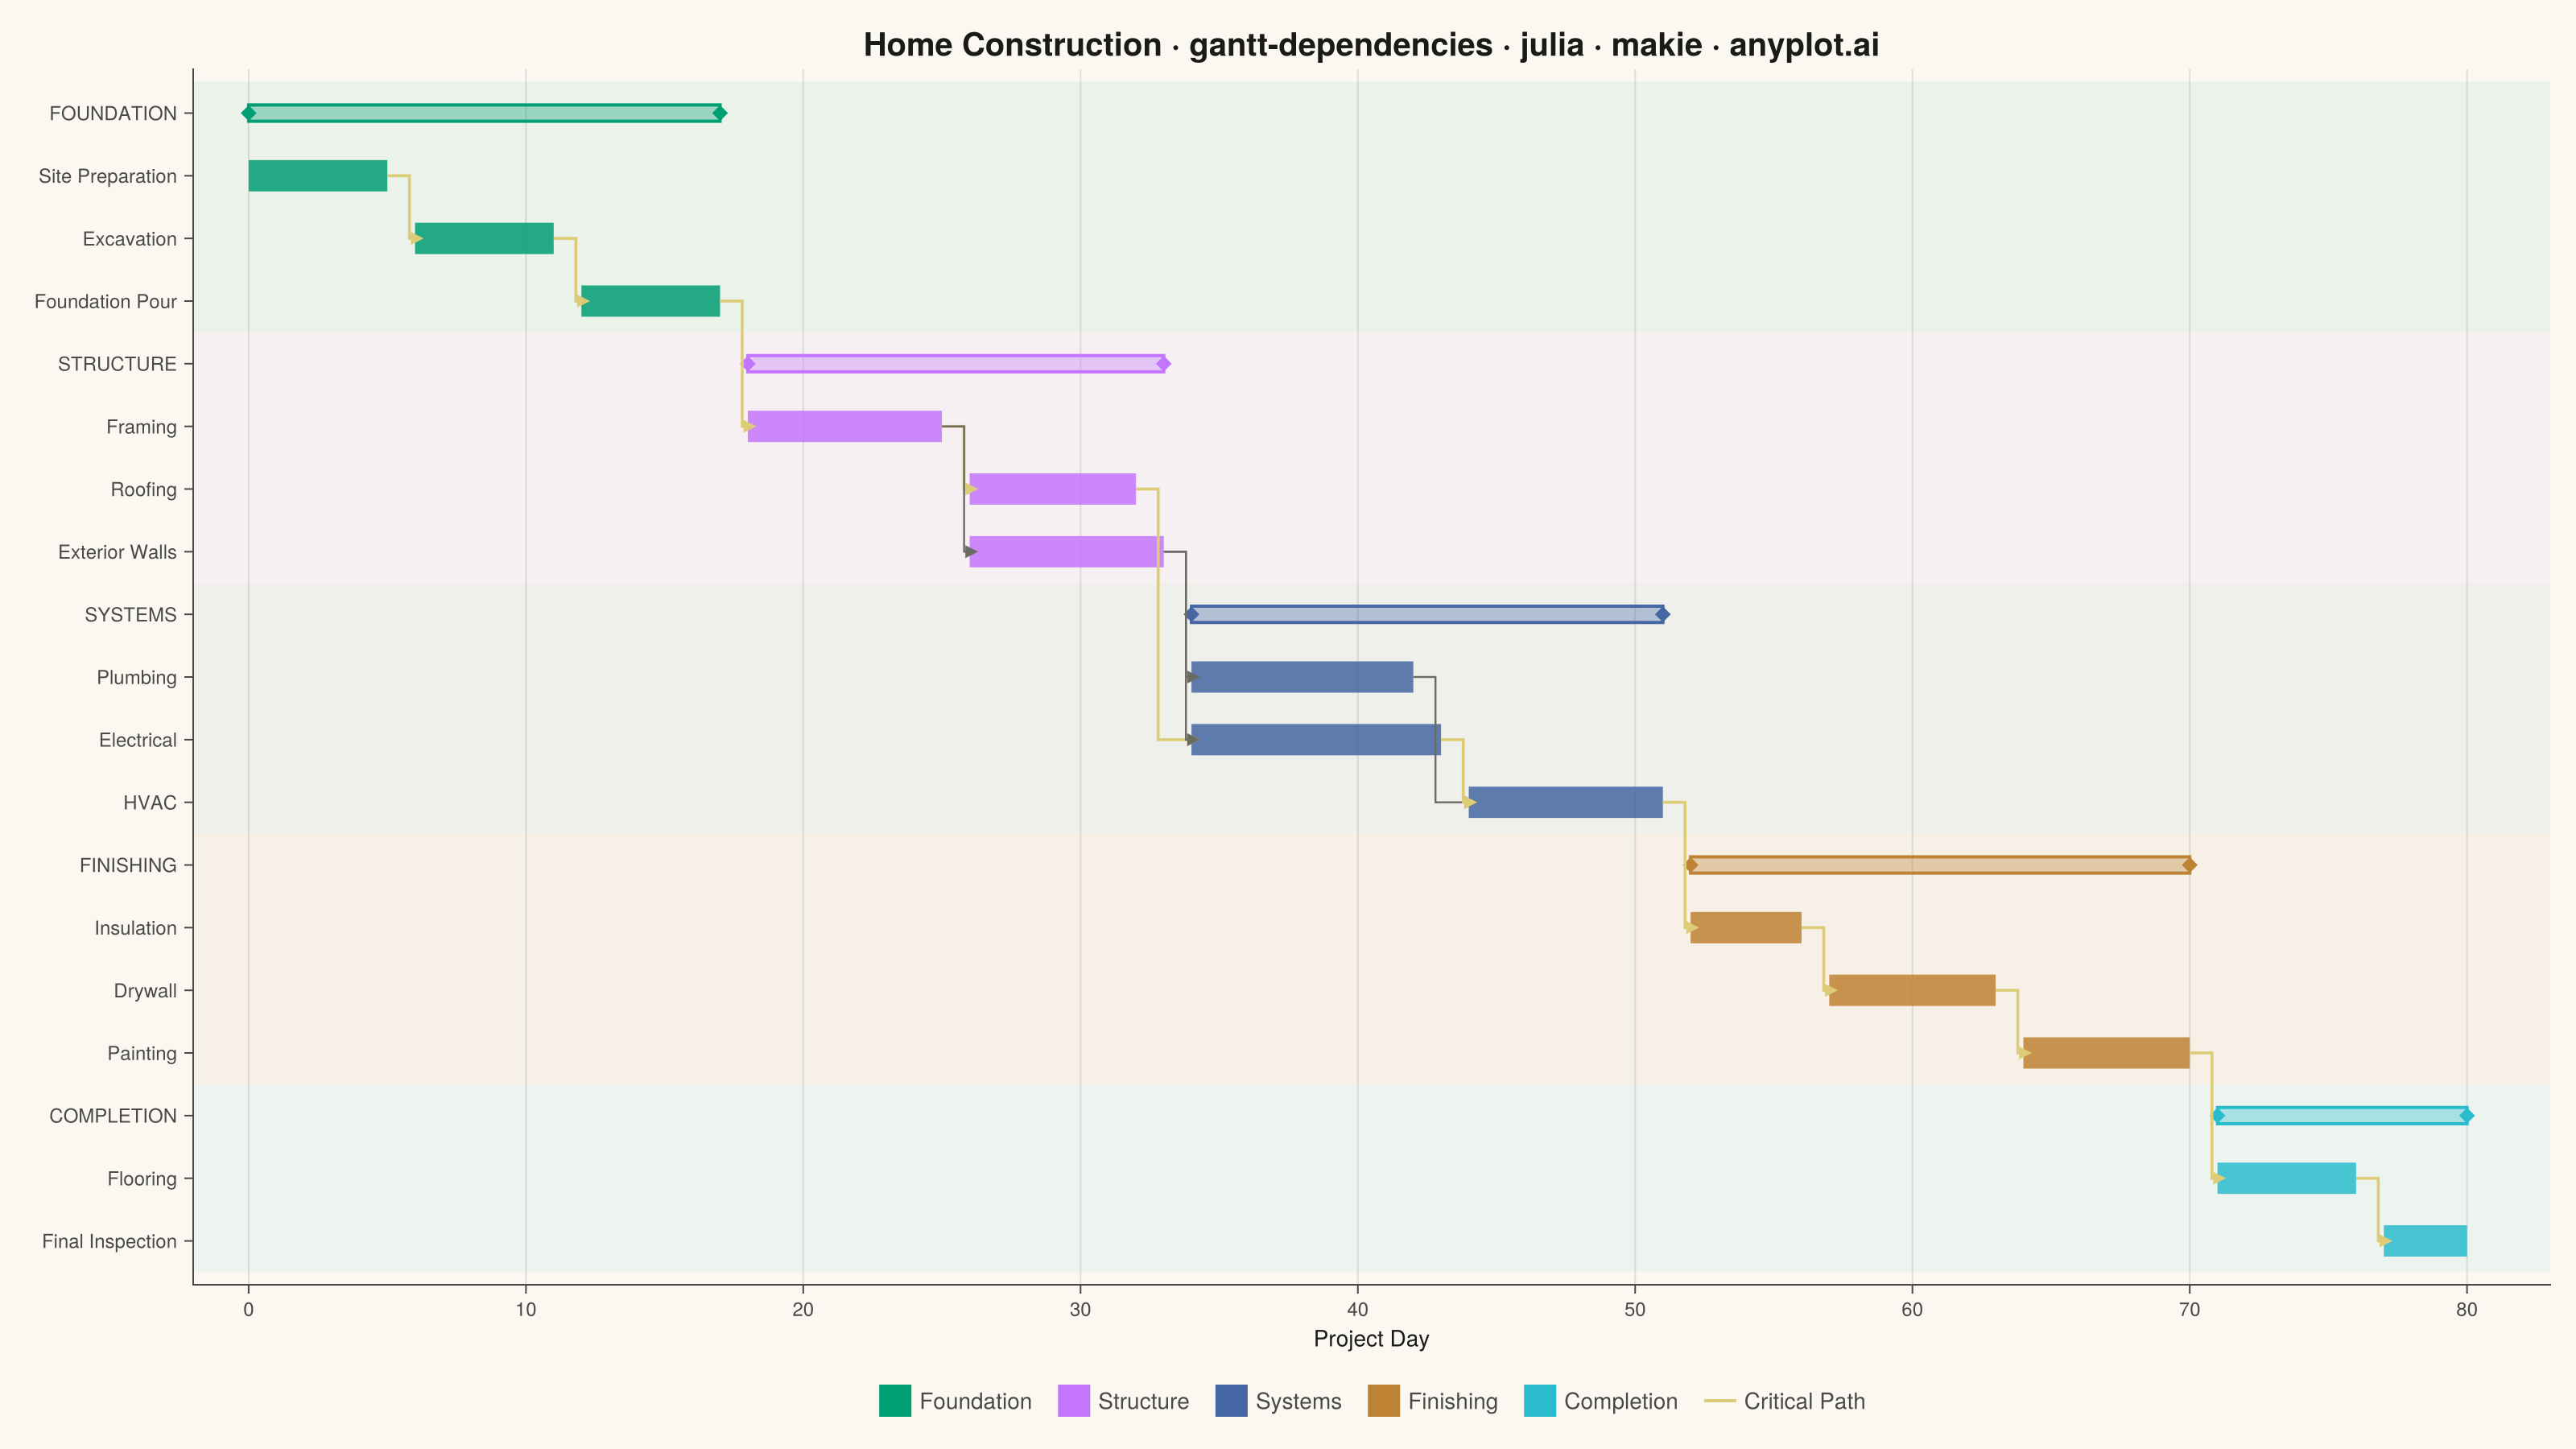
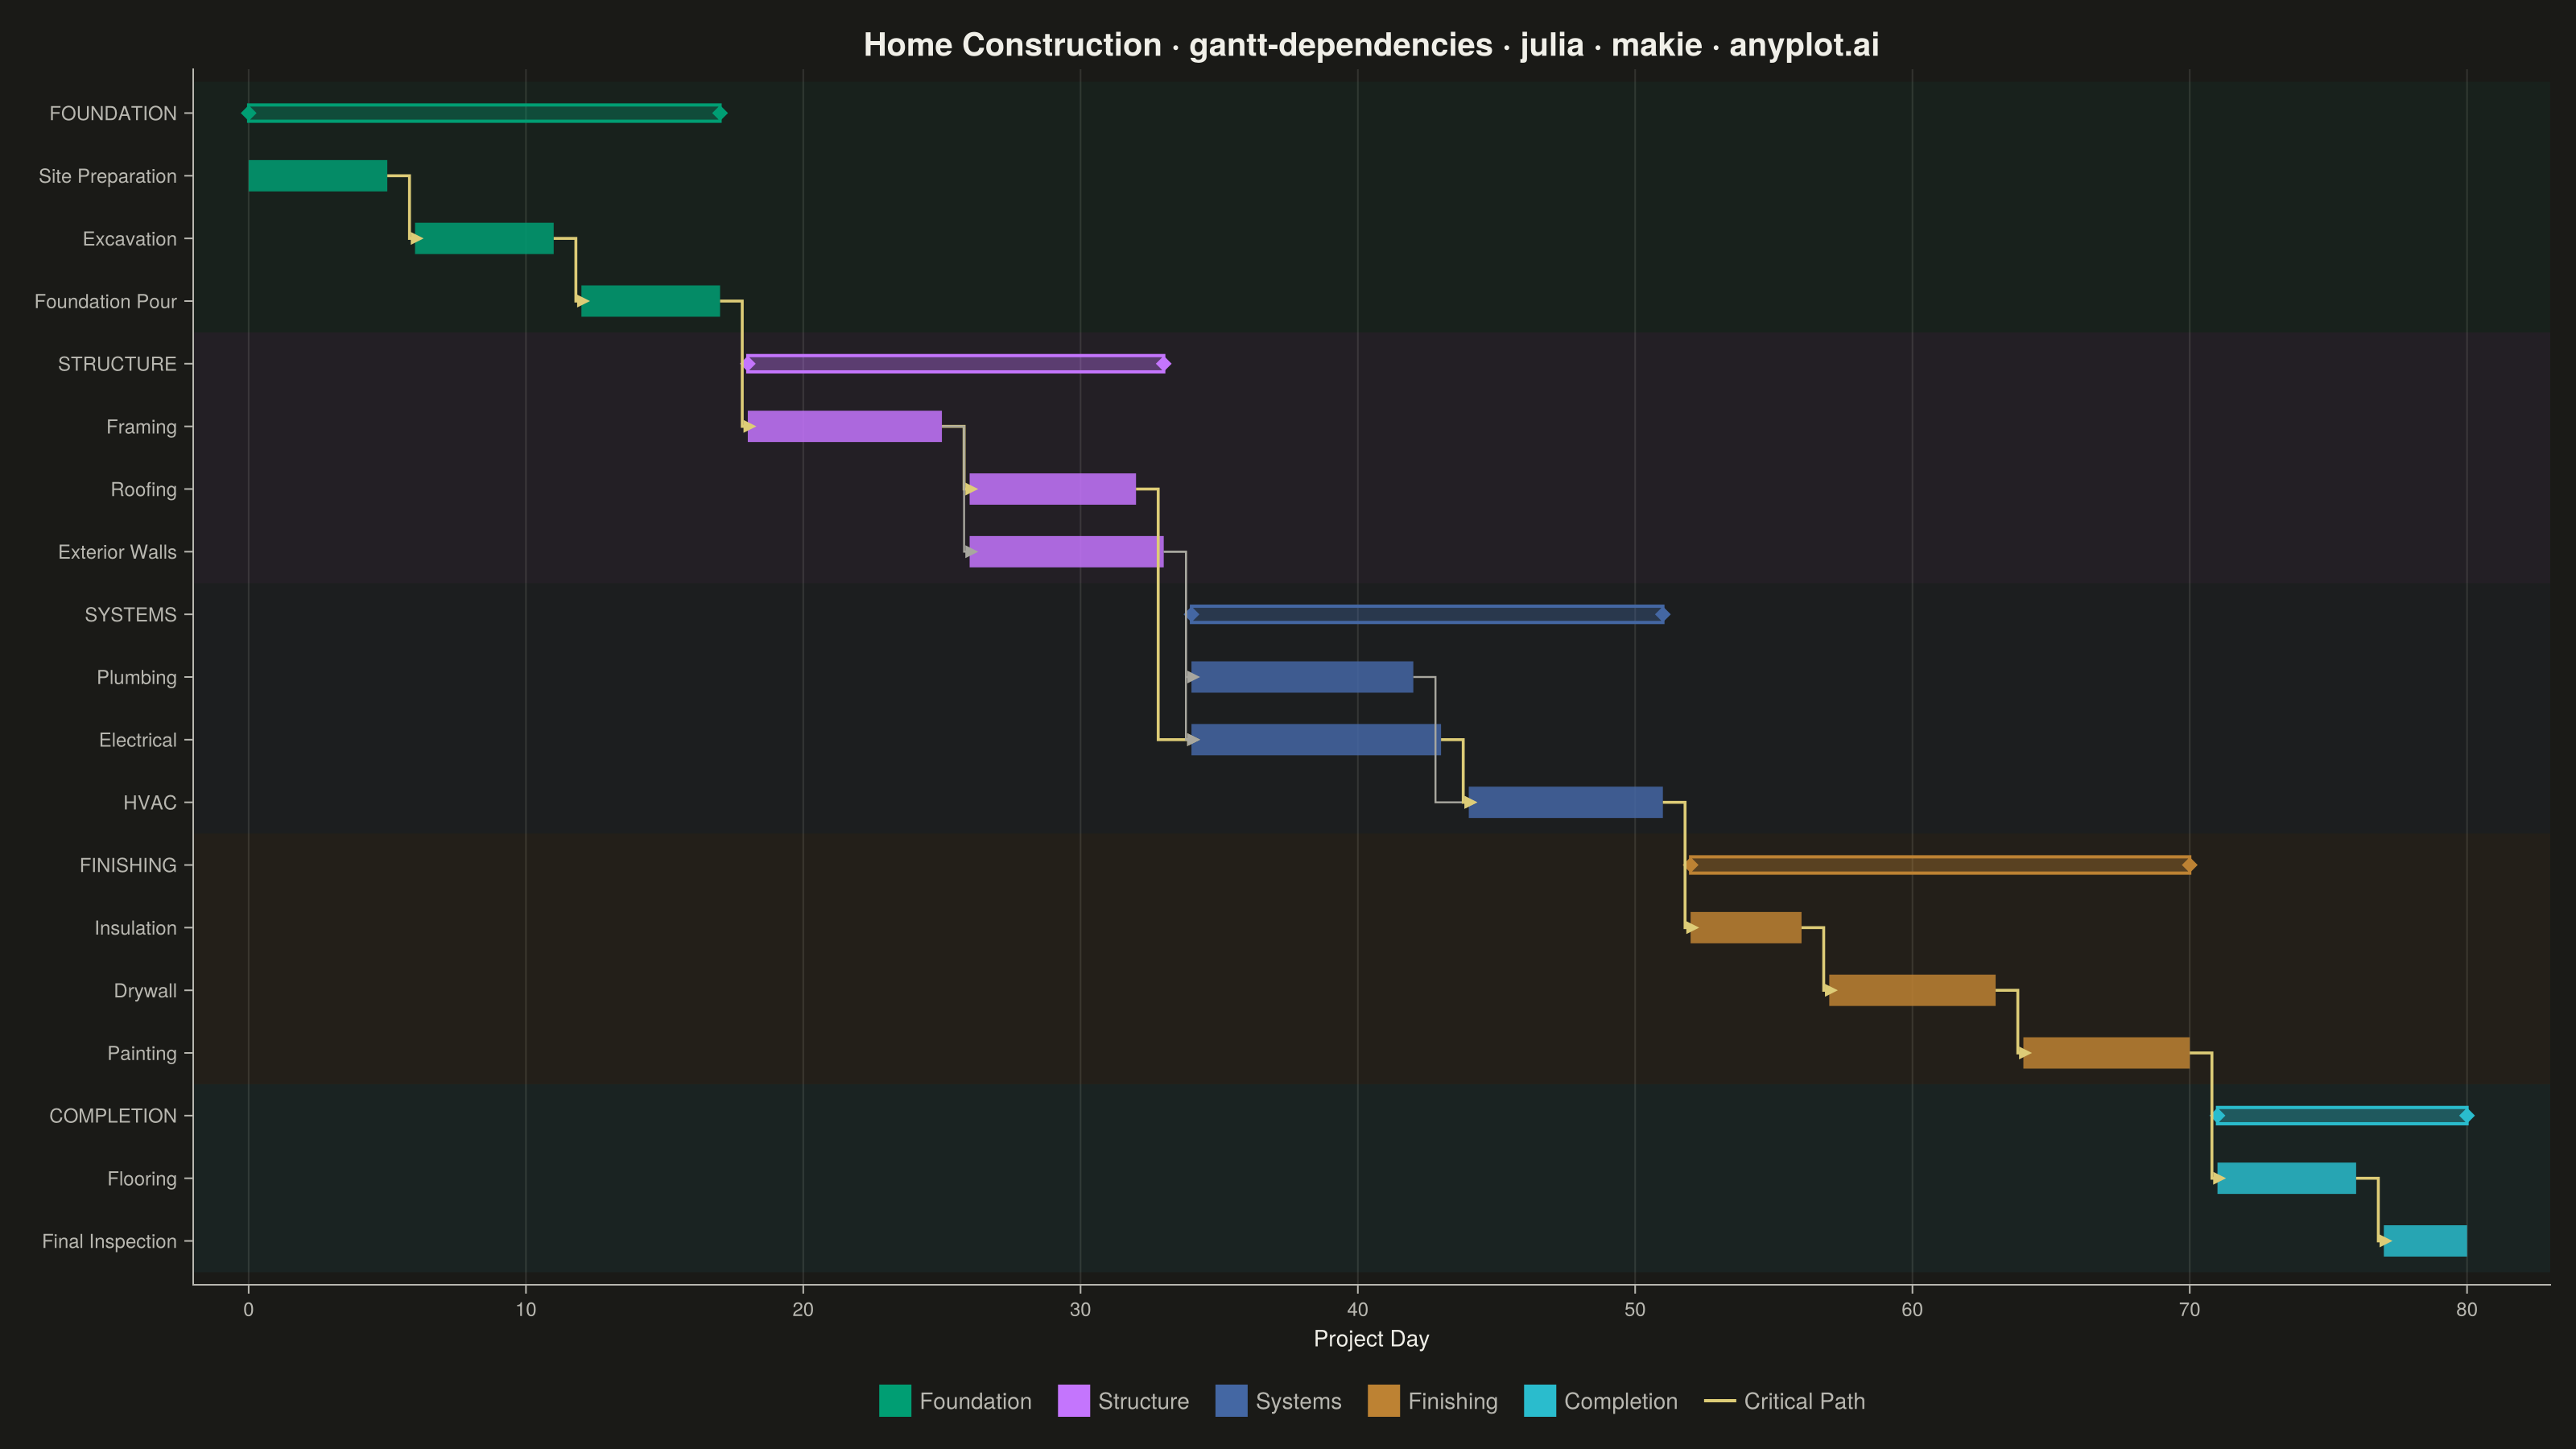
A Gantt chart that visualizes project schedules with task dependencies and groupings. Beyond displaying task timelines, this chart shows relationships between tasks using connector arrows, indicating which tasks must complete before others can begin. Tasks can be organized into groups (phases or work packages) with aggregate timeline bars showing the span of each group. This visualization is essential for understanding critical paths and scheduling constraints in complex projects.
# anyplot.ai
# gantt-dependencies: Gantt Chart with Dependencies
# Library: makie 0.22.10 | Julia 1.11.9
# Quality: 91/100 | Created: 2026-06-02

using CairoMakie
using Colors
using Random

Random.seed!(42)

# Theme tokens
const THEME       = get(ENV, "ANYPLOT_THEME", "light")
const PAGE_BG     = THEME == "light" ? colorant"#FAF8F1" : colorant"#1A1A17"
const ELEVATED_BG = THEME == "light" ? colorant"#FFFDF6" : colorant"#242420"
const INK         = THEME == "light" ? colorant"#1A1A17" : colorant"#F0EFE8"
const INK_SOFT    = THEME == "light" ? colorant"#4A4A44" : colorant"#B8B7B0"
const INK_MUTED   = THEME == "light" ? colorant"#6B6A63" : colorant"#A8A79F"
const AMBER       = colorant"#DDCC77"  # critical-path highlight

# Imprint palette — positions 1,2,3,4,6 for 5 neutral phases
# (slot 5 matte red is a semantic anchor for bad/loss/error; skipped here)
const PHASE_COLORS = [
    colorant"#009E73",
    colorant"#C475FD",
    colorant"#4467A3",
    colorant"#BD8233",
    colorant"#2ABCCD",
]
const PHASE_NAMES = ["Foundation", "Structure", "Systems", "Finishing", "Completion"]

# Home construction project: 80-day schedule with 5 phases and 14 tasks
# Y rows: group header rows use UPPERCASE, task rows use two-space indent
const TASK_LABELS = [
    "FOUNDATION",
    "  Site Preparation",
    "  Excavation",
    "  Foundation Pour",
    "STRUCTURE",
    "  Framing",
    "  Roofing",
    "  Exterior Walls",
    "SYSTEMS",
    "  Plumbing",
    "  Electrical",
    "  HVAC",
    "FINISHING",
    "  Insulation",
    "  Drywall",
    "  Painting",
    "COMPLETION",
    "  Flooring",
    "  Final Inspection",
]

const TASK_STARTS = [0,  0,  6, 12, 18, 18, 26, 26, 34, 34, 34, 44, 52, 52, 57, 64, 71, 71, 77]
const TASK_ENDS   = [17, 5, 11, 17, 33, 25, 32, 33, 51, 42, 43, 51, 70, 56, 63, 70, 80, 76, 80]
const IS_GROUP    = [true, false, false, false, true, false, false, false,
                     true, false, false, false, true, false, false, false,
                     true, false, false]
const PHASE_IDX   = [1, 1, 1, 1, 2, 2, 2, 2, 3, 3, 3, 3, 4, 4, 4, 4, 5, 5, 5]

# Dependencies: (predecessor_row, successor_row) — finish-to-start
const DEPS = [
    (2, 3),   # Site Preparation → Excavation
    (3, 4),   # Excavation → Foundation Pour
    (4, 6),   # Foundation Pour → Framing
    (6, 7),   # Framing → Roofing
    (6, 8),   # Framing → Exterior Walls
    (7, 11),  # Roofing → Electrical
    (8, 10),  # Exterior Walls → Plumbing
    (8, 11),  # Exterior Walls → Electrical
    (10, 12), # Plumbing → HVAC
    (11, 12), # Electrical → HVAC
    (12, 14), # HVAC → Insulation
    (14, 15), # Insulation → Drywall
    (15, 16), # Drywall → Painting
    (16, 18), # Painting → Flooring
    (18, 19), # Flooring → Final Inspection
]

# Critical path: longest dependency chain (any delay delays project finish)
const CRITICAL_DEPS = Set([(2, 3), (3, 4), (4, 6), (6, 7), (7, 11),
                            (11, 12), (12, 14), (14, 15), (15, 16), (16, 18), (18, 19)])

n_rows = length(TASK_LABELS)

# Figure — landscape 3200×1800 px (size 1600×900 × px_per_unit 2)
fig = Figure(
    size            = (1600, 900),
    fontsize        = 14,
    backgroundcolor = PAGE_BG,
)

ax = Axis(
    fig[1, 1];
    backgroundcolor    = PAGE_BG,
    title              = "Home Construction · gantt-dependencies · julia · makie · anyplot.ai",
    titlesize          = 20,
    titlecolor         = INK,
    xlabel             = "Project Day",
    xlabelsize         = 14,
    xlabelcolor        = INK,
    xticklabelcolor    = INK_SOFT,
    yticklabelcolor    = INK_SOFT,
    xticklabelsize     = 12,
    yticklabelsize     = 12,
    xtickcolor         = INK_SOFT,
    ytickcolor         = INK_SOFT,
    leftspinecolor     = INK_SOFT,
    bottomspinecolor   = INK_SOFT,
    topspinevisible    = false,
    rightspinevisible  = false,
    xgridcolor         = RGBAf(INK.r, INK.g, INK.b, 0.12),
    ygridvisible       = false,
    xminorgridvisible  = false,
    yminorgridvisible  = false,
    yticks             = (collect(1:n_rows), TASK_LABELS),
    xticks             = 0:10:80,
)

xlims!(ax, -2.0, 83.0)
ylims!(ax, Float64(n_rows) + 0.7, 0.3)  # inverted: row 1 at top, row 19 at bottom

# Phase background bands — very light tint to group rows by phase
for g in 1:5
    rows_g = filter(i -> PHASE_IDX[i] == g, 1:n_rows)
    y_lo = Float64(minimum(rows_g)) - 0.5
    y_hi = Float64(maximum(rows_g)) + 0.5
    col  = PHASE_COLORS[g]
    poly!(ax, Rect2f(-2.0, y_lo, 85.0, y_hi - y_lo);
          color = RGBAf(col.r, col.g, col.b, 0.06f0), strokewidth = 0)
end

# Task and group header bars
bar_h   = 0.50
group_h = 0.26

for i in 1:n_rows
    y   = Float64(i)
    x0  = Float64(TASK_STARTS[i])
    w   = Float64(TASK_ENDS[i] - TASK_STARTS[i])
    col = PHASE_COLORS[PHASE_IDX[i]]
    if IS_GROUP[i]
        # Group aggregate bar: thicker stroke + diamond end-caps (classic Gantt summary bar)
        poly!(ax, Rect2f(x0, y - group_h / 2, w, group_h);
              color       = RGBAf(col.r, col.g, col.b, 0.35f0),
              strokecolor = col,
              strokewidth = 2.0)
        scatter!(ax, [x0, x0 + w], [y, y];
                 marker = :diamond, markersize = 11,
                 color = col, strokewidth = 0)
    else
        poly!(ax, Rect2f(x0, y - bar_h / 2, w, bar_h);
              color       = RGBAf(col.r, col.g, col.b, 0.85f0),
              strokewidth = 0)
    end
end

# Dependency connectors: L-shaped path from right edge of predecessor to left edge of successor
# Critical-path connectors drawn in amber; off-path connectors in INK_MUTED
for dep in DEPS
    r1, r2  = dep
    x1      = Float64(TASK_ENDS[r1])
    y1      = Float64(r1)
    x2      = Float64(TASK_STARTS[r2])
    y2      = Float64(r2)
    x_bend  = x1 + 0.8
    is_crit = dep in CRITICAL_DEPS
    line_col  = is_crit ? AMBER     : INK_MUTED
    line_w    = is_crit ? 1.8f0     : 1.2f0
    arrow_col = is_crit ? AMBER     : INK_MUTED
    lines!(ax, [x1, x_bend, x_bend, x2], [y1, y1, y2, y2];
           color = line_col, linewidth = line_w)
    scatter!(ax, [x2], [y2];
             marker = :rtriangle, markersize = 11,
             color = arrow_col, strokewidth = 0)
end

# Phase legend + critical path indicator
phase_elements  = [PolyElement(color = PHASE_COLORS[i], strokewidth = 0) for i in 1:5]
crit_element    = LineElement(color = AMBER, linewidth = 2.0)
all_elements    = vcat(phase_elements, [crit_element])
all_labels      = vcat(PHASE_NAMES,   ["Critical Path"])

Legend(
    fig[2, 1],
    all_elements,
    all_labels;
    orientation  = :horizontal,
    framevisible = false,
    labelcolor   = INK_SOFT,
    padding      = (10f0, 10f0, 4f0, 4f0),
)
rowsize!(fig.layout, 2, Fixed(28))

save("plot-$(THEME).png", fig; px_per_unit = 2)
Runnable source as JSON, for any HTTP client: https://api.anyplot.ai/specs/gantt-dependencies/makie/code. Any spec id and library id listed in llms-full.txt fit the same URL shape; every URL below is complete and callable.
{
  "spec_id": "gantt-dependencies",
  "language": "julia",
  "library": "makie",
  "page": "https://anyplot.ai/gantt-dependencies/julia/makie",
  "hub": "https://anyplot.ai/gantt-dependencies",
  "code_json": "https://api.anyplot.ai/specs/gantt-dependencies/makie/code",
  "spec_json": "https://api.anyplot.ai/specs/gantt-dependencies",
  "render_light_png": "https://storage.googleapis.com/anyplot-images/plots/gantt-dependencies/julia/makie/plot-light.png",
  "render_dark_png": "https://storage.googleapis.com/anyplot-images/plots/gantt-dependencies/julia/makie/plot-dark.png",
  "quality_score": 91.0,
  "license": "MIT",
  "guide": "https://anyplot.ai/llms.txt"
}
Part of Gantt Chart with Dependencies on anyplot.ai.