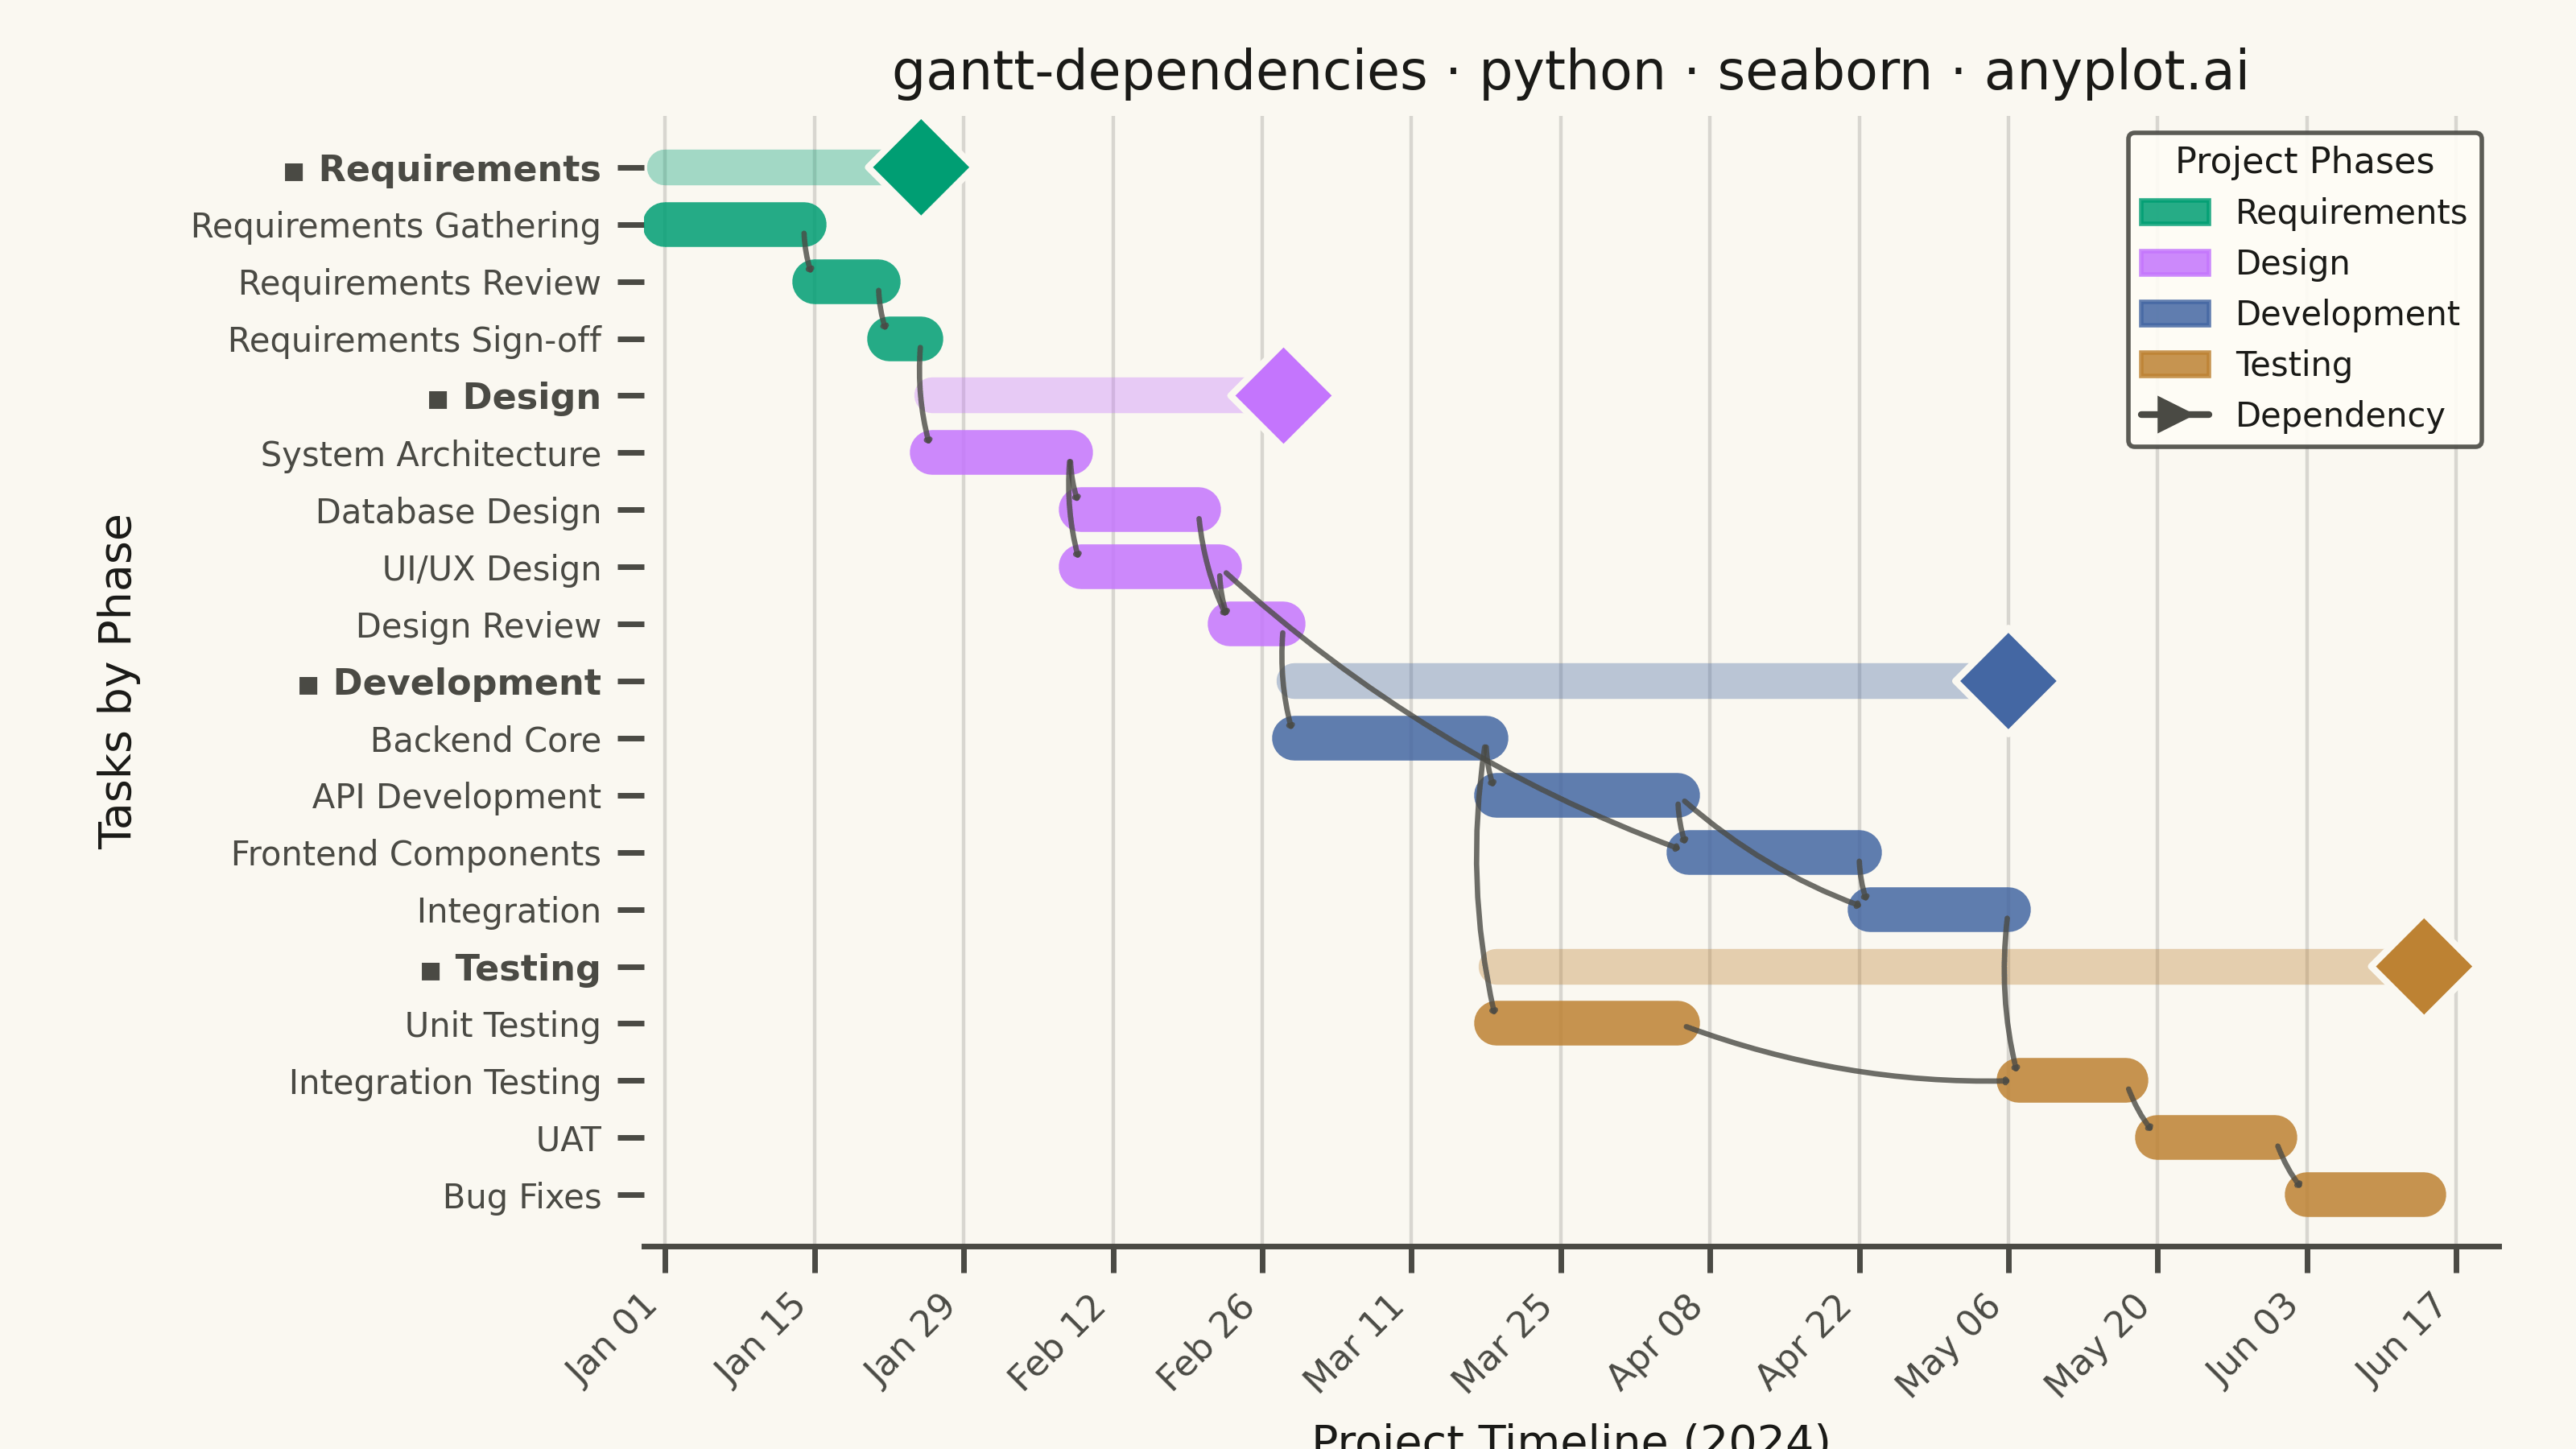
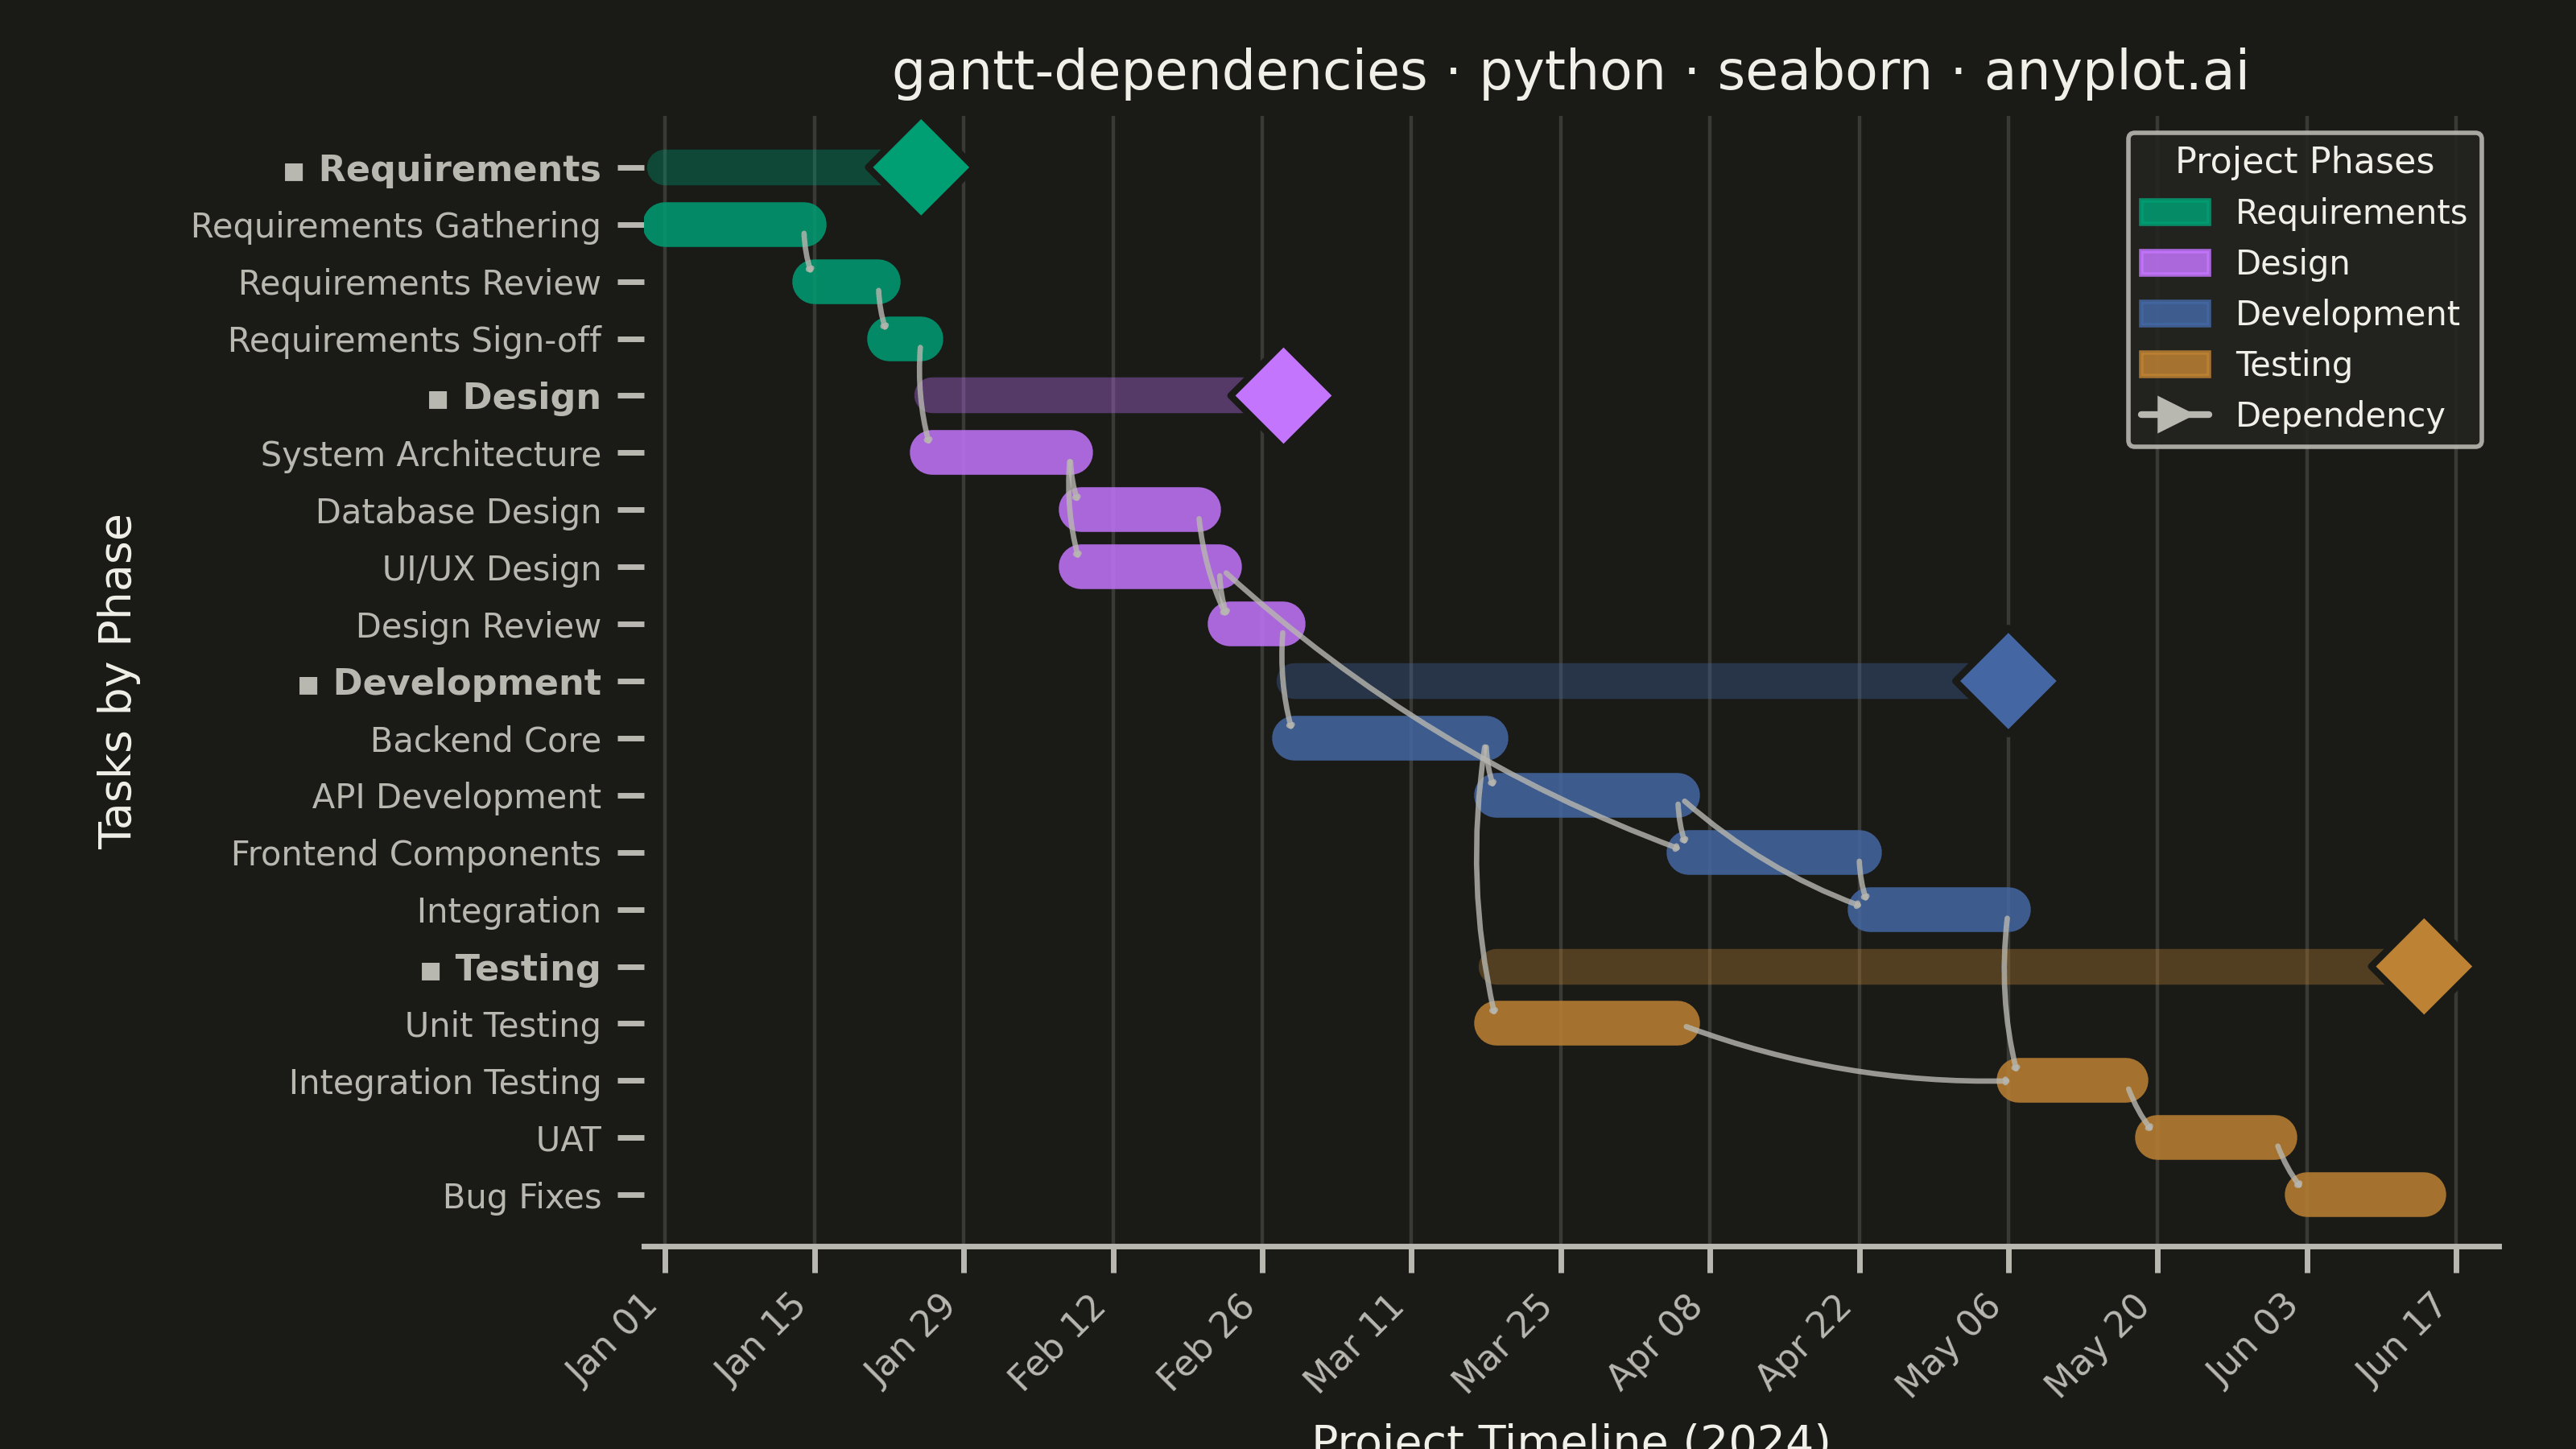
A Gantt chart that visualizes project schedules with task dependencies and groupings. Beyond displaying task timelines, this chart shows relationships between tasks using connector arrows, indicating which tasks must complete before others can begin. Tasks can be organized into groups (phases or work packages) with aggregate timeline bars showing the span of each group. This visualization is essential for understanding critical paths and scheduling constraints in complex projects.
""" anyplot.ai
gantt-dependencies: Gantt Chart with Dependencies
Library: seaborn 0.13.2 | Python 3.13.13
Quality: 88/100 | Updated: 2026-06-02
"""

import os

import matplotlib.patches as mpatches
import matplotlib.pyplot as plt
import numpy as np
import pandas as pd
import seaborn as sns
from matplotlib.patches import FancyArrowPatch


# Theme tokens — Imprint palette, theme-adaptive chrome
THEME = os.getenv("ANYPLOT_THEME", "light")
PAGE_BG = "#FAF8F1" if THEME == "light" else "#1A1A17"
ELEVATED_BG = "#FFFDF6" if THEME == "light" else "#242420"
INK = "#1A1A17" if THEME == "light" else "#F0EFE8"
INK_SOFT = "#4A4A44" if THEME == "light" else "#B8B7B0"

# Imprint categorical palette — canonical order, first series always #009E73
IMPRINT_PALETTE = ["#009E73", "#C475FD", "#4467A3", "#BD8233", "#AE3030", "#2ABCCD", "#954477", "#99B314"]

sns.set_theme(
    style="ticks",
    rc={
        "figure.facecolor": PAGE_BG,
        "axes.facecolor": PAGE_BG,
        "axes.edgecolor": INK_SOFT,
        "axes.labelcolor": INK,
        "text.color": INK,
        "xtick.color": INK_SOFT,
        "ytick.color": INK_SOFT,
        "grid.color": INK,
        "grid.alpha": 0.15,
        "legend.facecolor": ELEVATED_BG,
        "legend.edgecolor": INK_SOFT,
    },
)

# Data: Software Development Project with Dependencies
tasks_data = [
    # Requirements Phase
    {
        "task": "Requirements Gathering",
        "start": "2024-01-01",
        "end": "2024-01-14",
        "group": "Requirements",
        "depends_on": [],
    },
    {
        "task": "Requirements Review",
        "start": "2024-01-15",
        "end": "2024-01-21",
        "group": "Requirements",
        "depends_on": ["Requirements Gathering"],
    },
    {
        "task": "Requirements Sign-off",
        "start": "2024-01-22",
        "end": "2024-01-25",
        "group": "Requirements",
        "depends_on": ["Requirements Review"],
    },
    # Design Phase
    {
        "task": "System Architecture",
        "start": "2024-01-26",
        "end": "2024-02-08",
        "group": "Design",
        "depends_on": ["Requirements Sign-off"],
    },
    {
        "task": "Database Design",
        "start": "2024-02-09",
        "end": "2024-02-20",
        "group": "Design",
        "depends_on": ["System Architecture"],
    },
    {
        "task": "UI/UX Design",
        "start": "2024-02-09",
        "end": "2024-02-22",
        "group": "Design",
        "depends_on": ["System Architecture"],
    },
    {
        "task": "Design Review",
        "start": "2024-02-23",
        "end": "2024-02-28",
        "group": "Design",
        "depends_on": ["Database Design", "UI/UX Design"],
    },
    # Development Phase
    {
        "task": "Backend Core",
        "start": "2024-02-29",
        "end": "2024-03-18",
        "group": "Development",
        "depends_on": ["Design Review"],
    },
    {
        "task": "API Development",
        "start": "2024-03-19",
        "end": "2024-04-05",
        "group": "Development",
        "depends_on": ["Backend Core"],
    },
    {
        "task": "Frontend Components",
        "start": "2024-04-06",
        "end": "2024-04-22",
        "group": "Development",
        "depends_on": ["UI/UX Design", "API Development"],
    },
    {
        "task": "Integration",
        "start": "2024-04-23",
        "end": "2024-05-06",
        "group": "Development",
        "depends_on": ["API Development", "Frontend Components"],
    },
    # Testing Phase
    {
        "task": "Unit Testing",
        "start": "2024-03-19",
        "end": "2024-04-05",
        "group": "Testing",
        "depends_on": ["Backend Core"],
    },
    {
        "task": "Integration Testing",
        "start": "2024-05-07",
        "end": "2024-05-17",
        "group": "Testing",
        "depends_on": ["Integration", "Unit Testing"],
    },
    {
        "task": "UAT",
        "start": "2024-05-20",
        "end": "2024-05-31",
        "group": "Testing",
        "depends_on": ["Integration Testing"],
    },
    {"task": "Bug Fixes", "start": "2024-06-03", "end": "2024-06-14", "group": "Testing", "depends_on": ["UAT"]},
]

df = pd.DataFrame(tasks_data)
df["start"] = pd.to_datetime(df["start"])
df["end"] = pd.to_datetime(df["end"])

ref_date = df["start"].min()
df["start_num"] = (df["start"] - ref_date).dt.days
df["end_num"] = (df["end"] - ref_date).dt.days

# Y positions: group header row, then individual task rows
groups = list(df["group"].unique())
phase_colors = {group: IMPRINT_PALETTE[i] for i, group in enumerate(groups)}

y_positions = {}
task_to_y = {}
y_counter = 0

for group in groups:
    y_positions[group] = y_counter
    y_counter += 1
    for task in df[df["group"] == group]["task"].tolist():
        task_to_y[task] = y_counter
        y_counter += 1

df["y_pos"] = df["task"].map(task_to_y)

# Canvas: 3200 × 1800 px (landscape 16:9) — bbox_inches must stay default (None)
fig, ax = plt.subplots(figsize=(8, 4.5), dpi=400, facecolor=PAGE_BG)
ax.set_facecolor(PAGE_BG)

# Build lineplot data: two endpoints per task (sns.lineplot + units draws one bar per task)
line_data = []
for _, row in df.iterrows():
    line_data.extend(
        [
            {"x": row["start_num"], "y": row["y_pos"], "task": row["task"], "group": row["group"]},
            {"x": row["end_num"], "y": row["y_pos"], "task": row["task"], "group": row["group"]},
        ]
    )

line_df = pd.DataFrame(line_data)

# Task bars via sns.lineplot with units — idiomatic seaborn approach for Gantt charts
sns.lineplot(
    data=line_df,
    x="x",
    y="y",
    hue="group",
    units="task",
    estimator=None,
    palette=phase_colors,
    linewidth=10,
    alpha=0.85,
    ax=ax,
    legend=False,
)

# Phase aggregate bars: semi-transparent span across all tasks in each group
for group in groups:
    g_df = df[df["group"] == group]
    ax.plot(
        [g_df["start_num"].min(), g_df["end_num"].max()],
        [y_positions[group], y_positions[group]],
        color=phase_colors[group],
        linewidth=8,
        alpha=0.35,
        solid_capstyle="round",
    )

# Phase completion milestones via sns.scatterplot — diamond markers sized for 3200×1800
milestone_df = pd.DataFrame(
    [{"x": df[df["group"] == g]["end_num"].max(), "y": y_positions[g], "group": g} for g in groups]
)

sns.scatterplot(
    data=milestone_df,
    x="x",
    y="y",
    hue="group",
    palette=phase_colors,
    marker="D",
    s=280,
    edgecolor=PAGE_BG,
    linewidth=1.5,
    zorder=6,
    ax=ax,
    legend=False,
)

# Dependency arrows: predecessor end → successor start, theme-adaptive ink color
# Cross-phase arrows use larger arc radius to reduce clutter in busy transition zones
for _, row in df.iterrows():
    if row["depends_on"]:
        for dep in row["depends_on"]:
            dep_row = df[df["task"] == dep].iloc[0]
            same_phase = dep_row["group"] == row["group"]
            rad = 0.15 if same_phase else 0.3
            arrow = FancyArrowPatch(
                (dep_row["end_num"], task_to_y[dep]),
                (row["start_num"], task_to_y[row["task"]]),
                connectionstyle=f"arc3,rad={rad}",
                arrowstyle="->,head_width=0.4,head_length=0.3",
                color=INK_SOFT,
                linewidth=1.2,
                alpha=0.8,
                zorder=5,
            )
            ax.add_patch(arrow)

# Y-axis: hierarchical labels with bold group headers
all_labels = []
all_y = []
for group in groups:
    all_labels.append(f"▪ {group}")
    all_y.append(y_positions[group])
    for task in df[df["group"] == group]["task"].tolist():
        all_labels.append(f"   {task}")
        all_y.append(task_to_y[task])

ax.set_yticks(all_y)
ax.set_yticklabels(all_labels, fontsize=7.5)
ax.invert_yaxis()

for label in ax.get_yticklabels():
    if label.get_text().startswith("▪"):
        label.set_fontweight("bold")
        label.set_fontsize(9)

# X-axis: biweekly date ticks
max_day = int(df["end_num"].max()) + 7
date_ticks = np.arange(0, max_day, 14)
date_labels = [(ref_date + pd.Timedelta(days=int(d))).strftime("%b %d") for d in date_ticks]
ax.set_xticks(date_ticks)
ax.set_xticklabels(date_labels, fontsize=8, rotation=45, ha="right")
ax.set_xlim(-2, max_day)

# Title, subtitle, and axis labels
ax.set_title("gantt-dependencies · python · seaborn · anyplot.ai", fontsize=12, fontweight="medium", color=INK, pad=22)
ax.annotate(
    "Software Development Project  ·  Q1–Q2 2024",
    xy=(0.5, 1.02),
    xycoords="axes fraction",
    ha="center",
    va="bottom",
    fontsize=9,
    color=INK_SOFT,
    style="italic",
)
ax.set_xlabel("Project Timeline (2024)", fontsize=10, color=INK)
ax.set_ylabel("Tasks by Phase", fontsize=10, color=INK)

# Subtle vertical-only grid
ax.grid(True, axis="x", alpha=0.15, linewidth=0.8, color=INK)
ax.grid(False, axis="y")
ax.set_axisbelow(True)

# Legend: phase color patches, dotted divider, then dependency arrow indicator
legend_patches = [mpatches.Patch(color=phase_colors[g], alpha=0.85, label=g) for g in groups]
divider = plt.Line2D([], [], linewidth=0.5, color=INK_SOFT, linestyle=":", alpha=0.6, label=" ")
arrow_legend = plt.Line2D([0], [0], color=INK_SOFT, linewidth=1.5, marker=">", markersize=7, label="Dependency")
ax.legend(
    handles=legend_patches + [divider, arrow_legend],
    loc="upper right",
    fontsize=7.5,
    framealpha=0.9,
    title="Phases & Flow",
    title_fontsize=8,
    handlelength=1.5,
    labelspacing=0.35,
)

# Remove left spine for cleaner look; keep bottom for time axis reference
sns.despine(left=True, bottom=False, ax=ax)

# Manual padding — avoids bbox_inches="tight" canvas drift; bottom raised for x-label clearance
fig.subplots_adjust(left=0.25, right=0.97, top=0.89, bottom=0.17)

plt.savefig(f"plot-{THEME}.png", dpi=400, facecolor=PAGE_BG)
Runnable source as JSON, for any HTTP client: https://api.anyplot.ai/specs/gantt-dependencies/seaborn/code. Any spec id and library id listed in llms-full.txt fit the same URL shape; every URL below is complete and callable.
{
  "spec_id": "gantt-dependencies",
  "language": "python",
  "library": "seaborn",
  "page": "https://anyplot.ai/gantt-dependencies/python/seaborn",
  "hub": "https://anyplot.ai/gantt-dependencies",
  "code_json": "https://api.anyplot.ai/specs/gantt-dependencies/seaborn/code",
  "spec_json": "https://api.anyplot.ai/specs/gantt-dependencies",
  "render_light_png": "https://storage.googleapis.com/anyplot-images/plots/gantt-dependencies/python/seaborn/plot-light.png",
  "render_dark_png": "https://storage.googleapis.com/anyplot-images/plots/gantt-dependencies/python/seaborn/plot-dark.png",
  "quality_score": 88.0,
  "license": "MIT",
  "guide": "https://anyplot.ai/llms.txt"
}
Part of Gantt Chart with Dependencies on anyplot.ai.