The same plot in 14 other libraries — JavaScript: Chart.js, D3.js, Apache ECharts, Highcharts; Python: Altair, Bokeh, lets-plot, Matplotlib, Plotly, plotnine, Pygal, Seaborn; R: ggplot2; Julia: Makie.jl. Compare all 15 side by side: Gantt Chart with Dependencies in Python, R, Julia and JavaScript.
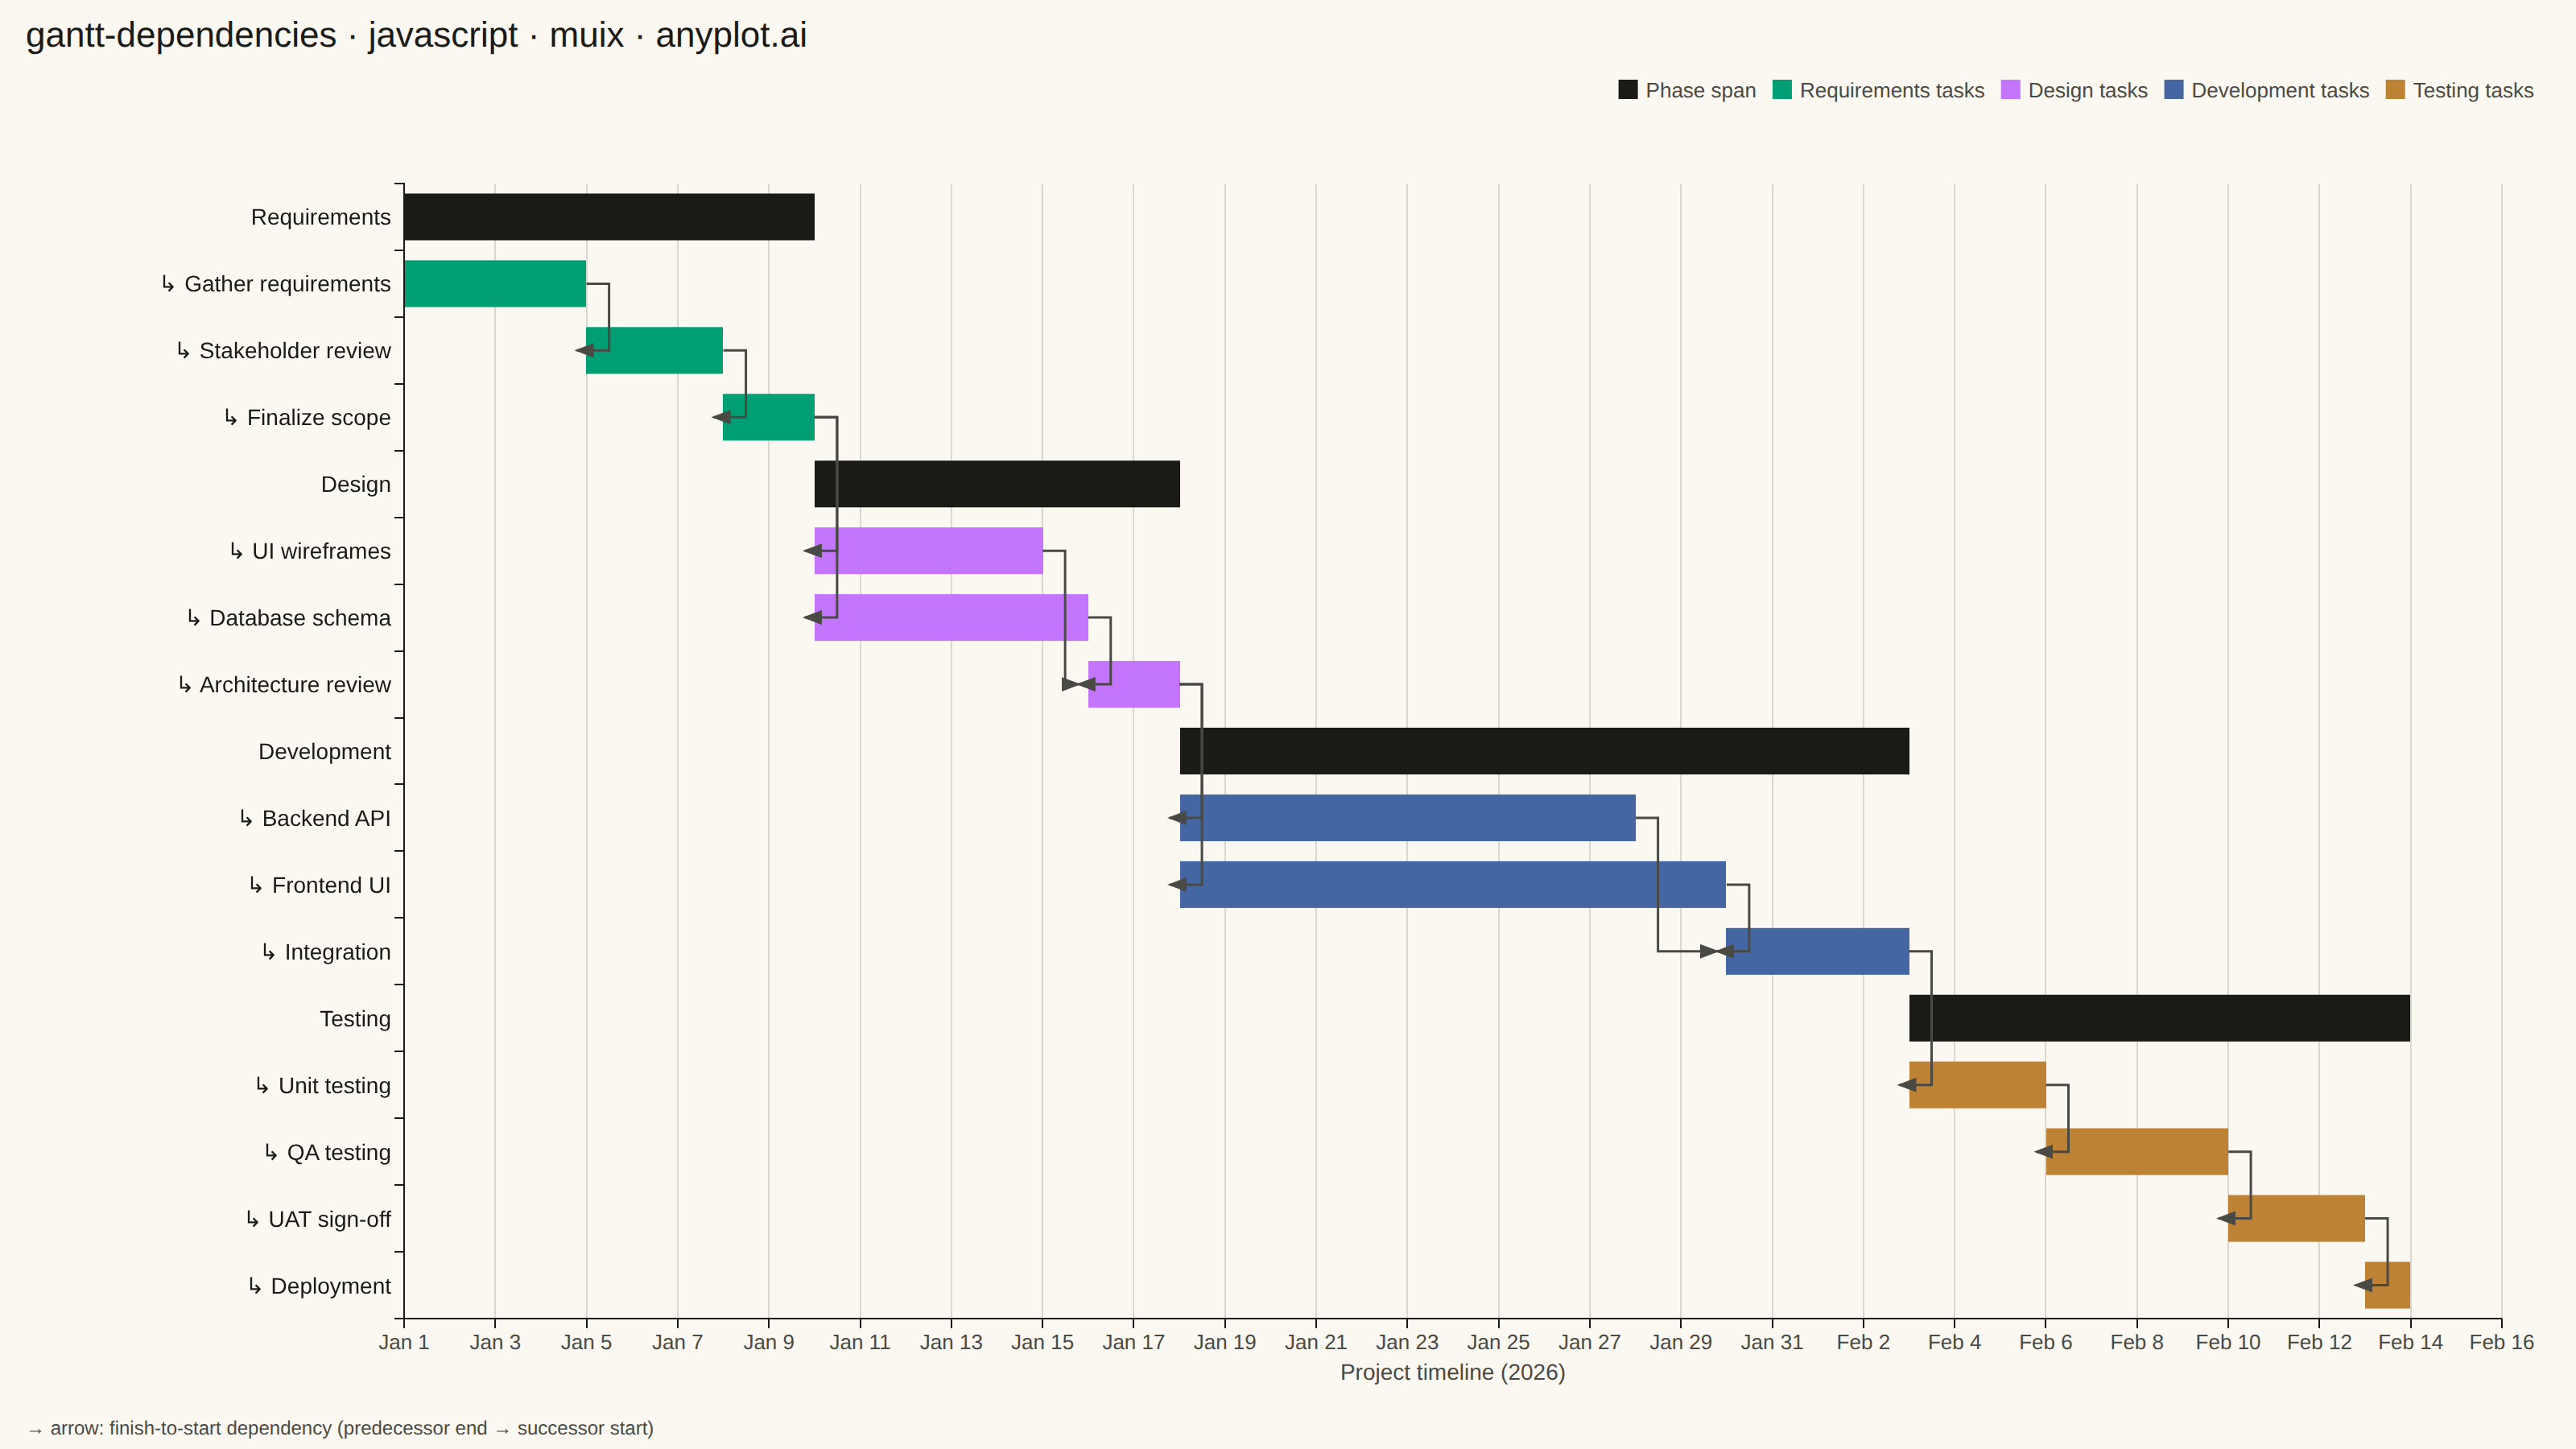
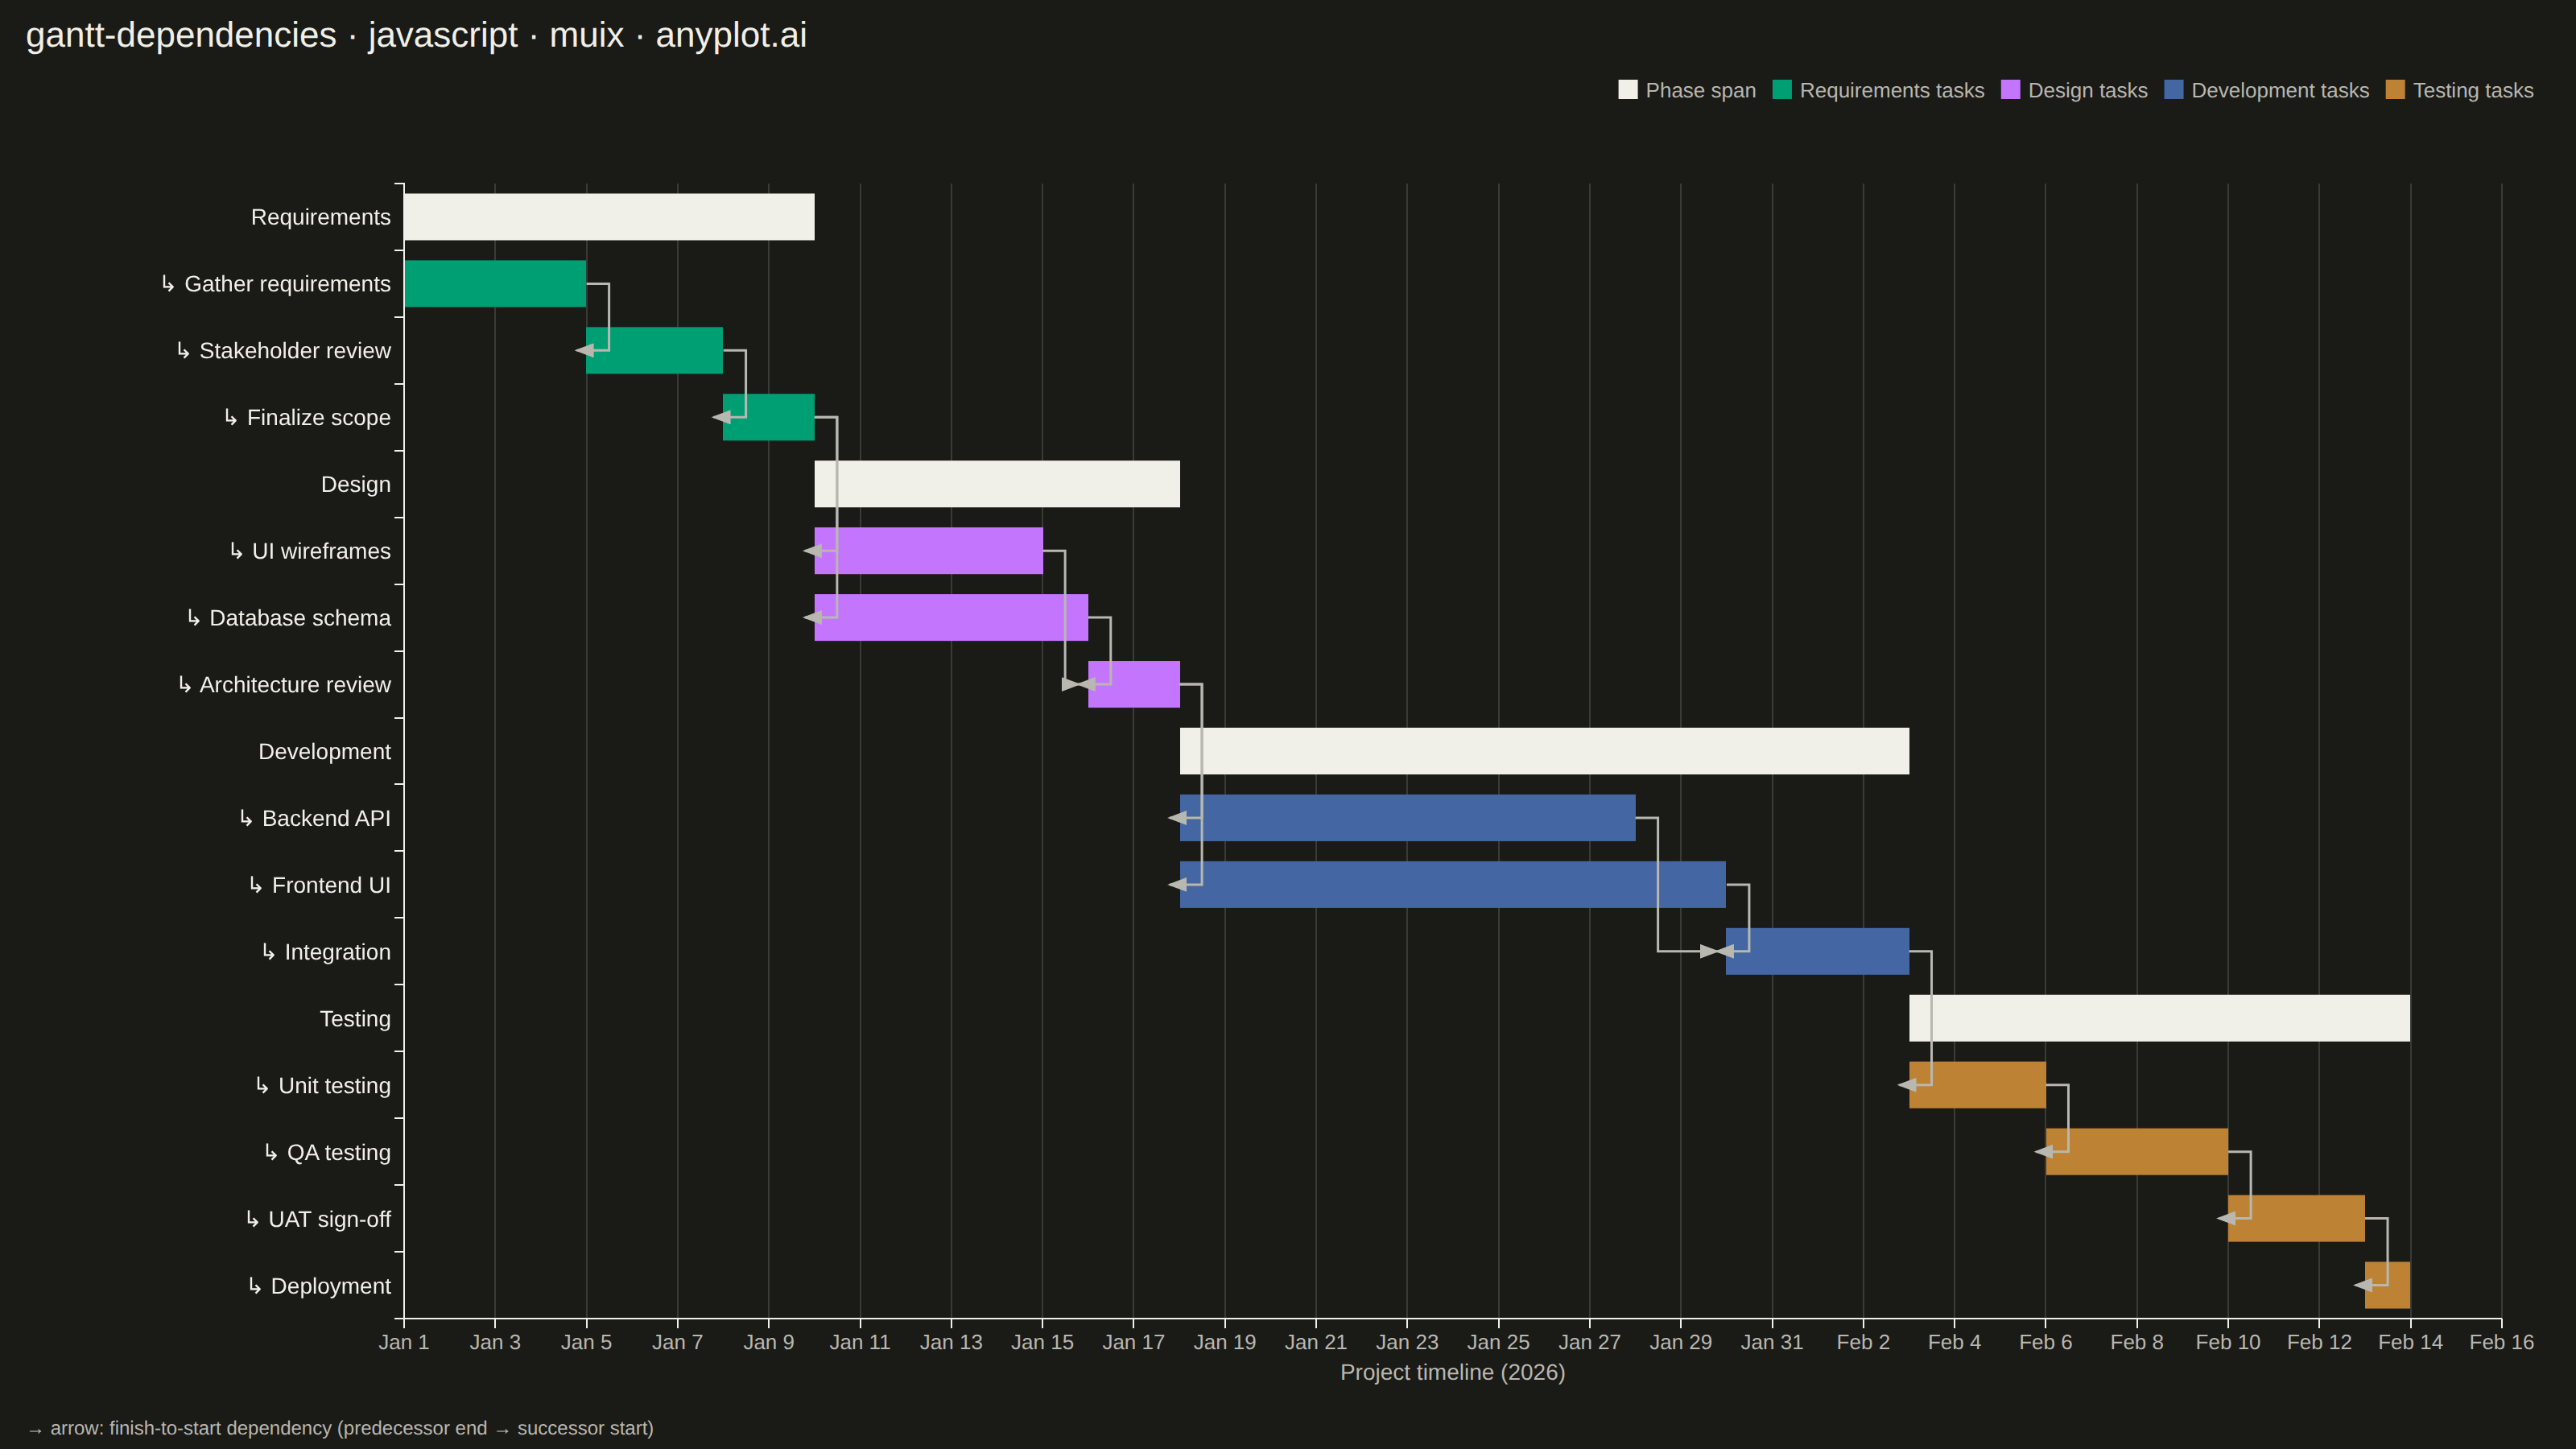
A Gantt chart that visualizes project schedules with task dependencies and groupings. Beyond displaying task timelines, this chart shows relationships between tasks using connector arrows, indicating which tasks must complete before others can begin. Tasks can be organized into groups (phases or work packages) with aggregate timeline bars showing the span of each group. This visualization is essential for understanding critical paths and scheduling constraints in complex projects.
// anyplot.ai
// gantt-dependencies: Gantt Chart with Dependencies
// Library: muix 7.29.1 | JavaScript 22.23.2
// Quality: 90/100 | Created: 2026-08-25
import { BarChart } from "@mui/x-charts/BarChart";
import { useXScale, useYScale } from "@mui/x-charts/hooks";
import Box from "@mui/material/Box";
import Typography from "@mui/material/Typography";

const t = window.ANYPLOT_TOKENS;

// --- Data (in-memory, deterministic) ----------------------------------------
// Software release plan: four phases, each a group of dependent tasks.
// start/end are day offsets from 2026-01-01 (Day 0 = Jan 1).
const PHASES = [
  {
    name: "Requirements",
    tasks: [
      { task: "Gather requirements", start: 0, end: 4, dependsOn: [] },
      { task: "Stakeholder review", start: 4, end: 7, dependsOn: ["Gather requirements"] },
      { task: "Finalize scope", start: 7, end: 9, dependsOn: ["Stakeholder review"] },
    ],
  },
  {
    name: "Design",
    tasks: [
      { task: "UI wireframes", start: 9, end: 14, dependsOn: ["Finalize scope"] },
      { task: "Database schema", start: 9, end: 15, dependsOn: ["Finalize scope"] },
      { task: "Architecture review", start: 15, end: 17, dependsOn: ["UI wireframes", "Database schema"] },
    ],
  },
  {
    name: "Development",
    tasks: [
      { task: "Backend API", start: 17, end: 27, dependsOn: ["Architecture review"] },
      { task: "Frontend UI", start: 17, end: 29, dependsOn: ["Architecture review"] },
      { task: "Integration", start: 29, end: 33, dependsOn: ["Backend API", "Frontend UI"] },
    ],
  },
  {
    name: "Testing",
    tasks: [
      { task: "Unit testing", start: 33, end: 36, dependsOn: ["Integration"] },
      { task: "QA testing", start: 36, end: 40, dependsOn: ["Unit testing"] },
      { task: "UAT sign-off", start: 40, end: 43, dependsOn: ["QA testing"] },
      { task: "Deployment", start: 43, end: 44, dependsOn: ["UAT sign-off"] },
    ],
  },
];

const MONTH_LENGTHS = [31, 28, 31, 30, 31, 30, 31, 31, 30, 31, 30, 31]; // 2026 (non-leap)
const MONTH_NAMES = ["Jan", "Feb", "Mar", "Apr", "May", "Jun", "Jul", "Aug", "Sep", "Oct", "Nov", "Dec"];

function formatDay(dayOffset) {
  let day = Math.round(dayOffset) + 1;
  let month = 0;
  while (day > MONTH_LENGTHS[month]) {
    day -= MONTH_LENGTHS[month];
    month += 1;
  }
  return `${MONTH_NAMES[month]} ${day}`;
}

// Flatten into rows (group header, then its child tasks) — top-to-bottom order.
// The band y-axis places array index 0 at the top row, so this array order is
// already the desired reading order (earliest phase first).
const rows = [];
const rowLabelByTask = {};
PHASES.forEach((phase, phaseIndex) => {
  const groupStart = Math.min(...phase.tasks.map((task) => task.start));
  const groupEnd = Math.max(...phase.tasks.map((task) => task.end));
  rows.push({ label: phase.name, kind: "group", start: groupStart, end: groupEnd, phaseIndex });
  phase.tasks.forEach((task) => {
    const label = `↳ ${task.task}`;
    rowLabelByTask[task.task] = label;
    rows.push({ label, kind: "task", start: task.start, end: task.end, phaseIndex, dependsOn: task.dependsOn });
  });
});

const rowLabels = rows.map((row) => row.label);
const maxDay = Math.max(...rows.map((row) => row.end));

const offsetData = rows.map((row) => row.start);
const groupSpanData = rows.map((row) => (row.kind === "group" ? row.end - row.start : null));
const phaseTaskData = PHASES.map((_, phaseIndex) =>
  rows.map((row) => (row.kind === "task" && row.phaseIndex === phaseIndex ? row.end - row.start : null)),
);

// Dependency edges — predecessor's end (right edge) to successor's start (left edge).
const edges = [];
rows.forEach((row) => {
  if (row.kind !== "task") return;
  row.dependsOn.forEach((depName) => {
    const fromLabel = rowLabelByTask[depName];
    const fromRow = rows.find((candidate) => candidate.label === fromLabel);
    if (!fromRow) return;
    edges.push({ fromLabel, fromDay: fromRow.end, toLabel: row.label, toDay: row.start });
  });
});

const series = [
  { id: "offset", data: offsetData, stack: "total", color: "transparent" },
  { id: "group-span", label: "Phase span", data: groupSpanData, stack: "total", color: t.ink },
  ...PHASES.map((phase, phaseIndex) => ({
    id: `phase-${phaseIndex}`,
    label: `${phase.name} tasks`,
    data: phaseTaskData[phaseIndex],
    stack: "total",
    color: t.palette[phaseIndex],
  })),
];

const TITLE = "gantt-dependencies · javascript · muix · anyplot.ai";
const TITLE_HEIGHT = 44;
const CAPTION_HEIGHT = 26;

// --- Custom overlay: dependency connector arrows -----------------------------
// Reads the chart's real x/y scales so arrows land exactly on bar edges — not a
// drawn approximation. Rendered as a child of <BarChart>, inside its context.
function DependencyArrows() {
  const xScale = useXScale();
  const yScale = useYScale();
  const bandwidth = typeof yScale.bandwidth === "function" ? yScale.bandwidth() : 0;

  return (
    <g>
      <defs>
        <marker id="dep-arrowhead" markerWidth="10" markerHeight="10" refX="7" refY="3" orient="auto">
          <path d="M0,0 L8,3 L0,6 Z" fill={t.inkSoft} />
        </marker>
      </defs>
      {edges.map((edge) => {
        const fromX = xScale(edge.fromDay);
        const fromY = yScale(edge.fromLabel) + bandwidth / 2;
        const toX = xScale(edge.toDay);
        const toY = yScale(edge.toLabel) + bandwidth / 2;
        const midX = fromX + 14;
        const d = `M ${fromX} ${fromY} L ${midX} ${fromY} L ${midX} ${toY} L ${toX - 6} ${toY}`;
        return (
          <path
            key={`${edge.fromLabel}->${edge.toLabel}`}
            d={d}
            stroke={t.inkSoft}
            strokeWidth={1.5}
            fill="none"
            markerEnd="url(#dep-arrowhead)"
          />
        );
      })}
    </g>
  );
}

// --- Chart (default-exported component — the harness mounts it) -------------
export default function Chart() {
  const chartHeight = window.ANYPLOT_SIZE.height - TITLE_HEIGHT - CAPTION_HEIGHT;

  return (
    <Box
      sx={{
        width: window.ANYPLOT_SIZE.width,
        height: window.ANYPLOT_SIZE.height,
        display: "flex",
        flexDirection: "column",
        boxSizing: "border-box",
        px: 2,
      }}
    >
      <Typography sx={{ fontSize: 22, fontWeight: 500, color: t.ink, lineHeight: `${TITLE_HEIGHT}px` }}>
        {TITLE}
      </Typography>
      <BarChart
        width={window.ANYPLOT_SIZE.width - 32}
        height={chartHeight}
        layout="horizontal"
        skipAnimation
        series={series}
        xAxis={[
          {
            scaleType: "linear",
            min: 0,
            max: maxDay + 2,
            valueFormatter: (value) => formatDay(value),
            tickLabelStyle: { fontSize: 13, fill: t.inkSoft },
            label: "Project timeline (2026)",
            labelStyle: { fontSize: 14, fill: t.inkSoft },
          },
        ]}
        yAxis={[
          {
            scaleType: "band",
            data: rowLabels,
            tickLabelStyle: { fontSize: 14, fill: t.ink },
            categoryGapRatio: 0.3,
          },
        ]}
        grid={{ vertical: true }}
        margin={{ left: 235, right: 30, top: 70, bottom: 55 }}
        slotProps={{
          legend: {
            position: { vertical: "top", horizontal: "right" },
            itemMarkWidth: 12,
            itemMarkHeight: 12,
            labelStyle: { fontSize: 13, fill: t.inkSoft },
            padding: { top: 0, bottom: 20 },
          },
        }}
      >
        <DependencyArrows />
      </BarChart>
      <Typography sx={{ fontSize: 12, color: t.inkSoft, lineHeight: `${CAPTION_HEIGHT}px` }}>
        {"→"} arrow: finish-to-start dependency (predecessor end {"→"} successor start)
      </Typography>
    </Box>
  );
}
Runnable source as JSON, for any HTTP client: https://api.anyplot.ai/specs/gantt-dependencies/muix/code. Any spec id and library id listed in llms-full.txt fit the same URL shape; every URL below is complete and callable.
{
  "spec_id": "gantt-dependencies",
  "language": "javascript",
  "library": "muix",
  "page": "https://anyplot.ai/gantt-dependencies/javascript/muix",
  "hub": "https://anyplot.ai/gantt-dependencies",
  "code_json": "https://api.anyplot.ai/specs/gantt-dependencies/muix/code",
  "spec_json": "https://api.anyplot.ai/specs/gantt-dependencies",
  "render_light_png": "https://storage.googleapis.com/anyplot-images/plots/gantt-dependencies/javascript/muix/plot-light.png",
  "render_dark_png": "https://storage.googleapis.com/anyplot-images/plots/gantt-dependencies/javascript/muix/plot-dark.png",
  "interactive_light_html": "https://storage.googleapis.com/anyplot-images/plots/gantt-dependencies/javascript/muix/plot-light.html",
  "interactive_dark_html": "https://storage.googleapis.com/anyplot-images/plots/gantt-dependencies/javascript/muix/plot-dark.html",
  "quality_score": 90.0,
  "license": "MIT",
  "guide": "https://anyplot.ai/llms.txt"
}
Part of Gantt Chart with Dependencies on anyplot.ai.