The same plot in 14 other libraries — JavaScript: Chart.js, Apache ECharts, Highcharts, MUI X Charts; Python: Altair, Bokeh, lets-plot, Matplotlib, Plotly, plotnine, Pygal, Seaborn; R: ggplot2; Julia: Makie.jl. Compare all 15 side by side: Gantt Chart with Dependencies in Python, R, Julia and JavaScript.
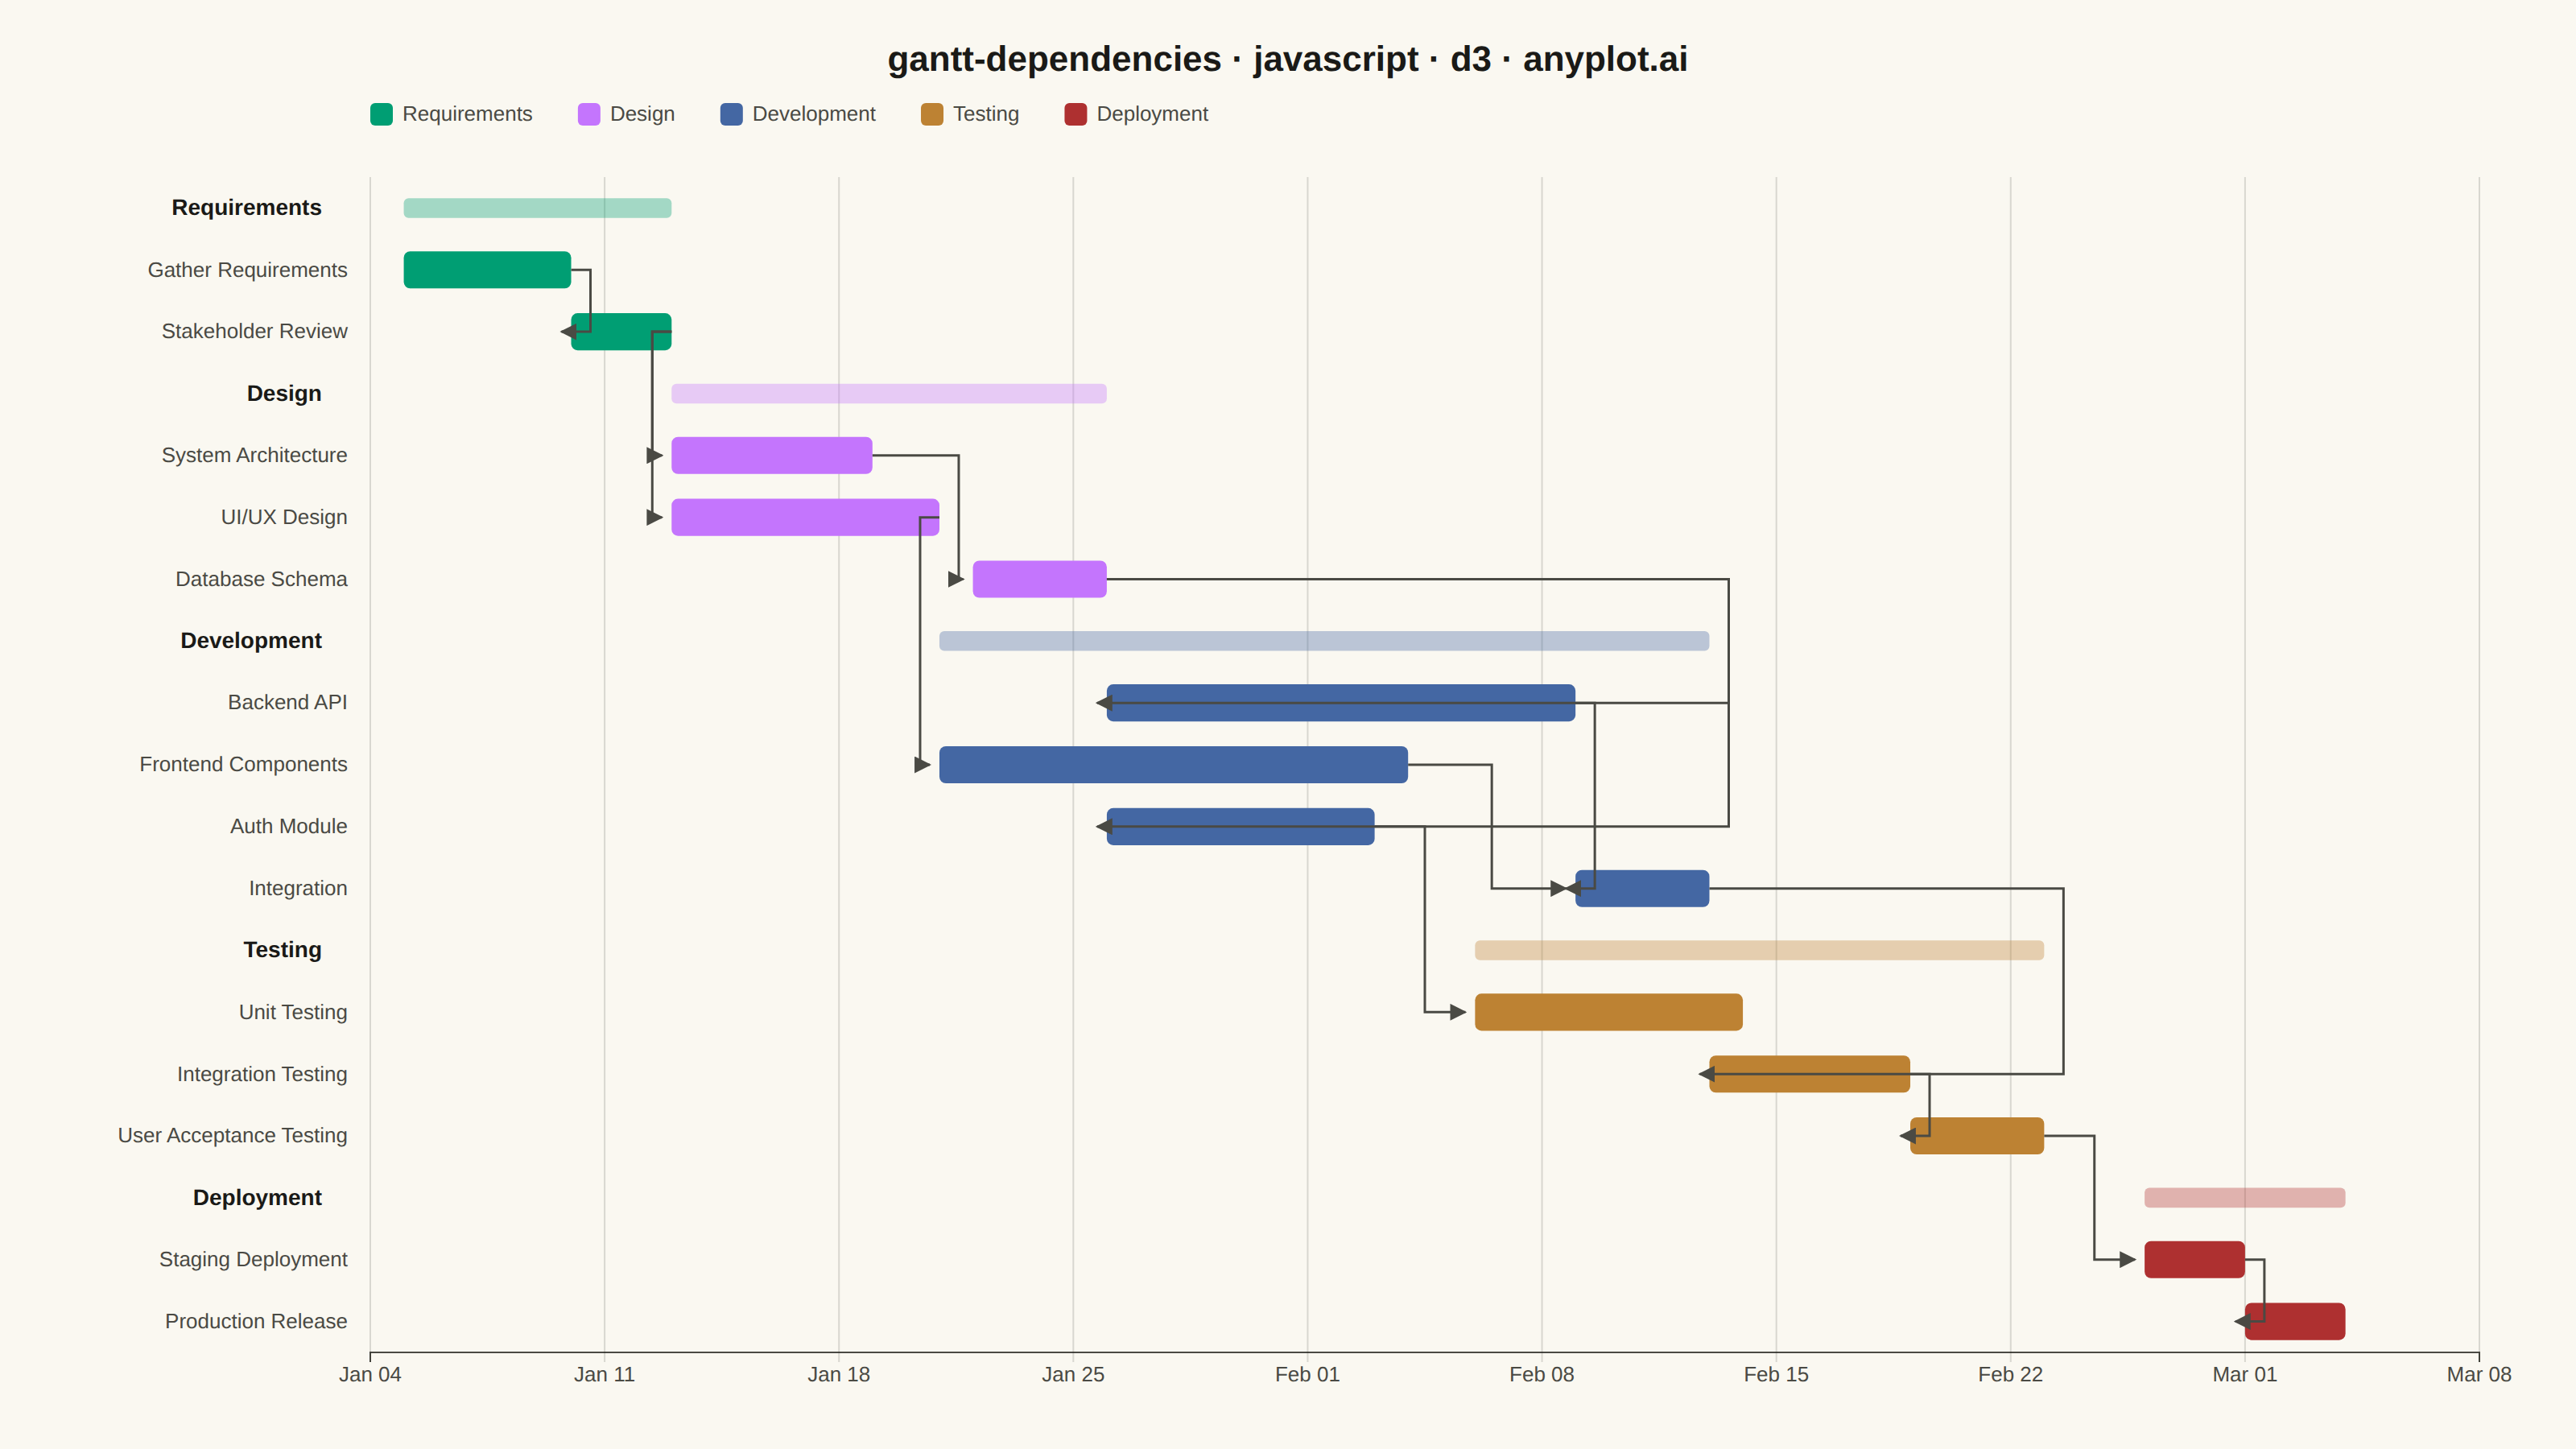
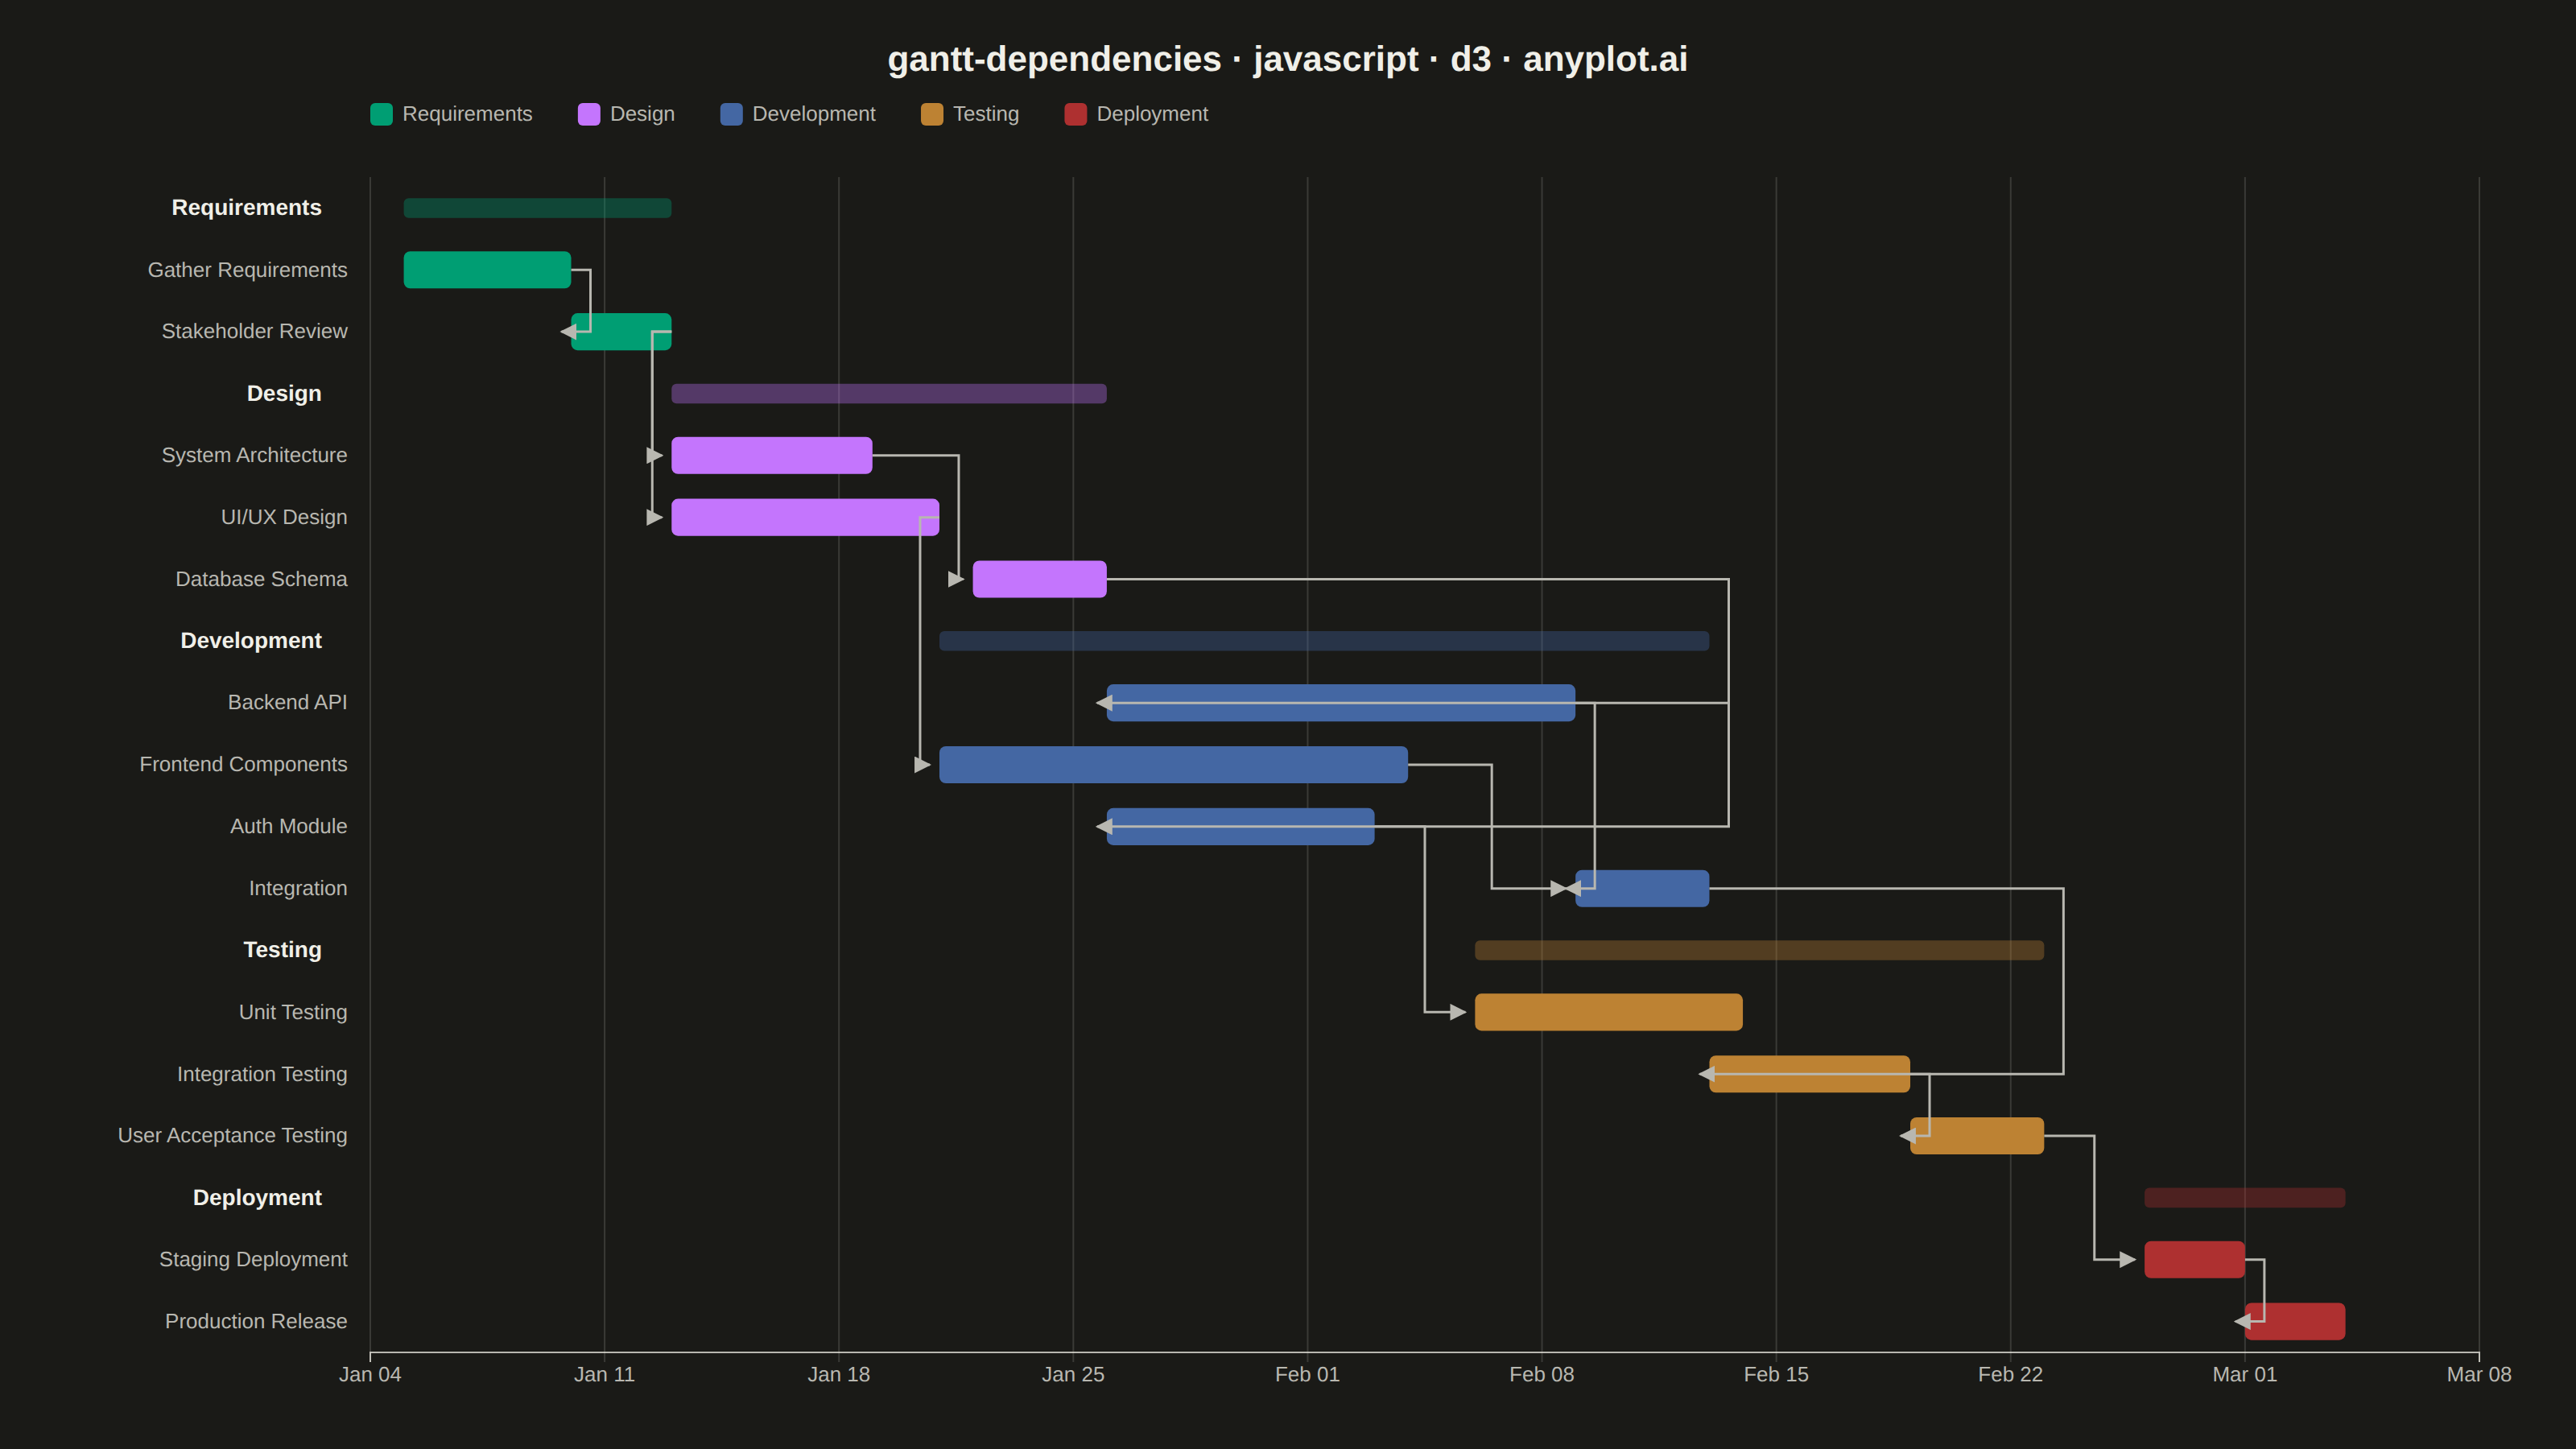
A Gantt chart that visualizes project schedules with task dependencies and groupings. Beyond displaying task timelines, this chart shows relationships between tasks using connector arrows, indicating which tasks must complete before others can begin. Tasks can be organized into groups (phases or work packages) with aggregate timeline bars showing the span of each group. This visualization is essential for understanding critical paths and scheduling constraints in complex projects.
// anyplot.ai
// gantt-dependencies: Gantt Chart with Dependencies
// Library: d3 7.9.0 | JavaScript 22.23.2
// Quality: 94/100 | Updated: 2026-08-25

const t = window.ANYPLOT_TOKENS;
const { width, height } = window.ANYPLOT_SIZE;
const margin = { top: 110, right: 60, bottom: 60, left: 230 };
const iw = width - margin.left - margin.right;
const ih = height - margin.top - margin.bottom;

// --- Data (in-memory, deterministic) ----------------------------------------
// Offsets are workdays from the project kickoff date. Database Schema, Unit
// Testing, and Staging Deployment each start a few days after their
// predecessor's end so the schedule shows real slack, not one uniformly
// tight critical-path chain.
const PROJECT_START = new Date(2026, 0, 5);
const dayToDate = (d) => new Date(PROJECT_START.getTime() + d * 86400000);

const GROUPS = [
  {
    name: "Requirements",
    tasks: [
      { task: "Gather Requirements", start: 0, end: 5 },
      { task: "Stakeholder Review", start: 5, end: 8, dependsOn: ["Gather Requirements"] },
    ],
  },
  {
    name: "Design",
    tasks: [
      { task: "System Architecture", start: 8, end: 14, dependsOn: ["Stakeholder Review"] },
      { task: "UI/UX Design", start: 8, end: 16, dependsOn: ["Stakeholder Review"] },
      { task: "Database Schema", start: 17, end: 21, dependsOn: ["System Architecture"] },
    ],
  },
  {
    name: "Development",
    tasks: [
      { task: "Backend API", start: 21, end: 35, dependsOn: ["Database Schema"] },
      { task: "Frontend Components", start: 16, end: 30, dependsOn: ["UI/UX Design"] },
      { task: "Auth Module", start: 21, end: 29, dependsOn: ["Database Schema"] },
      { task: "Integration", start: 35, end: 39, dependsOn: ["Backend API", "Frontend Components"] },
    ],
  },
  {
    name: "Testing",
    tasks: [
      { task: "Unit Testing", start: 32, end: 40, dependsOn: ["Auth Module"] },
      { task: "Integration Testing", start: 39, end: 45, dependsOn: ["Integration"] },
      { task: "User Acceptance Testing", start: 45, end: 49, dependsOn: ["Integration Testing"] },
    ],
  },
  {
    name: "Deployment",
    tasks: [
      { task: "Staging Deployment", start: 52, end: 55, dependsOn: ["User Acceptance Testing"] },
      { task: "Production Release", start: 55, end: 58, dependsOn: ["Staging Deployment"] },
    ],
  },
];

// --- Flatten into rows (group header row, then its indented task rows) ------
const rows = [];
GROUPS.forEach((group, groupIndex) => {
  const groupStart = d3.min(group.tasks, (d) => d.start);
  const groupEnd = d3.max(group.tasks, (d) => d.end);
  rows.push({ kind: "group", name: group.name, start: groupStart, end: groupEnd, groupIndex });
  group.tasks.forEach((d) => rows.push({ kind: "task", ...d, groupIndex }));
});

const allStart = d3.min(rows, (d) => d.start);
const allEnd = d3.max(rows, (d) => d.end);

// --- Scales -------------------------------------------------------------------
const x = d3.scaleTime()
  .domain([dayToDate(allStart), dayToDate(allEnd)])
  .nice(d3.timeWeek)
  .range([0, iw]);

const rowHeight = ih / rows.length;
const y = (i) => i * rowHeight + rowHeight / 2;

// Pixel extent of every row's bar (group aggregate or task), keyed by row
// index — used below to route dependency arrows around bars they would
// otherwise cross.
const rowExtent = rows.map((row) => ({ xStart: x(dayToDate(row.start)), xEnd: x(dayToDate(row.end)) }));
const taskRowIndex = new Map();
rows.forEach((row, i) => {
  if (row.kind === "task") taskRowIndex.set(row.task, i);
});

// --- SVG mount ----------------------------------------------------------------
const svg = d3.select("#container").append("svg").attr("width", width).attr("height", height);

svg.append("defs").append("marker")
  .attr("id", "arrowhead")
  .attr("viewBox", "0 0 10 10")
  .attr("refX", 9)
  .attr("refY", 5)
  .attr("markerWidth", 7)
  .attr("markerHeight", 7)
  .attr("orient", "auto-start-reverse")
  .append("path")
  .attr("d", "M0,0 L10,5 L0,10 Z")
  .attr("fill", t.inkSoft);

const g = svg.append("g").attr("transform", `translate(${margin.left},${margin.top})`);

// --- Axes -----------------------------------------------------------------
const xAxis = g.append("g")
  .attr("transform", `translate(0,${ih})`)
  .call(d3.axisBottom(x).ticks(d3.timeWeek.every(1)).tickFormat(d3.timeFormat("%b %d")));
xAxis.selectAll("text").attr("fill", t.inkSoft).style("font-size", "13px");
xAxis.selectAll("line").attr("stroke", t.grid);
xAxis.select(".domain").attr("stroke", t.inkSoft);

g.append("g")
  .attr("class", "grid")
  .selectAll("line")
  .data(x.ticks(d3.timeWeek.every(1)))
  .join("line")
  .attr("x1", (d) => x(d))
  .attr("x2", (d) => x(d))
  .attr("y1", 0)
  .attr("y2", ih)
  .attr("stroke", t.grid)
  .attr("stroke-width", 1);

// --- Row labels (group names bold, task names indented) -----------------------
g.selectAll(".row-label")
  .data(rows)
  .join("text")
  .attr("class", "row-label")
  .attr("x", (d) => (d.kind === "group" ? -30 : -14))
  .attr("y", (d, i) => y(i))
  .attr("dy", "0.32em")
  .attr("text-anchor", "end")
  .style("font-size", (d) => (d.kind === "group" ? "14px" : "13px"))
  .style("font-weight", (d) => (d.kind === "group" ? "600" : "400"))
  .attr("fill", (d) => (d.kind === "group" ? t.ink : t.inkSoft))
  .text((d) => d.name || d.task);

// --- Group aggregate span bars (thin bracket behind the group's tasks) --------
const groupRows = rows.map((d, i) => ({ ...d, rowIndex: i })).filter((d) => d.kind === "group");
g.selectAll(".group-span")
  .data(groupRows)
  .join("rect")
  .attr("class", "group-span")
  .attr("x", (d) => rowExtent[d.rowIndex].xStart)
  .attr("y", (d) => y(d.rowIndex) - rowHeight * 0.16)
  .attr("width", (d) => rowExtent[d.rowIndex].xEnd - rowExtent[d.rowIndex].xStart)
  .attr("height", rowHeight * 0.32)
  .attr("rx", 3)
  .attr("fill", (d) => t.palette[d.groupIndex % t.palette.length])
  .attr("fill-opacity", 0.35);

// --- Task bars ------------------------------------------------------------
const taskRows = rows.map((d, i) => ({ ...d, rowIndex: i })).filter((d) => d.kind === "task");
const barHeight = rowHeight * 0.6;
g.selectAll(".task-bar")
  .data(taskRows)
  .join("rect")
  .attr("class", "task-bar")
  .attr("x", (d) => rowExtent[d.rowIndex].xStart)
  .attr("y", (d) => y(d.rowIndex) - barHeight / 2)
  .attr("width", (d) => Math.max(rowExtent[d.rowIndex].xEnd - rowExtent[d.rowIndex].xStart, 2))
  .attr("height", barHeight)
  .attr("rx", 4)
  .attr("fill", (d) => t.palette[d.groupIndex % t.palette.length]);

// --- Dependency arrows: predecessor's right edge -> successor's left edge ----
// The vertical trunk is routed around any bar (task or group-aggregate) that
// occupies a row strictly between predecessor and successor, so arrows skirt
// around unrelated bars instead of cutting through them.
const edges = [];
taskRows.forEach((row) => {
  (row.dependsOn || []).forEach((depName) => {
    const fromRow = taskRowIndex.get(depName);
    if (fromRow === undefined) return;
    edges.push({ id: `${depName}->${row.task}`, fromRow, toRow: row.rowIndex });
  });
});

const laneX = (fromXEnd, toXStart, intervening) => {
  const PAD = 12;
  const naturalMid = fromXEnd + Math.max((toXStart - fromXEnd) / 2, 12);
  const collides = (cand) => intervening.some((e) => cand >= e.xStart - PAD && cand <= e.xEnd + PAD);
  if (!intervening.length || !collides(naturalMid)) return naturalMid;
  const rightDetour = d3.max(intervening, (e) => e.xEnd) + PAD;
  const leftDetour = d3.min(intervening, (e) => e.xStart) - PAD;
  const leftValid = leftDetour >= fromXEnd - PAD;
  if (leftValid && Math.abs(leftDetour - naturalMid) <= Math.abs(rightDetour - naturalMid)) {
    return leftDetour;
  }
  return rightDetour;
};

g.selectAll(".dependency-arrow")
  .data(edges)
  .join("path")
  .attr("class", "dependency-arrow")
  .attr("d", (d) => {
    const lo = Math.min(d.fromRow, d.toRow);
    const hi = Math.max(d.fromRow, d.toRow);
    const intervening = rowExtent.slice(lo + 1, hi);
    const fromXEnd = rowExtent[d.fromRow].xEnd;
    const toXStart = rowExtent[d.toRow].xStart;
    const trunkX = laneX(fromXEnd, toXStart, intervening);
    const fromY = y(d.fromRow);
    const toY = y(d.toRow);
    return d3.line()([
      [fromXEnd, fromY],
      [trunkX, fromY],
      [trunkX, toY],
      [toXStart - 6, toY],
    ]);
  })
  .attr("fill", "none")
  .attr("stroke", t.inkSoft)
  .attr("stroke-width", 1.5)
  .attr("marker-end", "url(#arrowhead)");

// --- Legend: group colors ------------------------------------------------
const legend = svg.append("g").attr("transform", `translate(${margin.left},${margin.top - 46})`);
let legendX = 0;
GROUPS.forEach((group, i) => {
  const item = legend.append("g").attr("transform", `translate(${legendX},0)`);
  item.append("rect")
    .attr("width", 14)
    .attr("height", 14)
    .attr("rx", 3)
    .attr("fill", t.palette[i % t.palette.length]);
  const label = item.append("text")
    .attr("x", 20)
    .attr("y", 11)
    .style("font-size", "13px")
    .attr("fill", t.inkSoft)
    .text(group.name);
  legendX += 20 + label.node().getComputedTextLength() + 28;
});

// --- Title ------------------------------------------------------------------
svg.append("text")
  .attr("x", width / 2)
  .attr("y", 44)
  .attr("text-anchor", "middle")
  .attr("fill", t.ink)
  .style("font-size", "22px")
  .style("font-weight", "600")
  .text("gantt-dependencies · javascript · d3 · anyplot.ai");
Runnable source as JSON, for any HTTP client: https://api.anyplot.ai/specs/gantt-dependencies/d3/code. Any spec id and library id listed in llms-full.txt fit the same URL shape; every URL below is complete and callable.
{
  "spec_id": "gantt-dependencies",
  "language": "javascript",
  "library": "d3",
  "page": "https://anyplot.ai/gantt-dependencies/javascript/d3",
  "hub": "https://anyplot.ai/gantt-dependencies",
  "code_json": "https://api.anyplot.ai/specs/gantt-dependencies/d3/code",
  "spec_json": "https://api.anyplot.ai/specs/gantt-dependencies",
  "render_light_png": "https://storage.googleapis.com/anyplot-images/plots/gantt-dependencies/javascript/d3/plot-light.png",
  "render_dark_png": "https://storage.googleapis.com/anyplot-images/plots/gantt-dependencies/javascript/d3/plot-dark.png",
  "interactive_light_html": "https://storage.googleapis.com/anyplot-images/plots/gantt-dependencies/javascript/d3/plot-light.html",
  "interactive_dark_html": "https://storage.googleapis.com/anyplot-images/plots/gantt-dependencies/javascript/d3/plot-dark.html",
  "quality_score": 94.0,
  "license": "MIT",
  "guide": "https://anyplot.ai/llms.txt"
}
Part of Gantt Chart with Dependencies on anyplot.ai.