The same plot in 14 other libraries — Python: Altair, Bokeh, lets-plot, Matplotlib, Plotly, plotnine, Pygal, Seaborn; Julia: Makie.jl; JavaScript: Chart.js, D3.js, Apache ECharts, Highcharts, MUI X Charts. Compare all 15 side by side: Gantt Chart with Dependencies in Python, R, Julia and JavaScript.
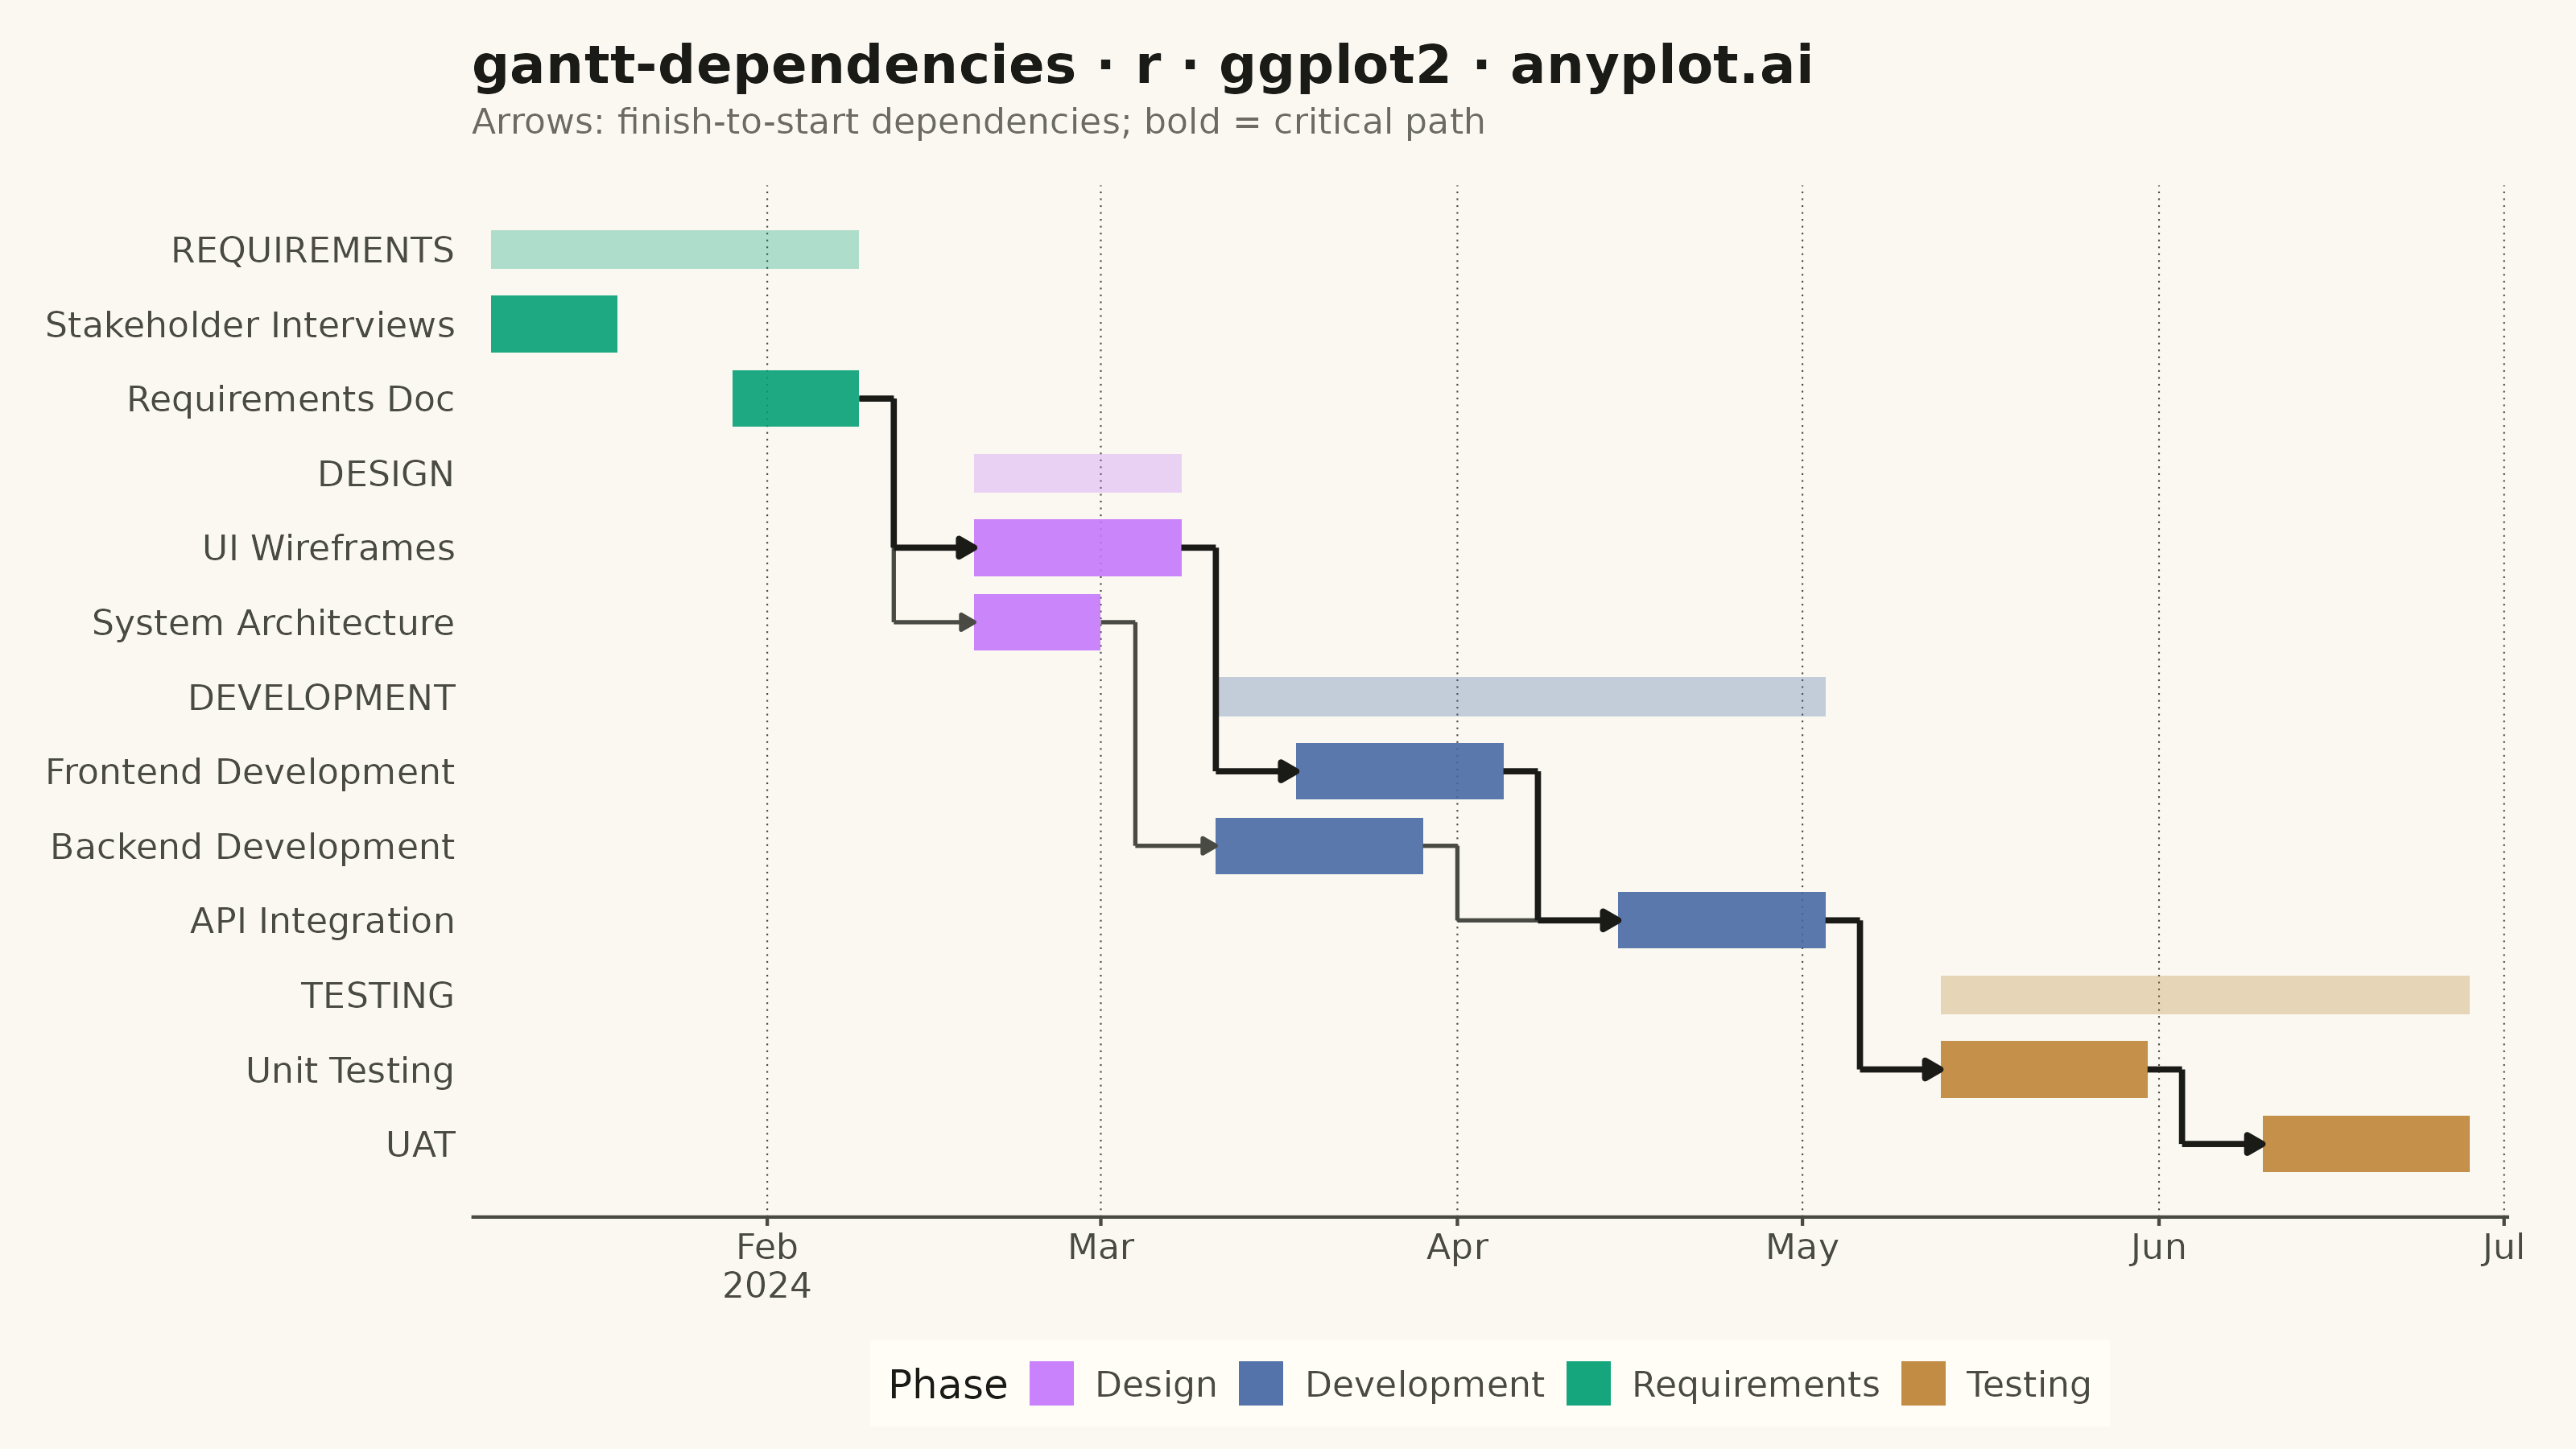
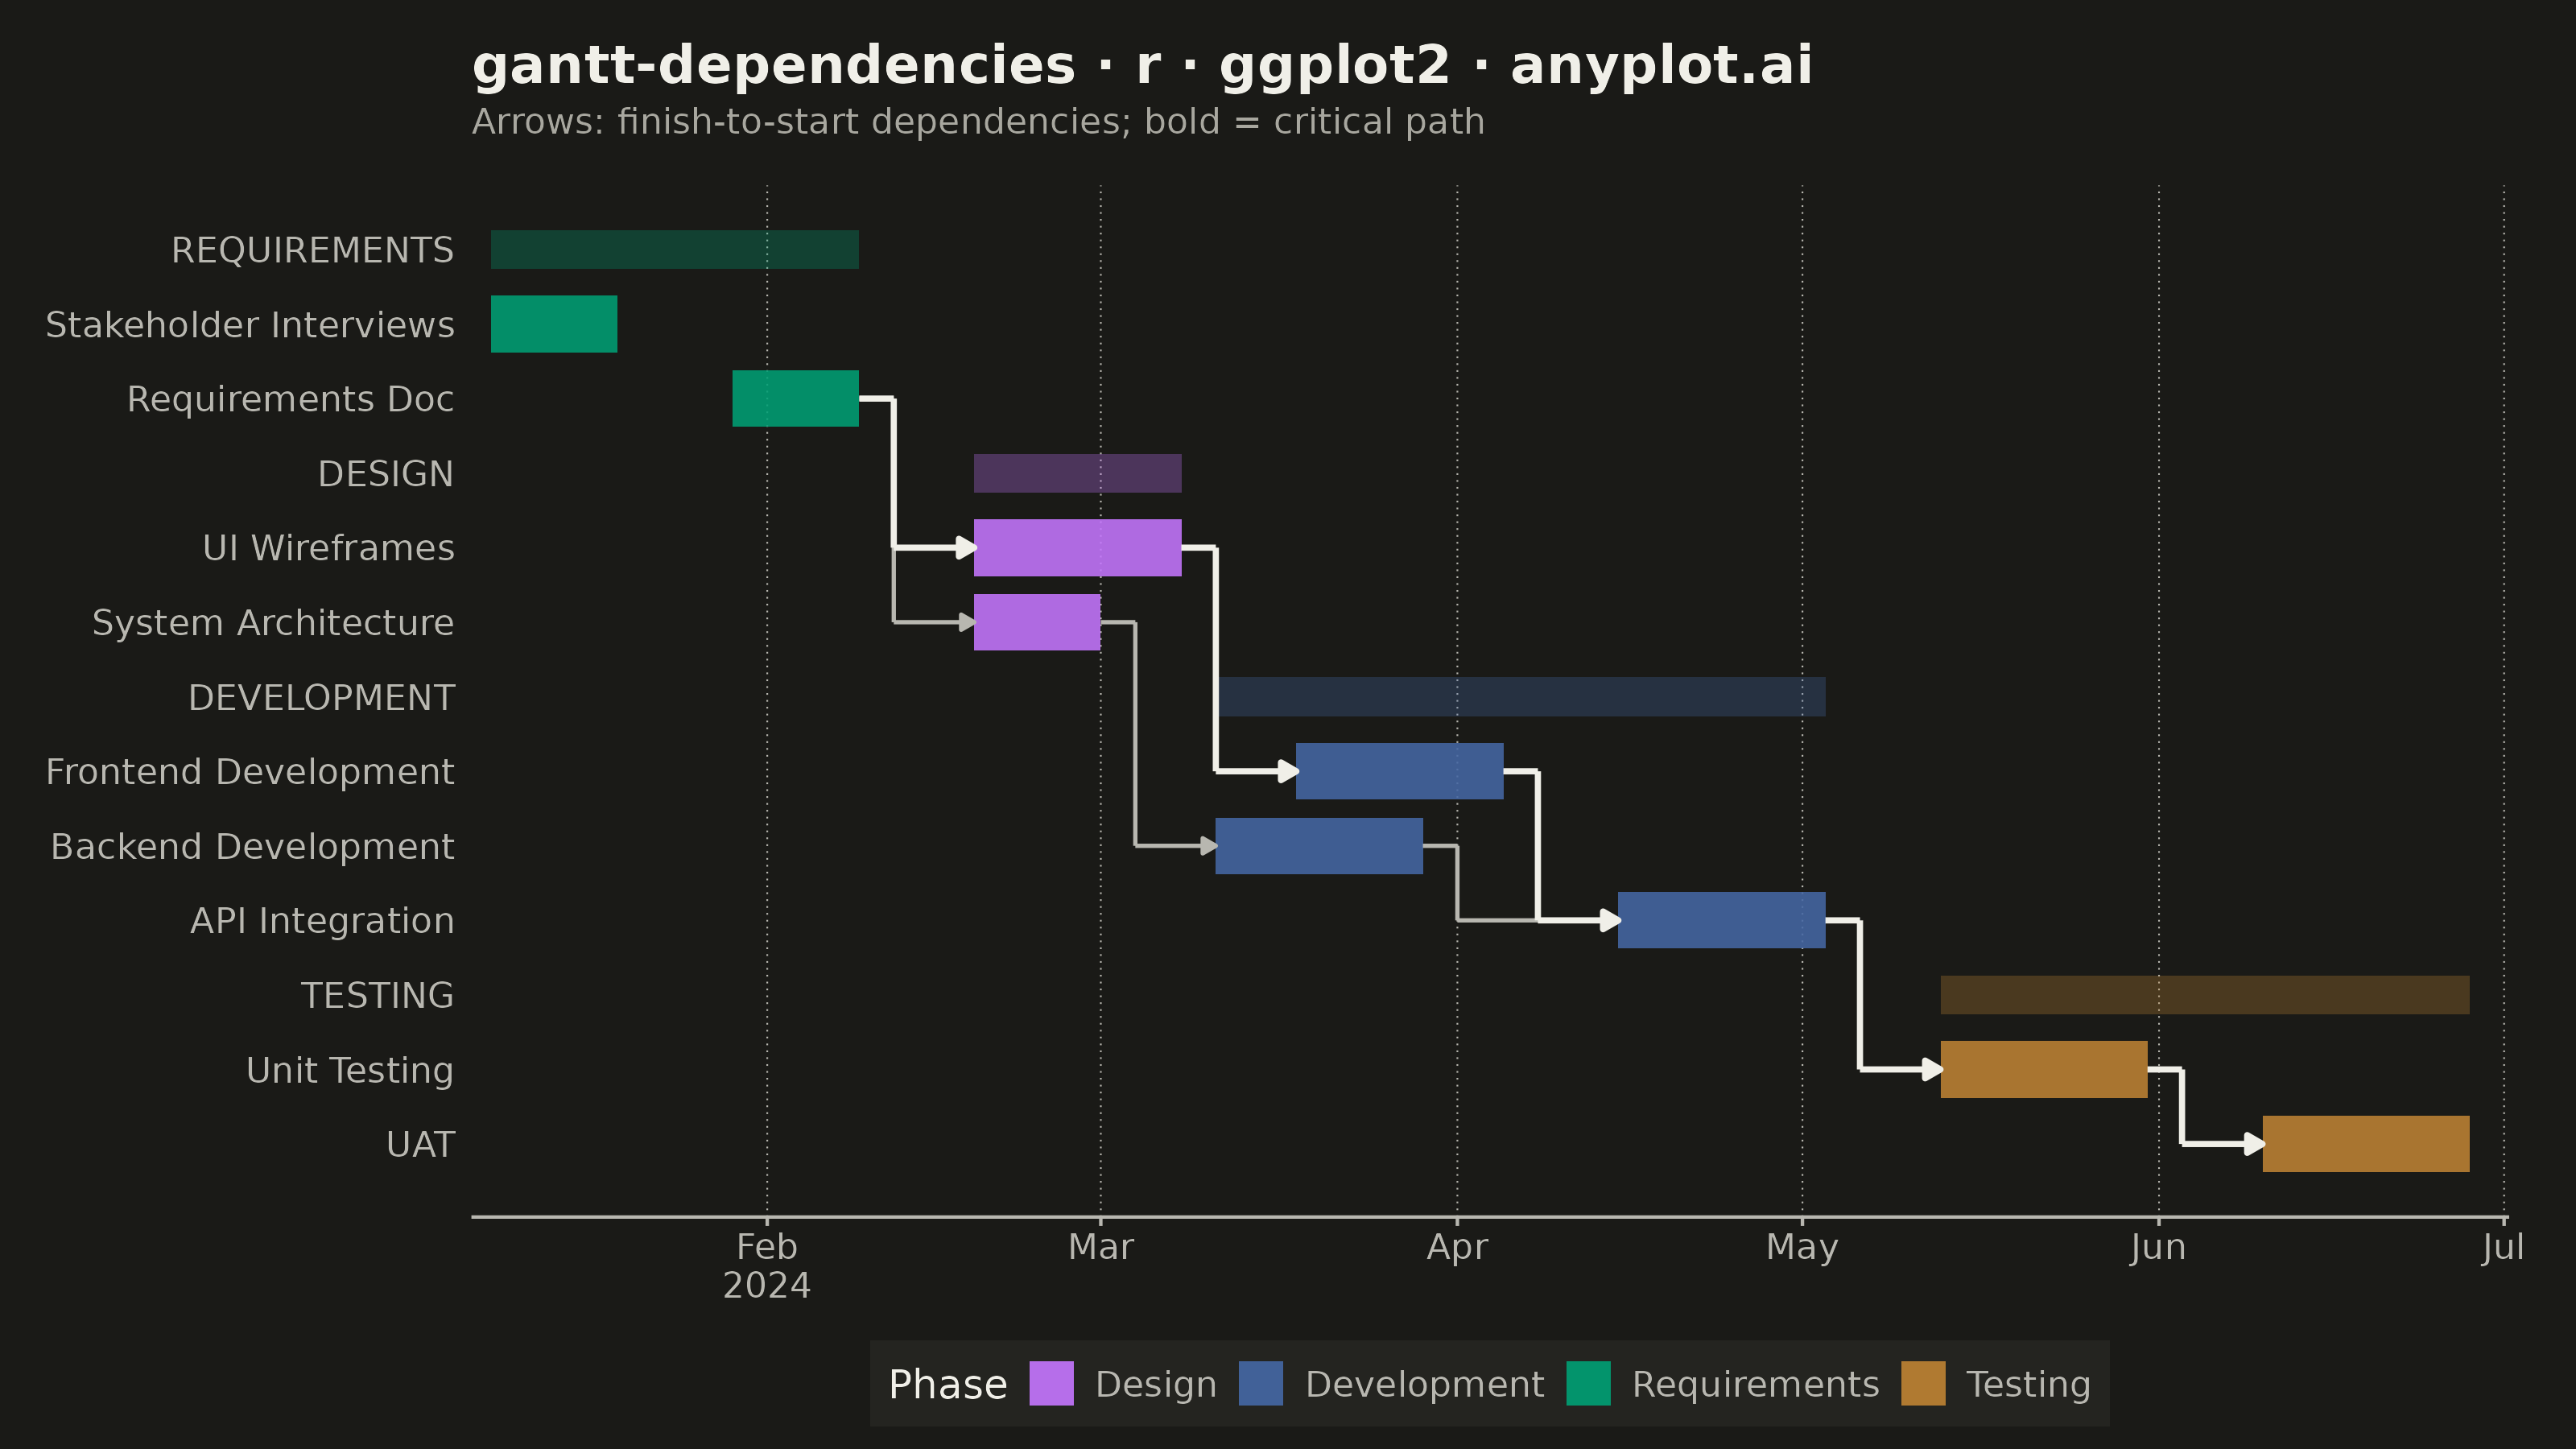
A Gantt chart that visualizes project schedules with task dependencies and groupings. Beyond displaying task timelines, this chart shows relationships between tasks using connector arrows, indicating which tasks must complete before others can begin. Tasks can be organized into groups (phases or work packages) with aggregate timeline bars showing the span of each group. This visualization is essential for understanding critical paths and scheduling constraints in complex projects.
#' anyplot.ai
#' gantt-dependencies: Gantt Chart with Dependencies
#' Library: ggplot2 3.5.1 | R 4.4.1
#' Quality: 88/100 | Created: 2026-06-02

library(ggplot2)
library(ragg)

# --- Theme tokens ---
THEME       <- Sys.getenv("ANYPLOT_THEME", "light")
PAGE_BG     <- if (THEME == "light") "#FAF8F1" else "#1A1A17"
ELEVATED_BG <- if (THEME == "light") "#FFFDF6" else "#242420"
INK         <- if (THEME == "light") "#1A1A17" else "#F0EFE8"
INK_SOFT    <- if (THEME == "light") "#4A4A44" else "#B8B7B0"
INK_MUTED   <- if (THEME == "light") "#6B6A63" else "#A8A79F"

IMPRINT_PALETTE <- c(
  "#009E73", "#C475FD", "#4467A3", "#BD8233",
  "#AE3030", "#2ABCCD", "#954477", "#99B314"
)

PHASE_COLORS <- c(
  "Requirements" = IMPRINT_PALETTE[1],
  "Design"       = IMPRINT_PALETTE[2],
  "Development"  = IMPRINT_PALETTE[3],
  "Testing"      = IMPRINT_PALETTE[4]
)

# --- Data ---
# Software development project: tasks with y positions (top = high y)
tasks <- data.frame(
  task_id = 1:9,
  label   = c("Stakeholder Interviews", "Requirements Doc",
              "UI Wireframes", "System Architecture",
              "Frontend Development", "Backend Development",
              "API Integration", "Unit Testing", "UAT"),
  phase   = c("Requirements", "Requirements",
              "Design", "Design",
              "Development", "Development", "Development",
              "Testing", "Testing"),
  start   = as.Date(c("2024-01-08", "2024-01-29",
                      "2024-02-19", "2024-02-19",
                      "2024-03-18", "2024-03-11",
                      "2024-04-15",
                      "2024-05-13", "2024-06-10")),
  end     = as.Date(c("2024-01-19", "2024-02-09",
                      "2024-03-08", "2024-03-01",
                      "2024-04-05", "2024-03-29",
                      "2024-05-03",
                      "2024-05-31", "2024-06-28")),
  y_pos   = c(12, 11, 9, 8, 6, 5, 4, 2, 1),
  stringsAsFactors = FALSE
)

# Phase aggregate bars (span earliest start to latest end per phase)
phases <- data.frame(
  label = c("Requirements", "Design", "Development", "Testing"),
  phase = c("Requirements", "Design", "Development", "Testing"),
  start = as.Date(c("2024-01-08", "2024-02-19", "2024-03-11", "2024-05-13")),
  end   = as.Date(c("2024-02-09", "2024-03-08", "2024-05-03", "2024-06-28")),
  y_pos = c(13, 10, 7, 3),
  stringsAsFactors = FALSE
)

# Y-axis breaks: all 13 rows (phases uppercase, tasks indented)
all_y_pos <- c(phases$y_pos, tasks$y_pos)
all_y_lab <- c(toupper(phases$label), paste0("  ", tasks$label))
y_ord     <- order(all_y_pos)
all_y_pos <- all_y_pos[y_ord]
all_y_lab <- all_y_lab[y_ord]

# Dependencies: finish-to-start (from task_id -> to task_id)
dep_from <- c(2, 2, 3, 4, 5, 6, 7, 8)
dep_to   <- c(3, 4, 5, 6, 7, 7, 8, 9)
# Critical path: Requirements Doc -> UI Wireframes -> Frontend -> API -> Unit Testing -> UAT
is_critical <- c(TRUE, FALSE, TRUE, FALSE, TRUE, FALSE, TRUE, TRUE)

# Build 3-segment L-shaped dependency arrows
offset_days <- 3
seg1_list <- vector("list", length(dep_from))
seg2_list <- vector("list", length(dep_from))
seg3_list <- vector("list", length(dep_from))

for (i in seq_along(dep_from)) {
  from_row <- tasks[tasks$task_id == dep_from[i], ]
  to_row   <- tasks[tasks$task_id == dep_to[i], ]
  x1 <- from_row$end
  y1 <- from_row$y_pos
  x2 <- to_row$start
  y2 <- to_row$y_pos
  mx <- x1 + offset_days
  crit <- is_critical[i]
  seg1_list[[i]] <- data.frame(x = x1, xend = mx, y = y1, yend = y1, critical = crit)
  seg2_list[[i]] <- data.frame(x = mx, xend = mx, y = y1, yend = y2, critical = crit)
  seg3_list[[i]] <- data.frame(x = mx, xend = x2, y = y2, yend = y2, critical = crit)
}

seg1_df <- do.call(rbind, seg1_list)
seg2_df <- do.call(rbind, seg2_list)
seg3_df <- do.call(rbind, seg3_list)

seg1_crit  <- seg1_df[seg1_df$critical, ]
seg1_ncrit <- seg1_df[!seg1_df$critical, ]
seg2_crit  <- seg2_df[seg2_df$critical, ]
seg2_ncrit <- seg2_df[!seg2_df$critical, ]
seg3_crit  <- seg3_df[seg3_df$critical, ]
seg3_ncrit <- seg3_df[!seg3_df$critical, ]

# --- Plot ---
p <- ggplot() +

  # Phase summary bars (wide, transparent — show aggregate phase duration)
  geom_rect(
    data = phases,
    aes(xmin = start, xmax = end,
        ymin = y_pos - 0.26, ymax = y_pos + 0.26,
        fill = phase),
    alpha = 0.3
  ) +

  # Individual task bars
  geom_rect(
    data = tasks,
    aes(xmin = start, xmax = end,
        ymin = y_pos - 0.38, ymax = y_pos + 0.38,
        fill = phase),
    alpha = 0.88
  ) +

  # Non-critical dependency connectors (subdued)
  geom_segment(
    data = seg1_ncrit,
    aes(x = x, xend = xend, y = y, yend = yend),
    color = INK_SOFT, linewidth = 0.45
  ) +
  geom_segment(
    data = seg2_ncrit,
    aes(x = x, xend = xend, y = y, yend = yend),
    color = INK_SOFT, linewidth = 0.45
  ) +
  geom_segment(
    data = seg3_ncrit,
    aes(x = x, xend = xend, y = y, yend = yend),
    color = INK_SOFT, linewidth = 0.45,
    arrow = arrow(length = unit(0.12, "cm"), type = "closed")
  ) +

  # Critical-path dependency connectors (emphasized)
  geom_segment(
    data = seg1_crit,
    aes(x = x, xend = xend, y = y, yend = yend),
    color = INK, linewidth = 0.65
  ) +
  geom_segment(
    data = seg2_crit,
    aes(x = x, xend = xend, y = y, yend = yend),
    color = INK, linewidth = 0.65
  ) +
  geom_segment(
    data = seg3_crit,
    aes(x = x, xend = xend, y = y, yend = yend),
    color = INK, linewidth = 0.65,
    arrow = arrow(length = unit(0.14, "cm"), type = "closed")
  ) +

  scale_fill_manual(values = PHASE_COLORS, name = "Phase") +
  scale_x_date(
    date_breaks = "1 month",
    labels      = scales::label_date_short(),
    expand      = expansion(mult = c(0.01, 0.02))
  ) +
  scale_y_continuous(
    breaks = all_y_pos,
    labels = all_y_lab,
    expand = expansion(add = c(0.6, 0.6))
  ) +
  labs(
    title    = "gantt-dependencies · r · ggplot2 · anyplot.ai",
    subtitle = "Arrows: finish-to-start dependencies; bold = critical path",
    x        = NULL,
    y        = NULL
  ) +
  theme_minimal(base_size = 8) +
  theme(
    plot.background    = element_rect(fill = PAGE_BG, color = PAGE_BG),
    panel.background   = element_rect(fill = PAGE_BG, color = NA),
    panel.grid.major.x = element_line(color = INK_SOFT, linewidth = 0.18,
                                      linetype = "dotted"),
    panel.grid.major.y = element_blank(),
    panel.grid.minor   = element_blank(),
    axis.text.x        = element_text(color = INK_SOFT, size = 8),
    axis.text.y        = element_text(color = INK_SOFT, size = 8, hjust = 1),
    axis.ticks.x       = element_line(color = INK_SOFT),
    axis.ticks.y       = element_blank(),
    axis.line.x        = element_line(color = INK_SOFT),
    plot.title         = element_text(color = INK, size = 12, face = "bold",
                                      margin = margin(b = 3)),
    plot.subtitle      = element_text(color = INK_MUTED, size = 8,
                                      margin = margin(b = 10)),
    legend.background  = element_rect(fill = ELEVATED_BG, color = NA),
    legend.text        = element_text(color = INK_SOFT, size = 8),
    legend.title       = element_text(color = INK, size = 9),
    legend.position    = "bottom",
    legend.direction   = "horizontal",
    legend.key.size    = unit(0.4, "cm"),
    plot.margin        = margin(t = 10, r = 15, b = 5, l = 5)
  )

# --- Save ---
ggsave(
  filename = sprintf("plot-%s.png", THEME),
  plot     = p,
  device   = ragg::agg_png,
  width    = 8,
  height   = 4.5,
  units    = "in",
  dpi      = 400
)
Runnable source as JSON, for any HTTP client: https://api.anyplot.ai/specs/gantt-dependencies/ggplot2/code. Any spec id and library id listed in llms-full.txt fit the same URL shape; every URL below is complete and callable.
{
  "spec_id": "gantt-dependencies",
  "language": "r",
  "library": "ggplot2",
  "page": "https://anyplot.ai/gantt-dependencies/r/ggplot2",
  "hub": "https://anyplot.ai/gantt-dependencies",
  "code_json": "https://api.anyplot.ai/specs/gantt-dependencies/ggplot2/code",
  "spec_json": "https://api.anyplot.ai/specs/gantt-dependencies",
  "render_light_png": "https://storage.googleapis.com/anyplot-images/plots/gantt-dependencies/r/ggplot2/plot-light.png",
  "render_dark_png": "https://storage.googleapis.com/anyplot-images/plots/gantt-dependencies/r/ggplot2/plot-dark.png",
  "quality_score": 88.0,
  "license": "MIT",
  "guide": "https://anyplot.ai/llms.txt"
}
Part of Gantt Chart with Dependencies on anyplot.ai.