The same plot in 14 other libraries — JavaScript: Chart.js, D3.js, Apache ECharts, MUI X Charts; Python: Altair, Bokeh, lets-plot, Matplotlib, Plotly, plotnine, Pygal, Seaborn; R: ggplot2; Julia: Makie.jl. Compare all 15 side by side: Gantt Chart with Dependencies in Python, R, Julia and JavaScript.
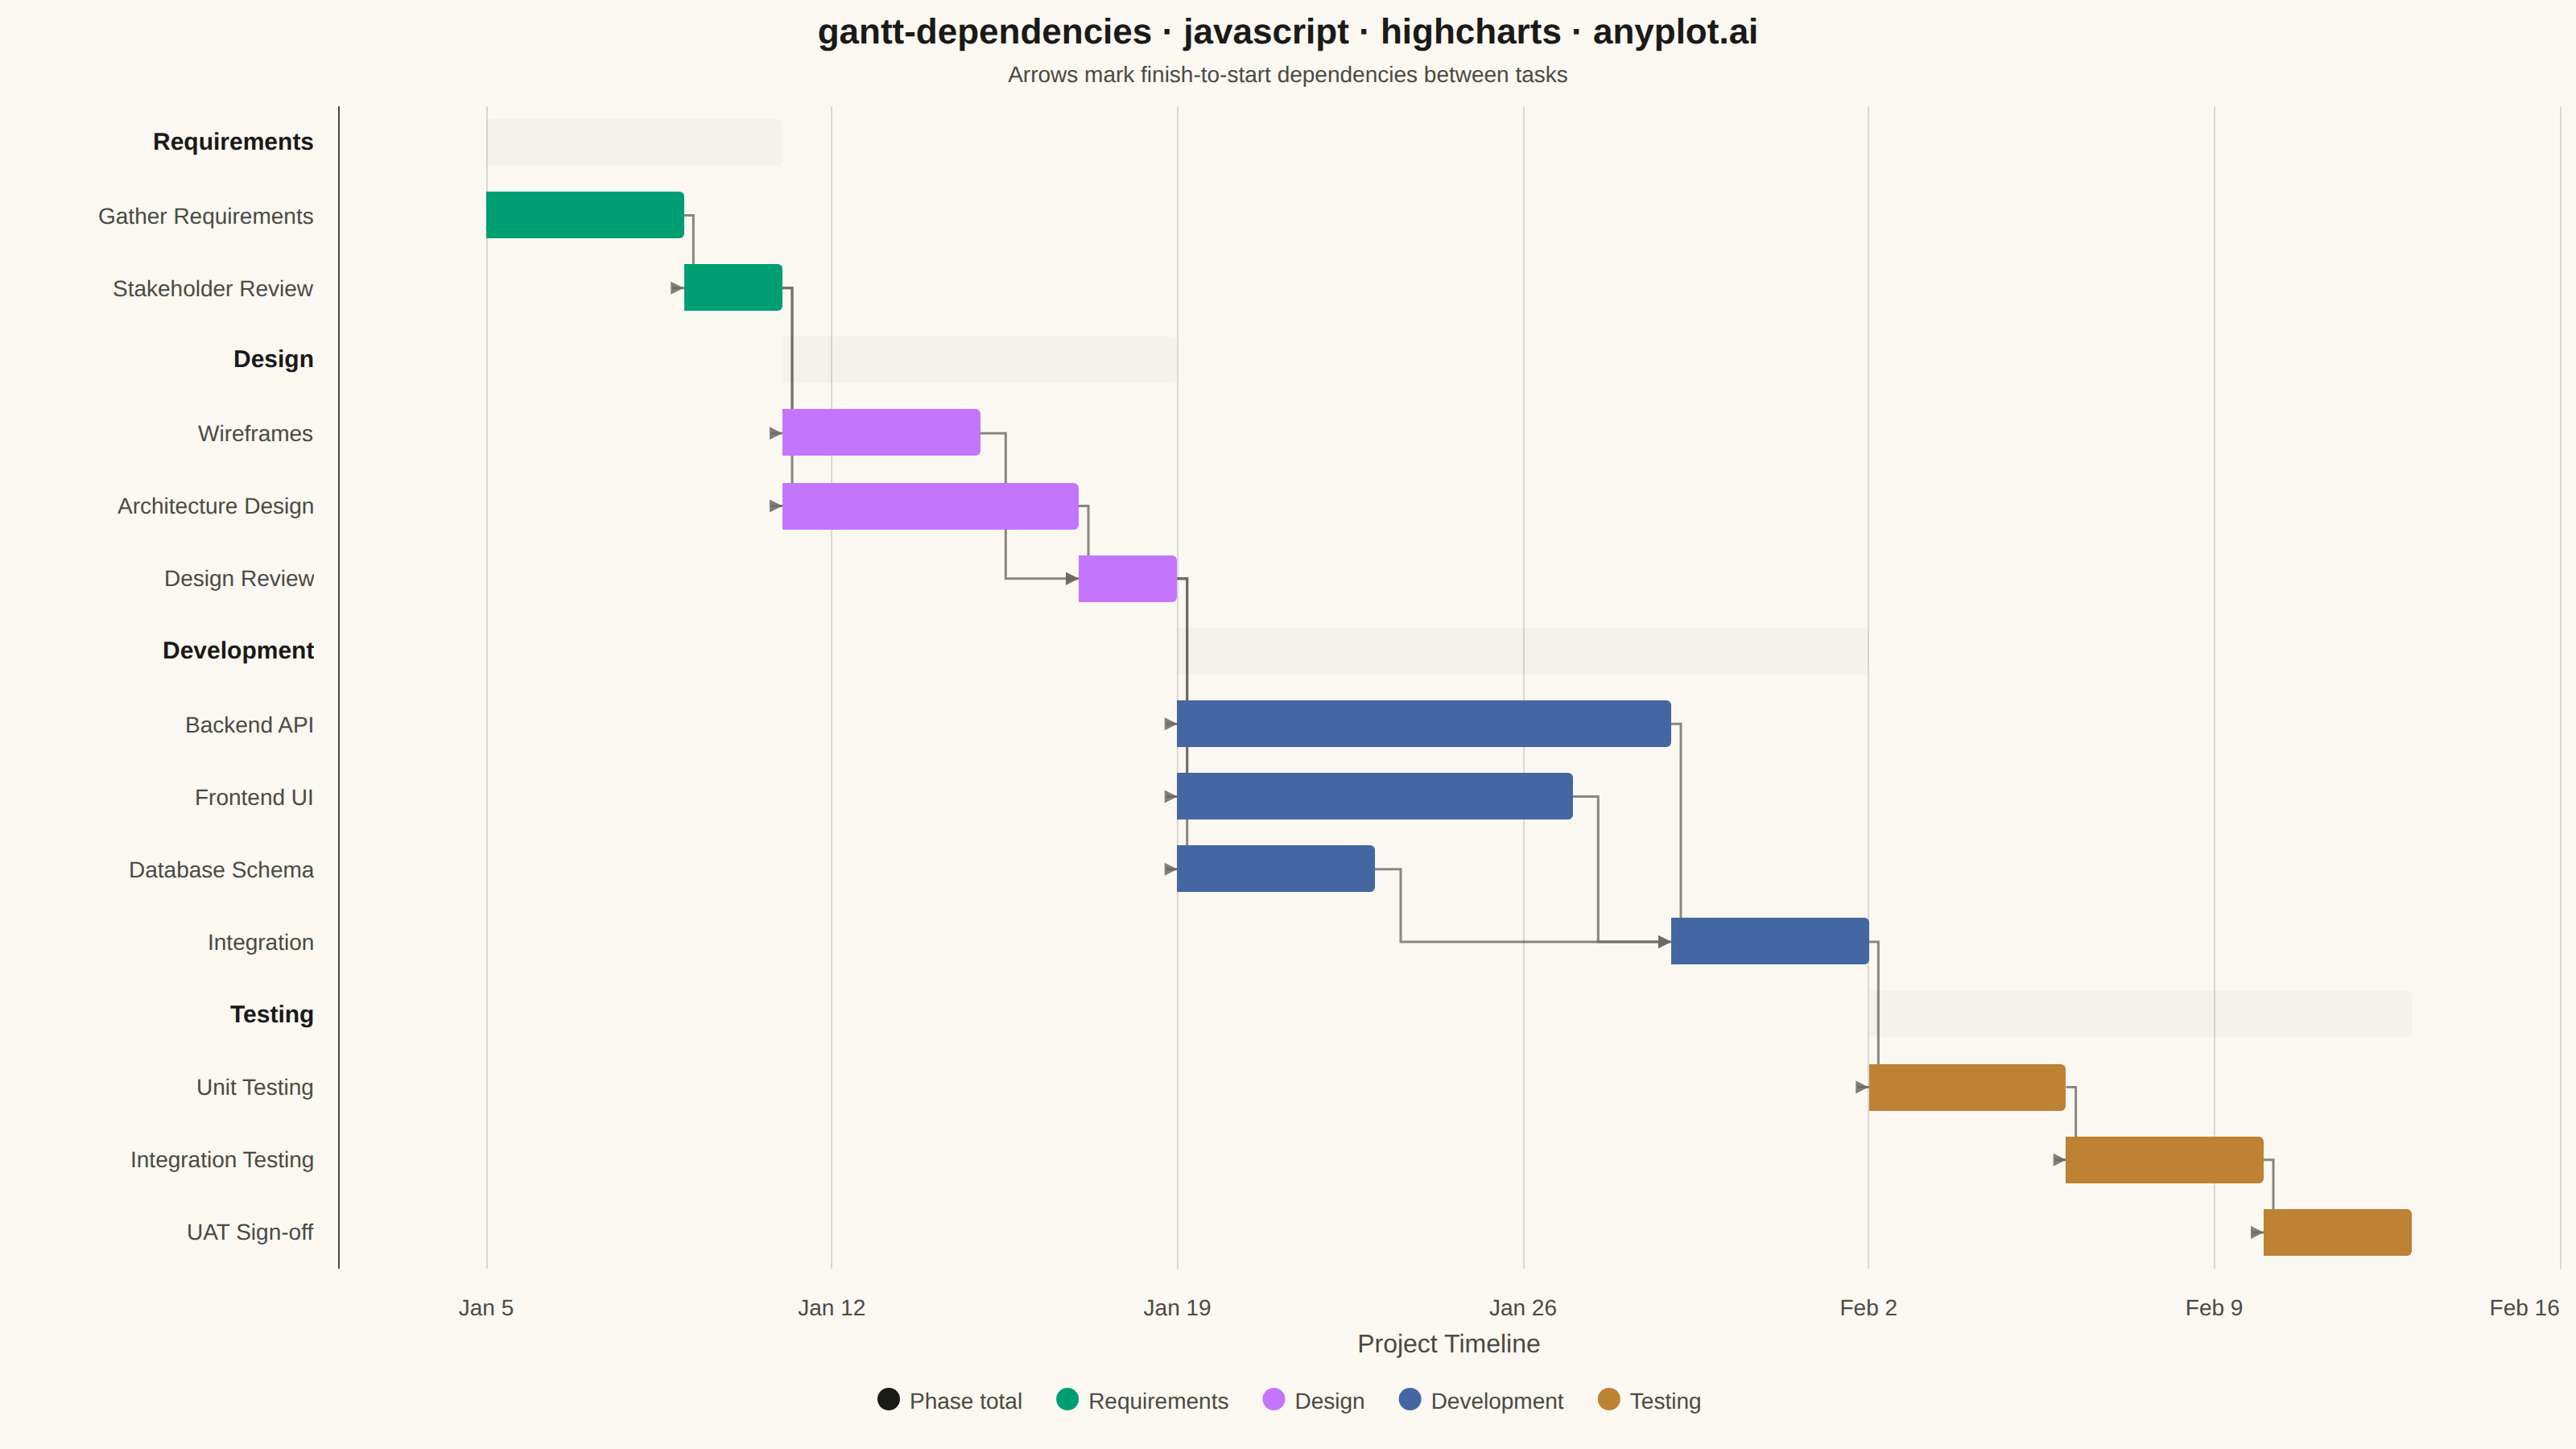
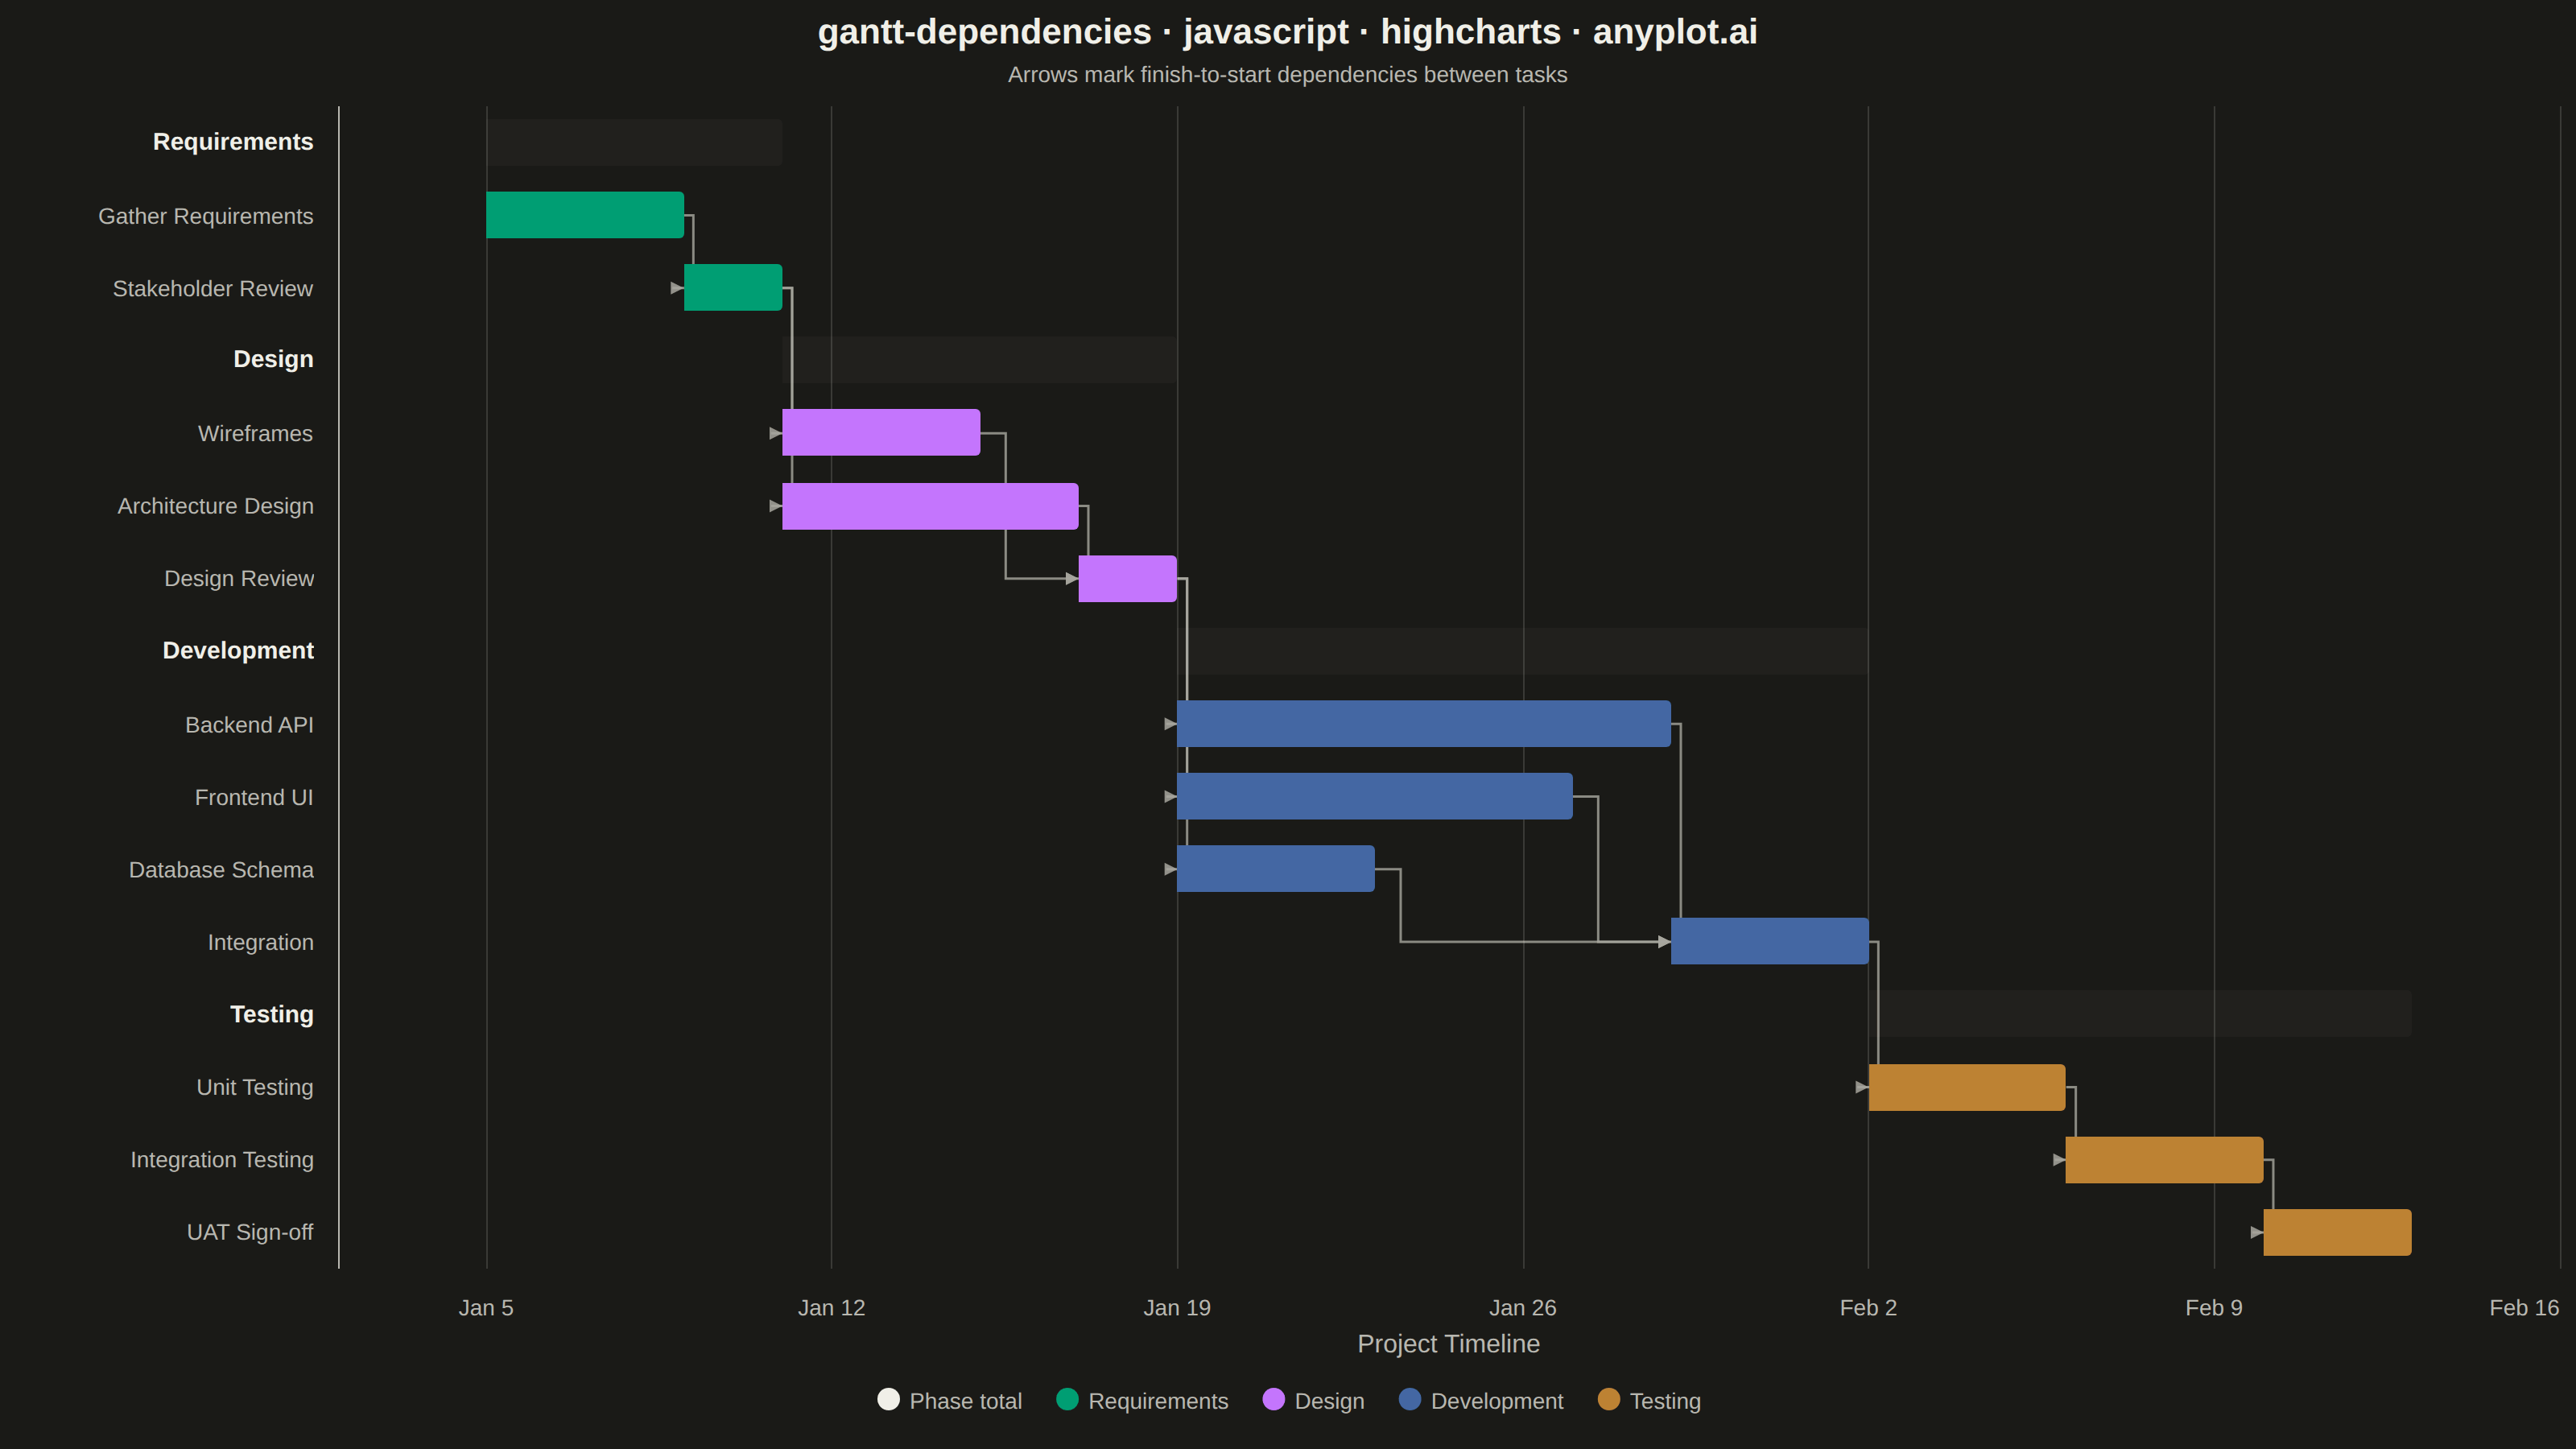
A Gantt chart that visualizes project schedules with task dependencies and groupings. Beyond displaying task timelines, this chart shows relationships between tasks using connector arrows, indicating which tasks must complete before others can begin. Tasks can be organized into groups (phases or work packages) with aggregate timeline bars showing the span of each group. This visualization is essential for understanding critical paths and scheduling constraints in complex projects.
// anyplot.ai
// gantt-dependencies: Gantt Chart with Dependencies
// Library: highcharts 12.6.0 | JavaScript 22.23.2
// Quality: 90/100 | Created: 2026-08-24

const t = window.ANYPLOT_TOKENS;
const MUTED = window.ANYPLOT_THEME === "light" ? "#6B6A63" : "#A8A79F";

// --- Data: a 4-phase software project, 12 tasks with finish-to-start deps --
const PROJECT_START = Date.UTC(2026, 0, 5); // Mon, Jan 5 2026
const DAY = 86400000;
const dateAt = (day) => PROJECT_START + day * DAY;

const TASKS = [
  { id: "reqs", task: "Gather Requirements", group: "Requirements", start: 0, end: 4, dependsOn: [] },
  { id: "stake", task: "Stakeholder Review", group: "Requirements", start: 4, end: 6, dependsOn: ["reqs"] },
  { id: "wire", task: "Wireframes", group: "Design", start: 6, end: 10, dependsOn: ["stake"] },
  { id: "arch", task: "Architecture Design", group: "Design", start: 6, end: 12, dependsOn: ["stake"] },
  { id: "dreview", task: "Design Review", group: "Design", start: 12, end: 14, dependsOn: ["wire", "arch"] },
  { id: "backend", task: "Backend API", group: "Development", start: 14, end: 24, dependsOn: ["dreview"] },
  { id: "frontend", task: "Frontend UI", group: "Development", start: 14, end: 22, dependsOn: ["dreview"] },
  { id: "schema", task: "Database Schema", group: "Development", start: 14, end: 18, dependsOn: ["dreview"] },
  { id: "integ", task: "Integration", group: "Development", start: 24, end: 28, dependsOn: ["backend", "frontend", "schema"] },
  { id: "unit", task: "Unit Testing", group: "Testing", start: 28, end: 32, dependsOn: ["integ"] },
  { id: "systest", task: "Integration Testing", group: "Testing", start: 32, end: 36, dependsOn: ["unit"] },
  { id: "uat", task: "UAT Sign-off", group: "Testing", start: 36, end: 39, dependsOn: ["systest"] },
];

const GROUP_ORDER = [...new Set(TASKS.map((task) => task.group))];
const GROUP_COLOR = Object.fromEntries(GROUP_ORDER.map((group, i) => [group, t.palette[i]]));

// Display rows: an aggregate header per group followed by its own tasks, so
// groups always sit above their children (spec's hierarchy requirement).
const ROWS = [];
GROUP_ORDER.forEach((group) => {
  const groupTasks = TASKS.filter((task) => task.group === group);
  ROWS.push({
    type: "group",
    label: group,
    start: Math.min(...groupTasks.map((task) => task.start)),
    end: Math.max(...groupTasks.map((task) => task.end)),
  });
  groupTasks.forEach((task) => {
    ROWS.push({ type: "task", label: task.task, id: task.id, start: task.start, end: task.end, group });
  });
});

const categories = ROWS.map((row) => row.label);
const rowIndexById = Object.fromEntries(ROWS.map((row, i) => [row.id, i]).filter(([id]) => id !== undefined));

// Dependency arrows connect a predecessor's end (right edge) to its
// successor's start (left edge) — finish-to-start, the only relation used.
const DEPENDENCIES = TASKS.flatMap((task) =>
  task.dependsOn.map((depId) => {
    const predecessor = TASKS.find((candidate) => candidate.id === depId);
    return {
      fromRow: rowIndexById[depId],
      toRow: rowIndexById[task.id],
      fromDay: predecessor.end,
      toDay: task.start,
    };
  })
);

// --- Stacked "floating bar" technique ---------------------------------------
// The core bundle has no xrange/gantt series, so every row is built as a
// stacked bar: an invisible "offset" series pushes the bar to its start day,
// and a visible duration series draws the actual span on top of it. Stacking
// in small day-offset integers (not raw epoch-ms timestamps) keeps every
// series in the stack the same order of magnitude — mixing a ~1.7e12 offset
// with a ~1e8 duration on the same stack corrupts Highcharts' internal
// stack geometry. The axis stays a plain linear day count; labels/tooltips
// convert back to real dates via dateAt() + Highcharts.dateFormat.
const offsetData = ROWS.map((row) => row.start);
const phaseTotalData = ROWS.map((row) =>
  row.type === "group" ? { y: row.end - row.start, start: dateAt(row.start), end: dateAt(row.end) } : null
);
const taskSeriesByGroup = GROUP_ORDER.map((group) => ({
  name: group,
  color: GROUP_COLOR[group],
  data: ROWS.map((row) =>
    row.type === "task" && row.group === group
      ? { y: row.end - row.start, start: dateAt(row.start), end: dateAt(row.end) }
      : null
  ),
}));

const lastEndDay = Math.max(...TASKS.map((task) => task.end));

// Reusable rightward arrowhead — every dependency flows left to right in time.
Highcharts.SVGRenderer.prototype.symbols.ganttArrow = (x, y, w, h) => [
  "M", x, y,
  "L", x + w, y + h / 2,
  "L", x, y + h,
  "Z",
];

Highcharts.chart("container", {
  chart: {
    type: "bar",
    backgroundColor: "transparent",
    animation: false,
    marginLeft: 210,
    style: { fontFamily: "inherit" },
    events: {
      // The core bundle has no annotations module either, so dependency
      // arrows are drawn as native SVG paths through chart.renderer — each
      // predecessor→successor pair converted from data to screen space via
      // toPixels() on every render pass, exactly like the quiver-basic
      // vector-field technique.
      render() {
        if (this.depGroup) this.depGroup.destroy();
        this.depGroup = this.renderer.g("dependencies").add();
        const rowAxis = this.xAxis[0];
        const timeAxis = this.yAxis[0];

        DEPENDENCIES.forEach(({ fromRow, toRow, fromDay, toDay }) => {
          const y1 = rowAxis.toPixels(fromRow, false);
          const y2 = rowAxis.toPixels(toRow, false);
          const x1 = timeAxis.toPixels(fromDay, false);
          const x2 = timeAxis.toPixels(toDay, false);
          const jog = Math.max(6, Math.min(16, (x2 - x1) / 2));
          const midX = x1 + jog;

          this.renderer
            .path(["M", x1, y1, "L", midX, y1, "L", midX, y2, "L", x2 - 7, y2])
            .attr({ stroke: MUTED, "stroke-width": 1.5, fill: "none", opacity: 0.8, zIndex: 6 })
            .add(this.depGroup);
          this.renderer
            .symbol("ganttArrow", x2 - 8, y2 - 4, 8, 8)
            .attr({ fill: MUTED, opacity: 0.85, zIndex: 6 })
            .add(this.depGroup);
        });
      },
    },
  },
  credits: { enabled: false },
  colors: t.palette,
  title: {
    text: "gantt-dependencies · javascript · highcharts · anyplot.ai",
    style: { color: t.ink, fontSize: "22px", fontWeight: "600" },
  },
  subtitle: {
    text: "Arrows mark finish-to-start dependencies between tasks",
    style: { color: t.inkSoft, fontSize: "14px" },
  },
  xAxis: {
    categories,
    reversed: true,
    lineColor: t.inkSoft,
    tickColor: t.inkSoft,
    gridLineWidth: 0,
    labels: {
      useHTML: true,
      style: { fontSize: "14px" },
      formatter() {
        const row = ROWS[this.pos];
        return row.type === "group"
          ? `<span style="color:${t.ink};font-weight:700;font-size:15px">${row.label}</span>`
          : `<span style="display:inline-block;padding-left:18px;color:${t.inkSoft}">${row.label}</span>`;
      },
    },
  },
  yAxis: {
    min: -3,
    max: lastEndDay + 3,
    startOnTick: false,
    endOnTick: false,
    // Highcharts defaults reversedStacks:true, which (combined with an
    // inverted "bar" chart) silently anchors every stacked series back to 0
    // instead of the previous series' cumulative — breaking the invisible
    // offset + visible duration floating-bar technique used here.
    reversedStacks: false,
    tickInterval: 7,
    title: { text: "Project Timeline", style: { color: t.inkSoft, fontSize: "16px" } },
    lineColor: t.inkSoft,
    tickColor: t.inkSoft,
    gridLineColor: t.grid,
    labels: {
      style: { color: t.inkSoft, fontSize: "14px" },
      formatter() {
        return Highcharts.dateFormat("%b %e", dateAt(this.value));
      },
    },
  },
  legend: {
    itemStyle: { color: t.inkSoft, fontSize: "14px" },
    itemHoverStyle: { color: t.ink },
  },
  tooltip: {
    backgroundColor: t.elevatedBg,
    borderColor: t.grid,
    style: { color: t.ink, fontSize: "13px" },
    formatter() {
      const point = this.point;
      if (point.start === undefined) return false;
      const fmt = (ms) => Highcharts.dateFormat("%b %e, %Y", ms);
      return `<b>${this.x}</b><br/>${fmt(point.start)} – ${fmt(point.end)}`;
    },
  },
  plotOptions: {
    series: { animation: false },
    bar: { stacking: "normal", pointPadding: 0.08, groupPadding: 0.12, borderWidth: 0 },
  },
  series: [
    {
      name: "offset",
      data: offsetData,
      color: "transparent",
      enableMouseTracking: false,
      showInLegend: false,
    },
    {
      name: "Phase total",
      data: phaseTotalData,
      color: t.ink,
      opacity: 0.16,
    },
    ...taskSeriesByGroup,
  ],
});
Runnable source as JSON, for any HTTP client: https://api.anyplot.ai/specs/gantt-dependencies/highcharts/code. Any spec id and library id listed in llms-full.txt fit the same URL shape; every URL below is complete and callable.
{
  "spec_id": "gantt-dependencies",
  "language": "javascript",
  "library": "highcharts",
  "page": "https://anyplot.ai/gantt-dependencies/javascript/highcharts",
  "hub": "https://anyplot.ai/gantt-dependencies",
  "code_json": "https://api.anyplot.ai/specs/gantt-dependencies/highcharts/code",
  "spec_json": "https://api.anyplot.ai/specs/gantt-dependencies",
  "render_light_png": "https://storage.googleapis.com/anyplot-images/plots/gantt-dependencies/javascript/highcharts/plot-light.png",
  "render_dark_png": "https://storage.googleapis.com/anyplot-images/plots/gantt-dependencies/javascript/highcharts/plot-dark.png",
  "interactive_light_html": "https://storage.googleapis.com/anyplot-images/plots/gantt-dependencies/javascript/highcharts/plot-light.html",
  "interactive_dark_html": "https://storage.googleapis.com/anyplot-images/plots/gantt-dependencies/javascript/highcharts/plot-dark.html",
  "quality_score": 90.0,
  "license": "MIT",
  "guide": "https://anyplot.ai/llms.txt"
}
Part of Gantt Chart with Dependencies on anyplot.ai.