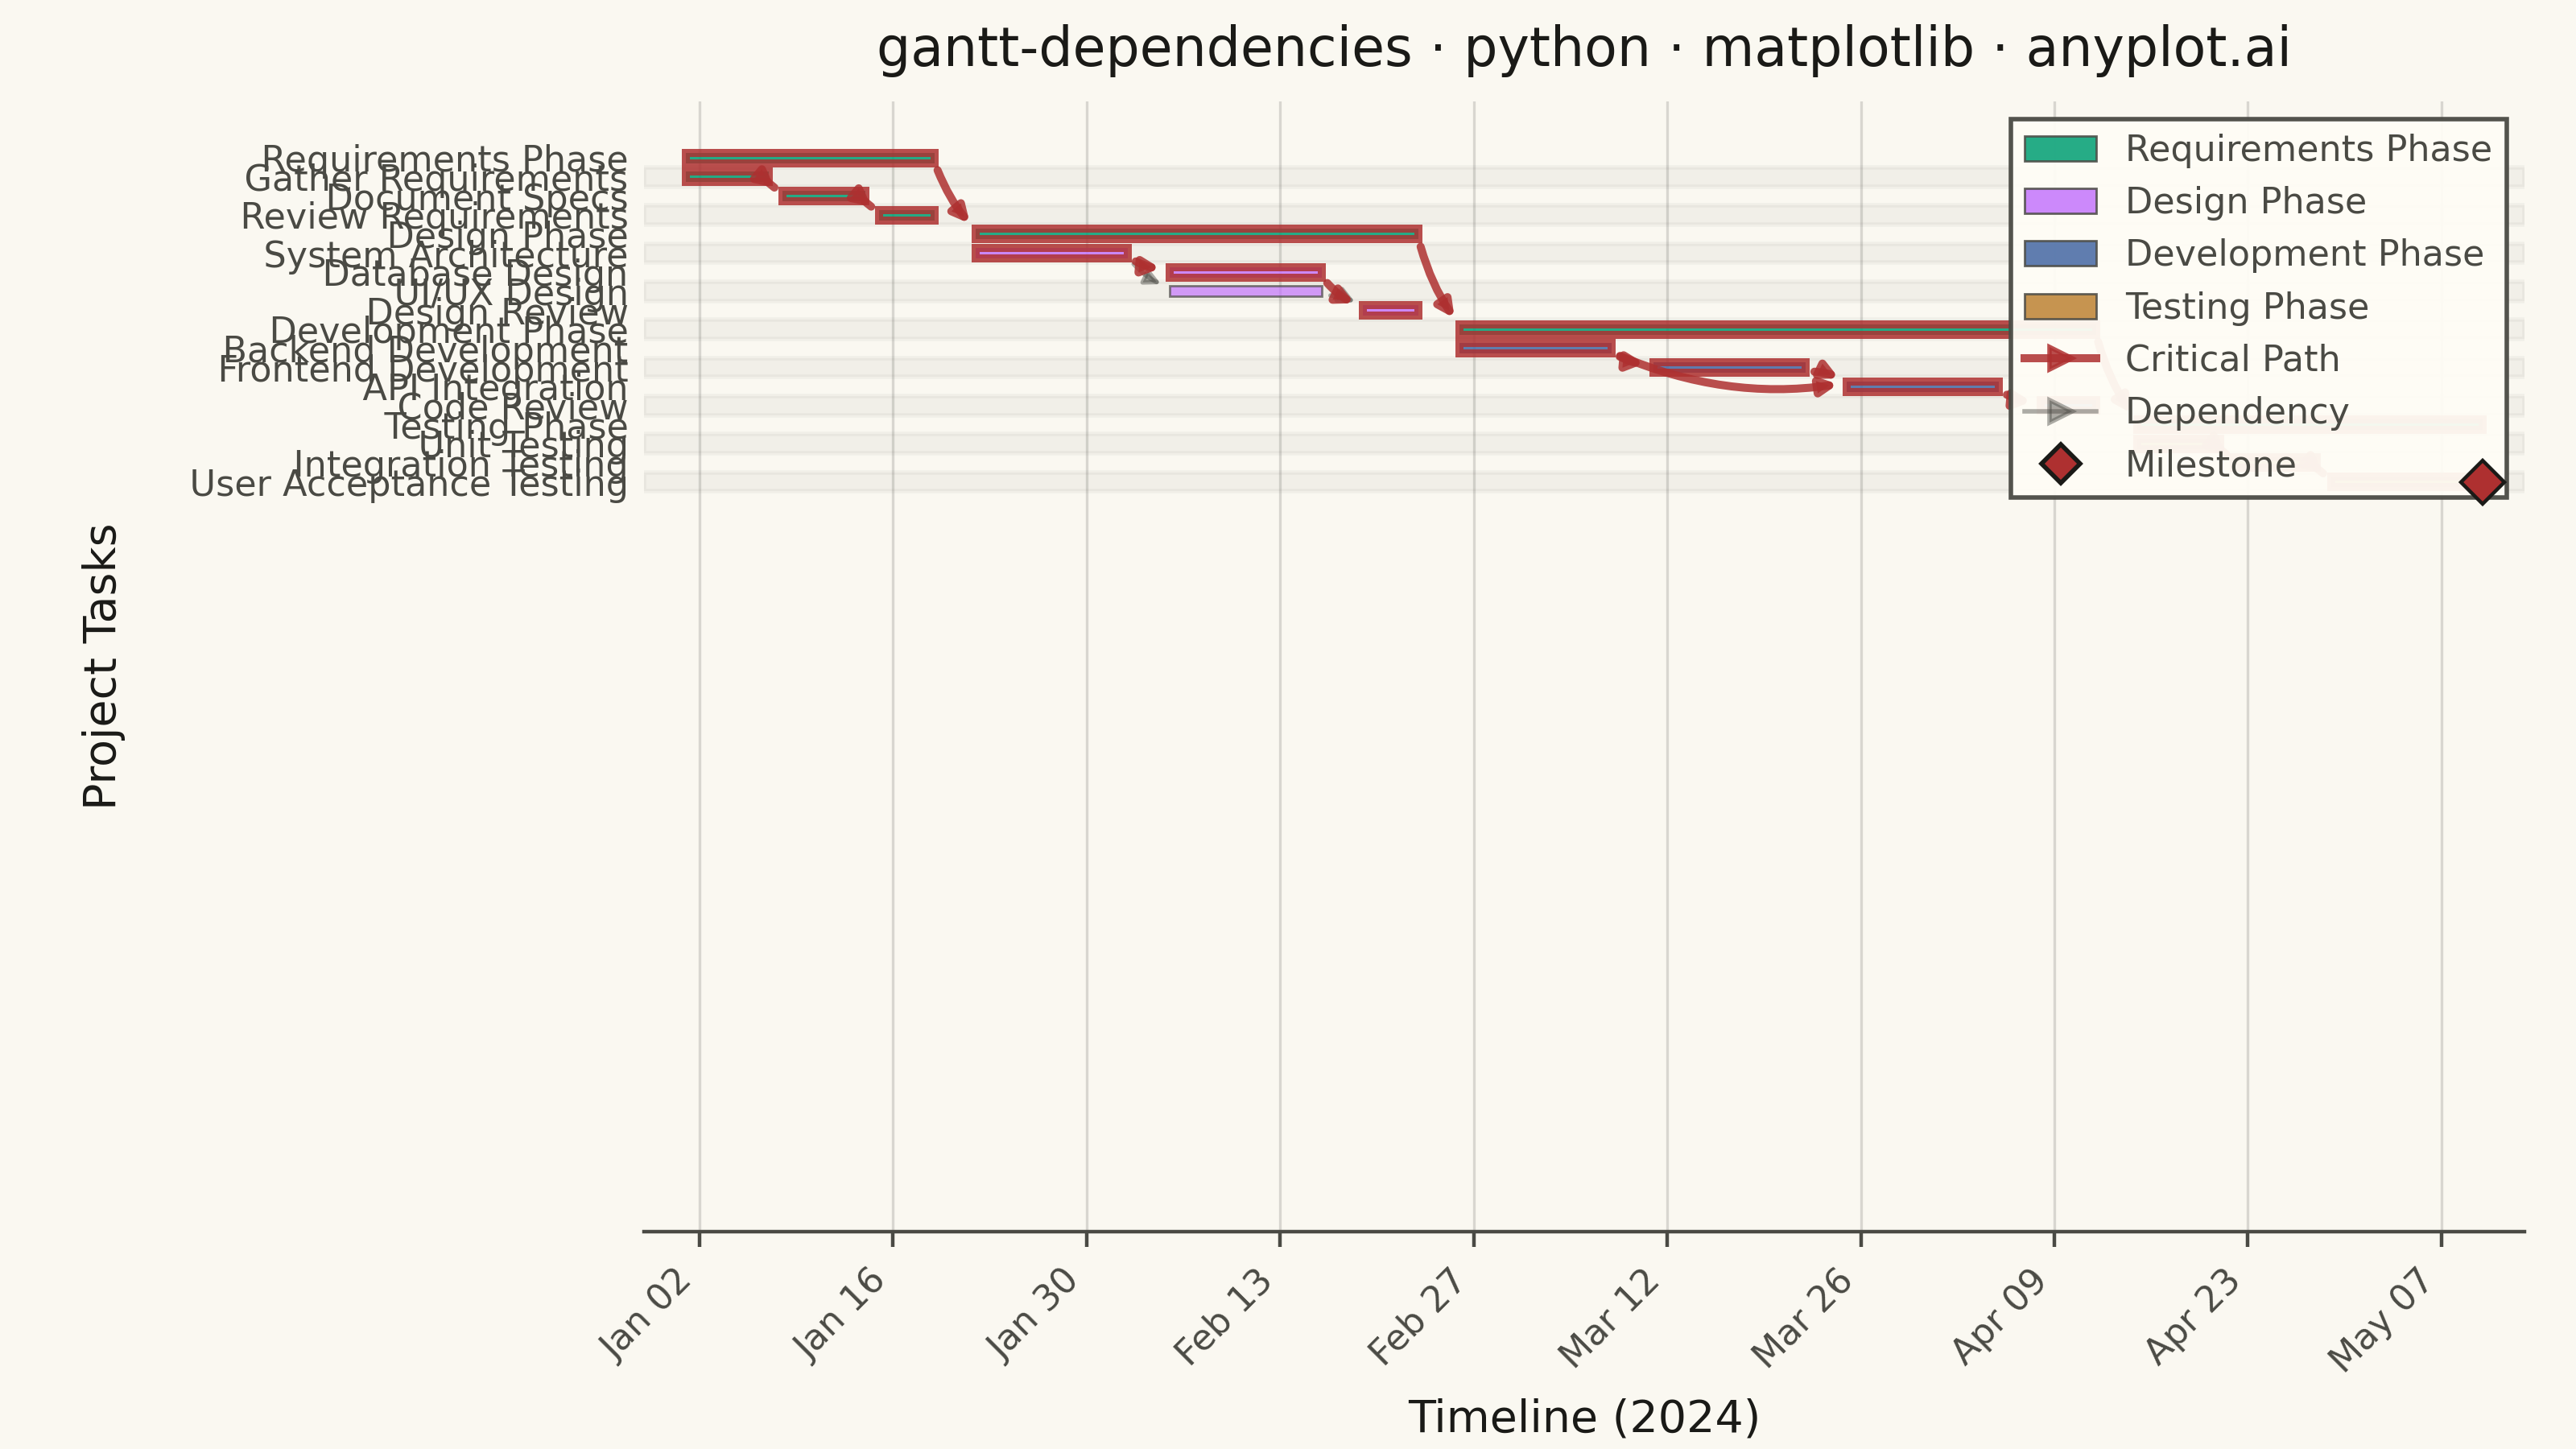
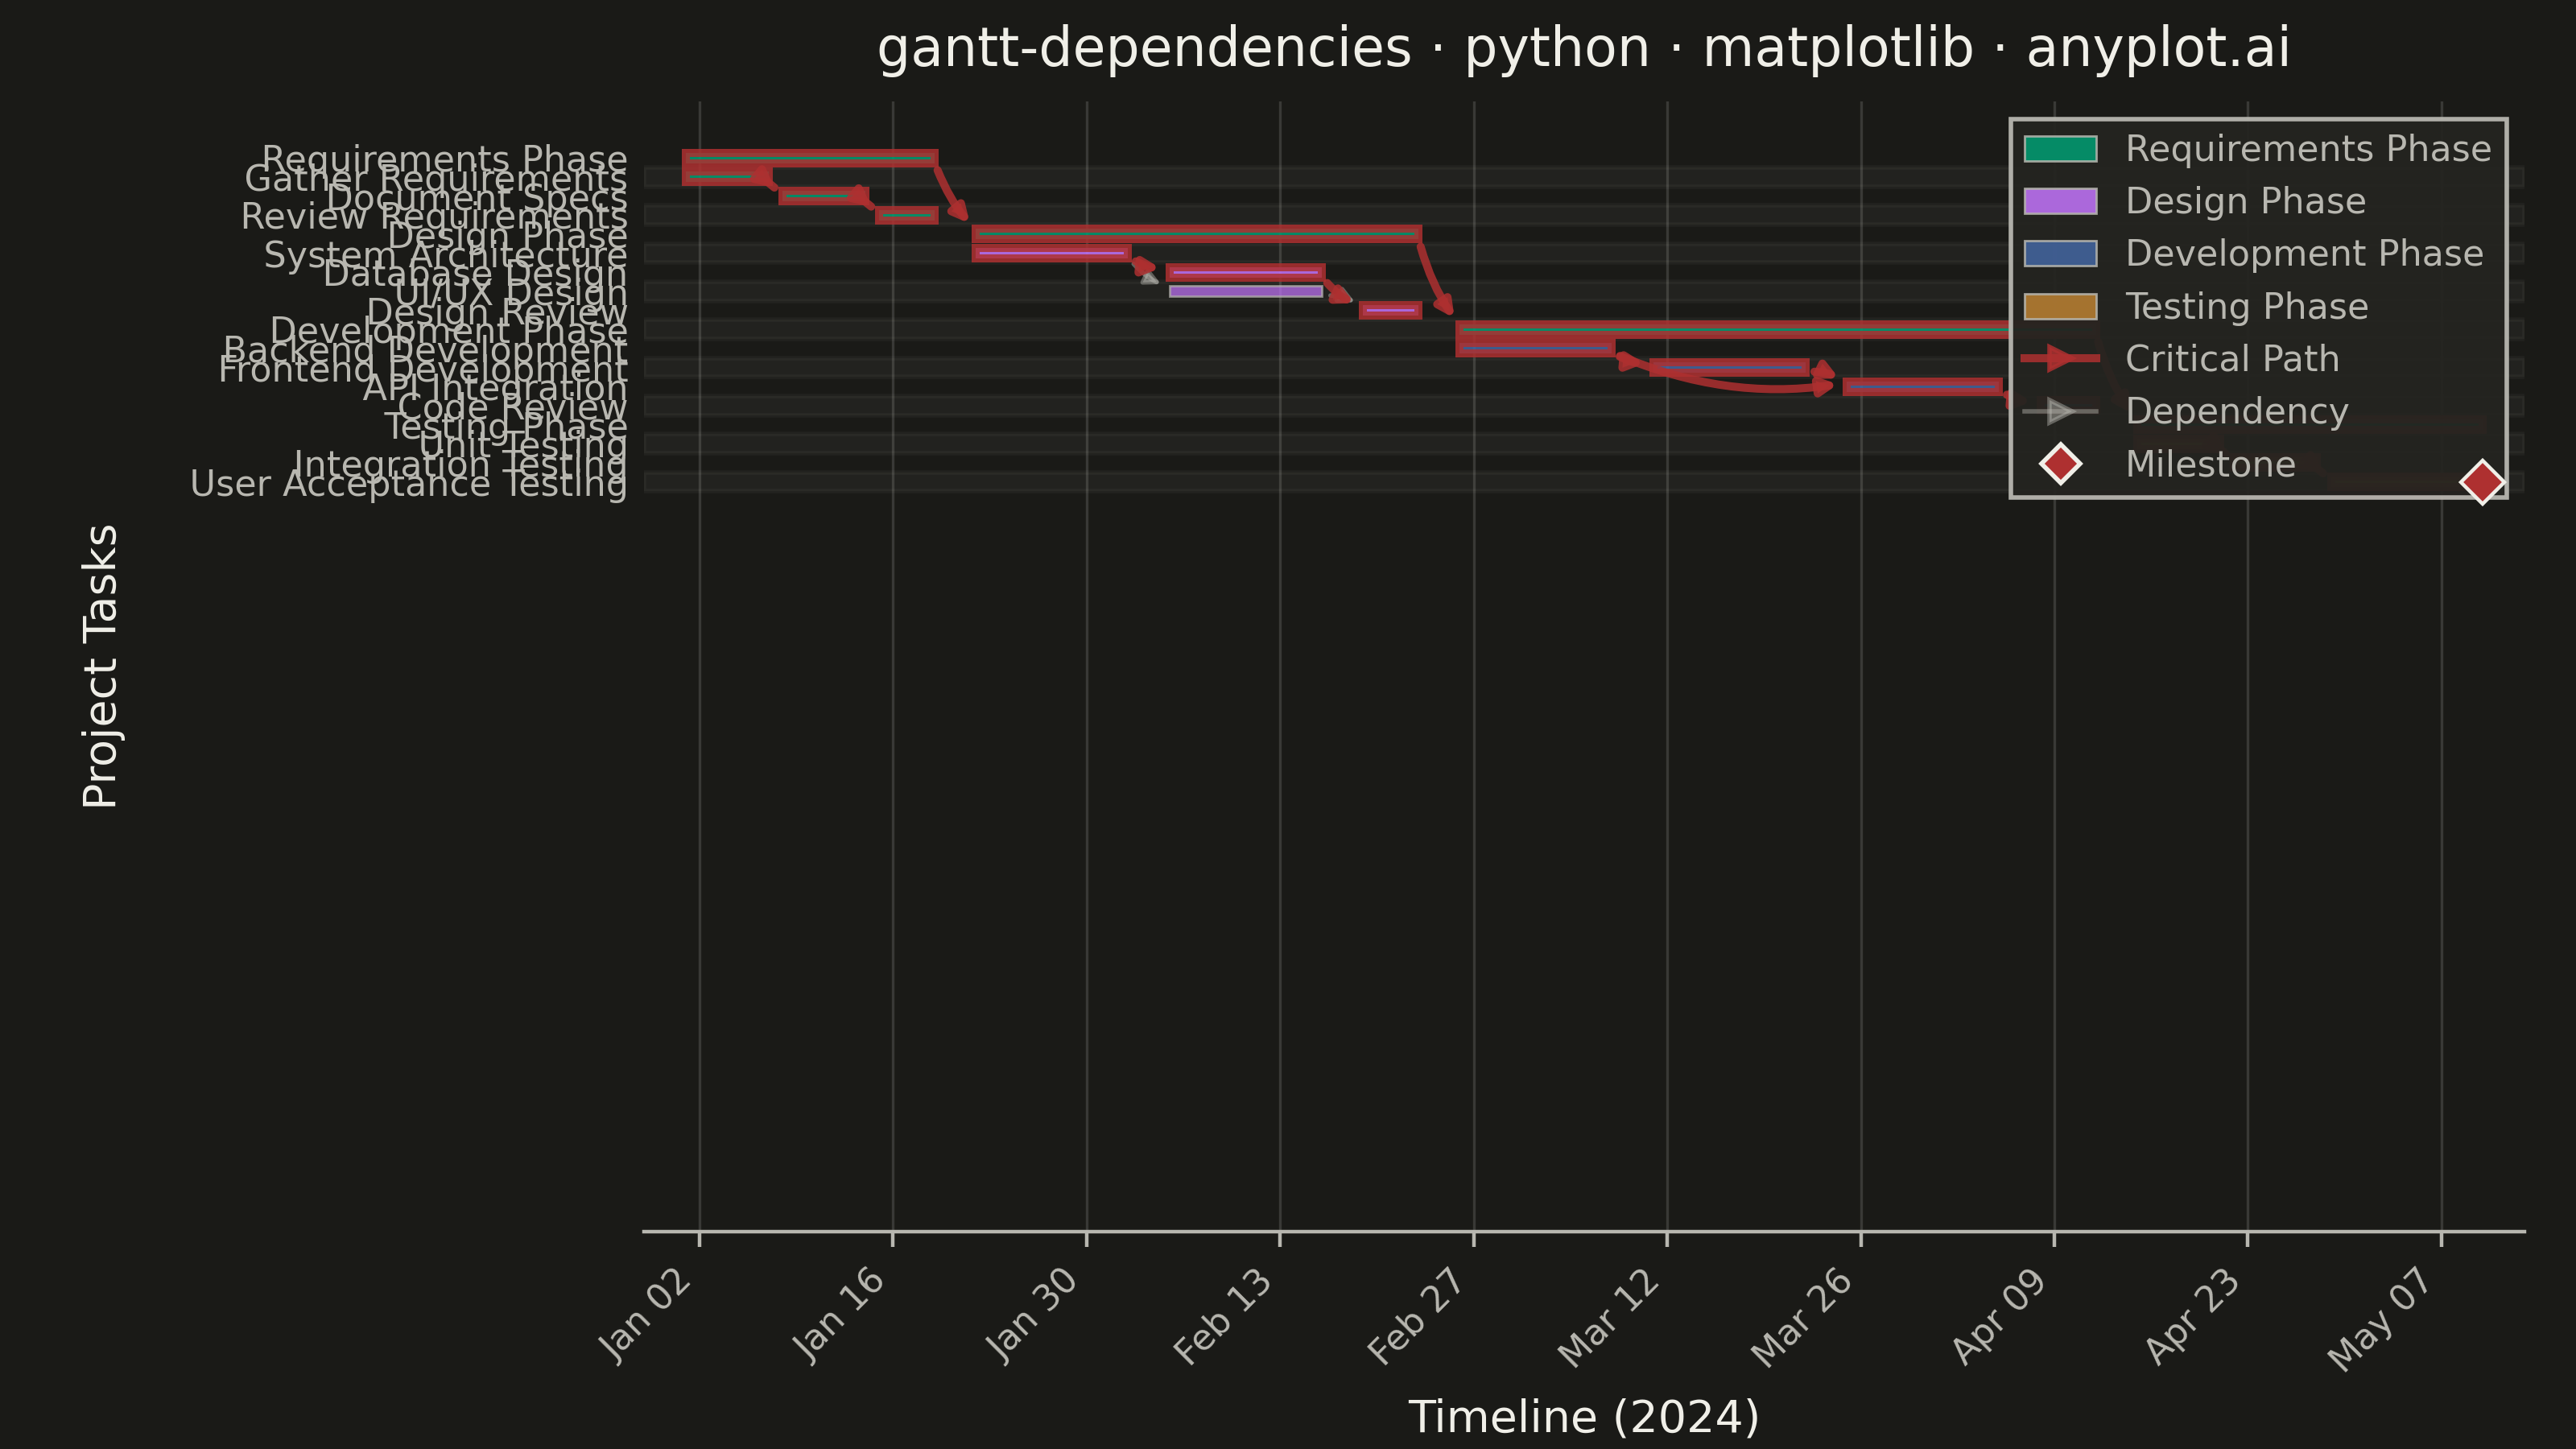
A Gantt chart that visualizes project schedules with task dependencies and groupings. Beyond displaying task timelines, this chart shows relationships between tasks using connector arrows, indicating which tasks must complete before others can begin. Tasks can be organized into groups (phases or work packages) with aggregate timeline bars showing the span of each group. This visualization is essential for understanding critical paths and scheduling constraints in complex projects.
""" anyplot.ai
gantt-dependencies: Gantt Chart with Dependencies
Library: matplotlib 3.10.9 | Python 3.13.13
Quality: 83/100 | Updated: 2026-06-02
"""

import os

import matplotlib.dates as mdates
import matplotlib.pyplot as plt
import pandas as pd
from matplotlib.lines import Line2D
from matplotlib.patches import FancyArrowPatch, Patch


# Theme tokens
THEME = os.getenv("ANYPLOT_THEME", "light")
PAGE_BG = "#FAF8F1" if THEME == "light" else "#1A1A17"
ELEVATED_BG = "#FFFDF6" if THEME == "light" else "#242420"
INK = "#1A1A17" if THEME == "light" else "#F0EFE8"
INK_SOFT = "#4A4A44" if THEME == "light" else "#B8B7B0"
INK_MUTED = "#6B6A63" if THEME == "light" else "#A8A79F"

# Imprint palette — positions 1-4 for phases; semantic red for critical path
IMPRINT_PALETTE = ["#009E73", "#C475FD", "#4467A3", "#BD8233", "#AE3030", "#2ABCCD", "#954477", "#99B314"]
CRITICAL_COLOR = "#AE3030"  # semantic red for critical path and milestone

# Data — software development project with 4 phases and inter-task dependencies
tasks_data = {
    "task": [
        "Requirements Phase",
        "Gather Requirements",
        "Document Specs",
        "Review Requirements",
        "Design Phase",
        "System Architecture",
        "Database Design",
        "UI/UX Design",
        "Design Review",
        "Development Phase",
        "Backend Development",
        "Frontend Development",
        "API Integration",
        "Code Review",
        "Testing Phase",
        "Unit Testing",
        "Integration Testing",
        "User Acceptance Testing",
    ],
    "start": [
        pd.Timestamp("2024-01-01"),
        pd.Timestamp("2024-01-01"),
        pd.Timestamp("2024-01-08"),
        pd.Timestamp("2024-01-15"),
        pd.Timestamp("2024-01-22"),
        pd.Timestamp("2024-01-22"),
        pd.Timestamp("2024-02-05"),
        pd.Timestamp("2024-02-05"),
        pd.Timestamp("2024-02-19"),
        pd.Timestamp("2024-02-26"),
        pd.Timestamp("2024-02-26"),
        pd.Timestamp("2024-03-11"),
        pd.Timestamp("2024-03-25"),
        pd.Timestamp("2024-04-08"),
        pd.Timestamp("2024-04-15"),
        pd.Timestamp("2024-04-15"),
        pd.Timestamp("2024-04-22"),
        pd.Timestamp("2024-04-29"),
    ],
    "end": [
        pd.Timestamp("2024-01-19"),
        pd.Timestamp("2024-01-07"),
        pd.Timestamp("2024-01-14"),
        pd.Timestamp("2024-01-19"),
        pd.Timestamp("2024-02-23"),
        pd.Timestamp("2024-02-02"),
        pd.Timestamp("2024-02-16"),
        pd.Timestamp("2024-02-16"),
        pd.Timestamp("2024-02-23"),
        pd.Timestamp("2024-04-12"),
        pd.Timestamp("2024-03-08"),
        pd.Timestamp("2024-03-22"),
        pd.Timestamp("2024-04-05"),
        pd.Timestamp("2024-04-12"),
        pd.Timestamp("2024-05-10"),
        pd.Timestamp("2024-04-21"),
        pd.Timestamp("2024-04-28"),
        pd.Timestamp("2024-05-10"),
    ],
    "group": [
        None,
        "Requirements Phase",
        "Requirements Phase",
        "Requirements Phase",
        None,
        "Design Phase",
        "Design Phase",
        "Design Phase",
        "Design Phase",
        None,
        "Development Phase",
        "Development Phase",
        "Development Phase",
        "Development Phase",
        None,
        "Testing Phase",
        "Testing Phase",
        "Testing Phase",
    ],
    "depends_on": [
        [],
        [],
        ["Gather Requirements"],
        ["Document Specs"],
        ["Requirements Phase"],
        [],
        ["System Architecture"],
        ["System Architecture"],
        ["Database Design", "UI/UX Design"],
        ["Design Phase"],
        [],
        ["Backend Development"],
        ["Backend Development", "Frontend Development"],
        ["API Integration"],
        ["Development Phase"],
        [],
        ["Unit Testing"],
        ["Integration Testing"],
    ],
}

df = pd.DataFrame(tasks_data)
df["duration"] = (df["end"] - df["start"]).dt.days
task_to_idx = {task: i for i, task in enumerate(df["task"])}

# Phase colors — Imprint palette positions 1-4
phase_colors = {
    "Requirements Phase": IMPRINT_PALETTE[0],  # #009E73 brand green
    "Design Phase": IMPRINT_PALETTE[1],  # #C475FD lavender
    "Development Phase": IMPRINT_PALETTE[2],  # #4467A3 blue
    "Testing Phase": IMPRINT_PALETTE[3],  # #BD8233 ochre
}

# Critical path — iterative DP on dependency DAG (no function definitions)
task_successors = {t: [] for t in df["task"]}
for _, r in df.iterrows():
    for dep in r["depends_on"]:
        if dep in task_successors:
            task_successors[dep].append(r["task"])

# Implicit edges: phase header → first children; last child → dependent phase header
for phase_name in phase_colors:
    children = df[df["group"] == phase_name]
    for _, child in children.iterrows():
        if not child["depends_on"]:
            task_successors[phase_name].append(child["task"])
    if not children.empty:
        last_child = children.loc[children["end"].idxmax(), "task"]
        for _, r in df.iterrows():
            if phase_name in r["depends_on"] and r["task"] in phase_colors:
                task_successors[last_child].append(r["task"])

# Kahn's topological sort
in_degree = dict.fromkeys(df["task"], 0)
for t in df["task"]:
    for s in task_successors[t]:
        if s in in_degree:
            in_degree[s] += 1

queue = [t for t in df["task"] if in_degree[t] == 0]
topo_order = []
while queue:
    node = queue.pop(0)
    topo_order.append(node)
    for s in task_successors[node]:
        if s in in_degree:
            in_degree[s] -= 1
            if in_degree[s] == 0:
                queue.append(s)

# Longest path via DP — dist[t] = length of longest path ending at t
dist = dict.fromkeys(df["task"], 1)
prev_node = dict.fromkeys(df["task"])
for t in topo_order:
    for s in task_successors[t]:
        if dist[t] + 1 > dist[s]:
            dist[s] = dist[t] + 1
            prev_node[s] = t

end_task = max(dist, key=dist.get)
critical_path = []
node = end_task
while node is not None:
    critical_path.append(node)
    node = prev_node[node]
critical_set = set(critical_path)

# Plot
n_tasks = len(df)
fig, ax = plt.subplots(figsize=(8, 4.5), dpi=400, facecolor=PAGE_BG)
ax.set_facecolor(PAGE_BG)
ax.set_axisbelow(True)

bar_height = 0.62
group_bar_height = 0.38

# Alternating row bands improve scanability across the wide timeline
for i in range(n_tasks):
    if i % 2 == 0:
        ax.axhspan(i - 0.5, i + 0.5, alpha=0.04, color=INK, zorder=0)

for _, row in df.iterrows():
    task = row["task"]
    start = row["start"]
    duration = row["duration"]
    group = row["group"]
    y_pos = n_tasks - 1 - task_to_idx[task]
    is_group = group is None and task in phase_colors
    on_critical = task in critical_set

    if is_group:
        edge_clr = CRITICAL_COLOR if on_critical else INK_SOFT
        edge_w = 2.0 if on_critical else 1.2
        ax.barh(
            y_pos,
            duration,
            left=start,
            height=group_bar_height,
            color=phase_colors[task],
            alpha=0.95,
            edgecolor=edge_clr,
            linewidth=edge_w,
            zorder=3,
        )
    else:
        color = phase_colors[group] if group and group in phase_colors else IMPRINT_PALETTE[0]
        edge_clr = CRITICAL_COLOR if on_critical else INK_SOFT
        edge_w = 1.8 if on_critical else 0.5
        ax.barh(
            y_pos,
            duration,
            left=start,
            height=bar_height,
            color=color,
            alpha=0.85 if on_critical else 0.70,
            edgecolor=edge_clr,
            linewidth=edge_w,
            zorder=3,
        )

# Dependency arrows — offset endpoints into inter-bar gaps; alternate curvature for multi-predecessor tasks
for _, row in df.iterrows():
    task = row["task"]
    y_pos = n_tasks - 1 - task_to_idx[task]
    for dep_i, dep in enumerate(row["depends_on"]):
        if dep not in task_to_idx:
            continue
        dep_y = n_tasks - 1 - task_to_idx[dep]
        dep_end = df[df["task"] == dep].iloc[0]["end"]
        dy = abs(y_pos - dep_y)
        rad = 0.15 if dy <= 2 else (0.10 if dy <= 5 else 0.07)
        is_crit = dep in critical_set and task in critical_set

        # Vertical offset routes arrows through the gap between bars rather than crossing them
        y_dir = 1 if dep_y > y_pos else -1
        v_off = 0.20
        # Alternate curvature for multi-predecessor cases to spread converging arrows apart
        rad_sign = 1 if dep_i % 2 == 0 else -1
        arrow = FancyArrowPatch(
            (dep_end, dep_y - y_dir * v_off),
            (row["start"], y_pos + y_dir * v_off),
            arrowstyle="-|>",
            color=CRITICAL_COLOR if is_crit else INK_SOFT,
            linewidth=1.8 if is_crit else 1.0,
            connectionstyle=f"arc3,rad={rad_sign * rad}",
            alpha=0.85 if is_crit else 0.45,
            mutation_scale=7,
            zorder=5 if is_crit else 4,
        )
        ax.add_patch(arrow)

# Y-axis labels — phase headers bold in INK, child tasks indented with wider margin in INK_SOFT
task_labels = df["task"].tolist()[::-1]
styled_labels = [f"    {lbl}" if df[df["task"] == lbl].iloc[0]["group"] is not None else lbl for lbl in task_labels]
ax.set_yticks(range(len(task_labels)))
ax.set_yticklabels(styled_labels, fontsize=6.5, color=INK_SOFT)
for i, lbl in enumerate(task_labels):
    row_data = df[df["task"] == lbl].iloc[0]
    if row_data["group"] is None and lbl in phase_colors:
        tick_lbl = ax.get_yticklabels()[i]
        tick_lbl.set_fontweight("bold")
        tick_lbl.set_color(INK)

# X-axis date formatting — axes methods only (no plt.xticks)
ax.xaxis.set_major_formatter(mdates.DateFormatter("%b %d"))
ax.xaxis.set_major_locator(mdates.WeekdayLocator(interval=2))
ax.tick_params(axis="x", labelsize=8, colors=INK_SOFT, labelrotation=45)
ax.tick_params(axis="y", length=0)  # hide tick marks, keep labels — cleaner alongside no left spine
plt.setp(ax.get_xticklabels(), ha="right")

# Labels and title
title = "gantt-dependencies · python · matplotlib · anyplot.ai"
title_n = len(title)
title_fs = max(8, round(12 * 67 / title_n)) if title_n > 67 else 12
ax.set_title(title, fontsize=title_fs, fontweight="medium", color=INK, pad=8)
ax.set_xlabel("Timeline (2024)", fontsize=10, color=INK)
ax.set_ylabel("Project Tasks", fontsize=10, color=INK)

# Grid — x-axis only; alternating row bands handle horizontal scanability
ax.grid(True, axis="x", alpha=0.15, linewidth=0.6, color=INK)

# Spines — remove top, right, and left for a clean open composition
ax.spines["top"].set_visible(False)
ax.spines["right"].set_visible(False)
ax.spines["left"].set_visible(False)
ax.spines["bottom"].set_color(INK_SOFT)

# Milestone marker at project completion
project_end = df["end"].max()
last_y = n_tasks - 1 - task_to_idx["User Acceptance Testing"]
ax.plot(
    project_end,
    last_y,
    marker="D",
    markersize=7,
    color=CRITICAL_COLOR,
    markeredgecolor=INK,
    markeredgewidth=0.8,
    zorder=6,
)

# Legend
legend_patches = [
    Patch(facecolor=clr, alpha=0.85, edgecolor=INK_SOFT, linewidth=0.5, label=phase)
    for phase, clr in phase_colors.items()
]
legend_patches += [
    Line2D(
        [0],
        [0],
        color=CRITICAL_COLOR,
        linewidth=1.8,
        alpha=0.85,
        marker=">",
        markersize=5,
        markeredgecolor=CRITICAL_COLOR,
        label="Critical Path",
    ),
    Line2D(
        [0],
        [0],
        color=INK_SOFT,
        linewidth=1.0,
        alpha=0.45,
        marker=">",
        markersize=5,
        markeredgecolor=INK_SOFT,
        label="Dependency",
    ),
    Line2D(
        [0],
        [0],
        color=CRITICAL_COLOR,
        marker="D",
        markersize=6,
        markeredgecolor=INK,
        linestyle="None",
        label="Milestone",
    ),
]
leg = ax.legend(
    handles=legend_patches, loc="lower right", fontsize=7, framealpha=0.95, edgecolor=INK_SOFT, fancybox=False
)
if leg:
    leg.get_frame().set_facecolor(ELEVATED_BG)
    plt.setp(leg.get_texts(), color=INK_SOFT)

ax.set_xlim(df["start"].min() - pd.Timedelta(days=3), df["end"].max() + pd.Timedelta(days=3))
fig.subplots_adjust(left=0.25, right=0.98, top=0.93, bottom=0.15)
plt.savefig(f"plot-{THEME}.png", dpi=400, facecolor=PAGE_BG)
Runnable source as JSON, for any HTTP client: https://api.anyplot.ai/specs/gantt-dependencies/matplotlib/code. Any spec id and library id listed in llms-full.txt fit the same URL shape; every URL below is complete and callable.
{
  "spec_id": "gantt-dependencies",
  "language": "python",
  "library": "matplotlib",
  "page": "https://anyplot.ai/gantt-dependencies/python/matplotlib",
  "hub": "https://anyplot.ai/gantt-dependencies",
  "code_json": "https://api.anyplot.ai/specs/gantt-dependencies/matplotlib/code",
  "spec_json": "https://api.anyplot.ai/specs/gantt-dependencies",
  "render_light_png": "https://storage.googleapis.com/anyplot-images/plots/gantt-dependencies/python/matplotlib/plot-light.png",
  "render_dark_png": "https://storage.googleapis.com/anyplot-images/plots/gantt-dependencies/python/matplotlib/plot-dark.png",
  "quality_score": 83.0,
  "license": "MIT",
  "guide": "https://anyplot.ai/llms.txt"
}
Part of Gantt Chart with Dependencies on anyplot.ai.