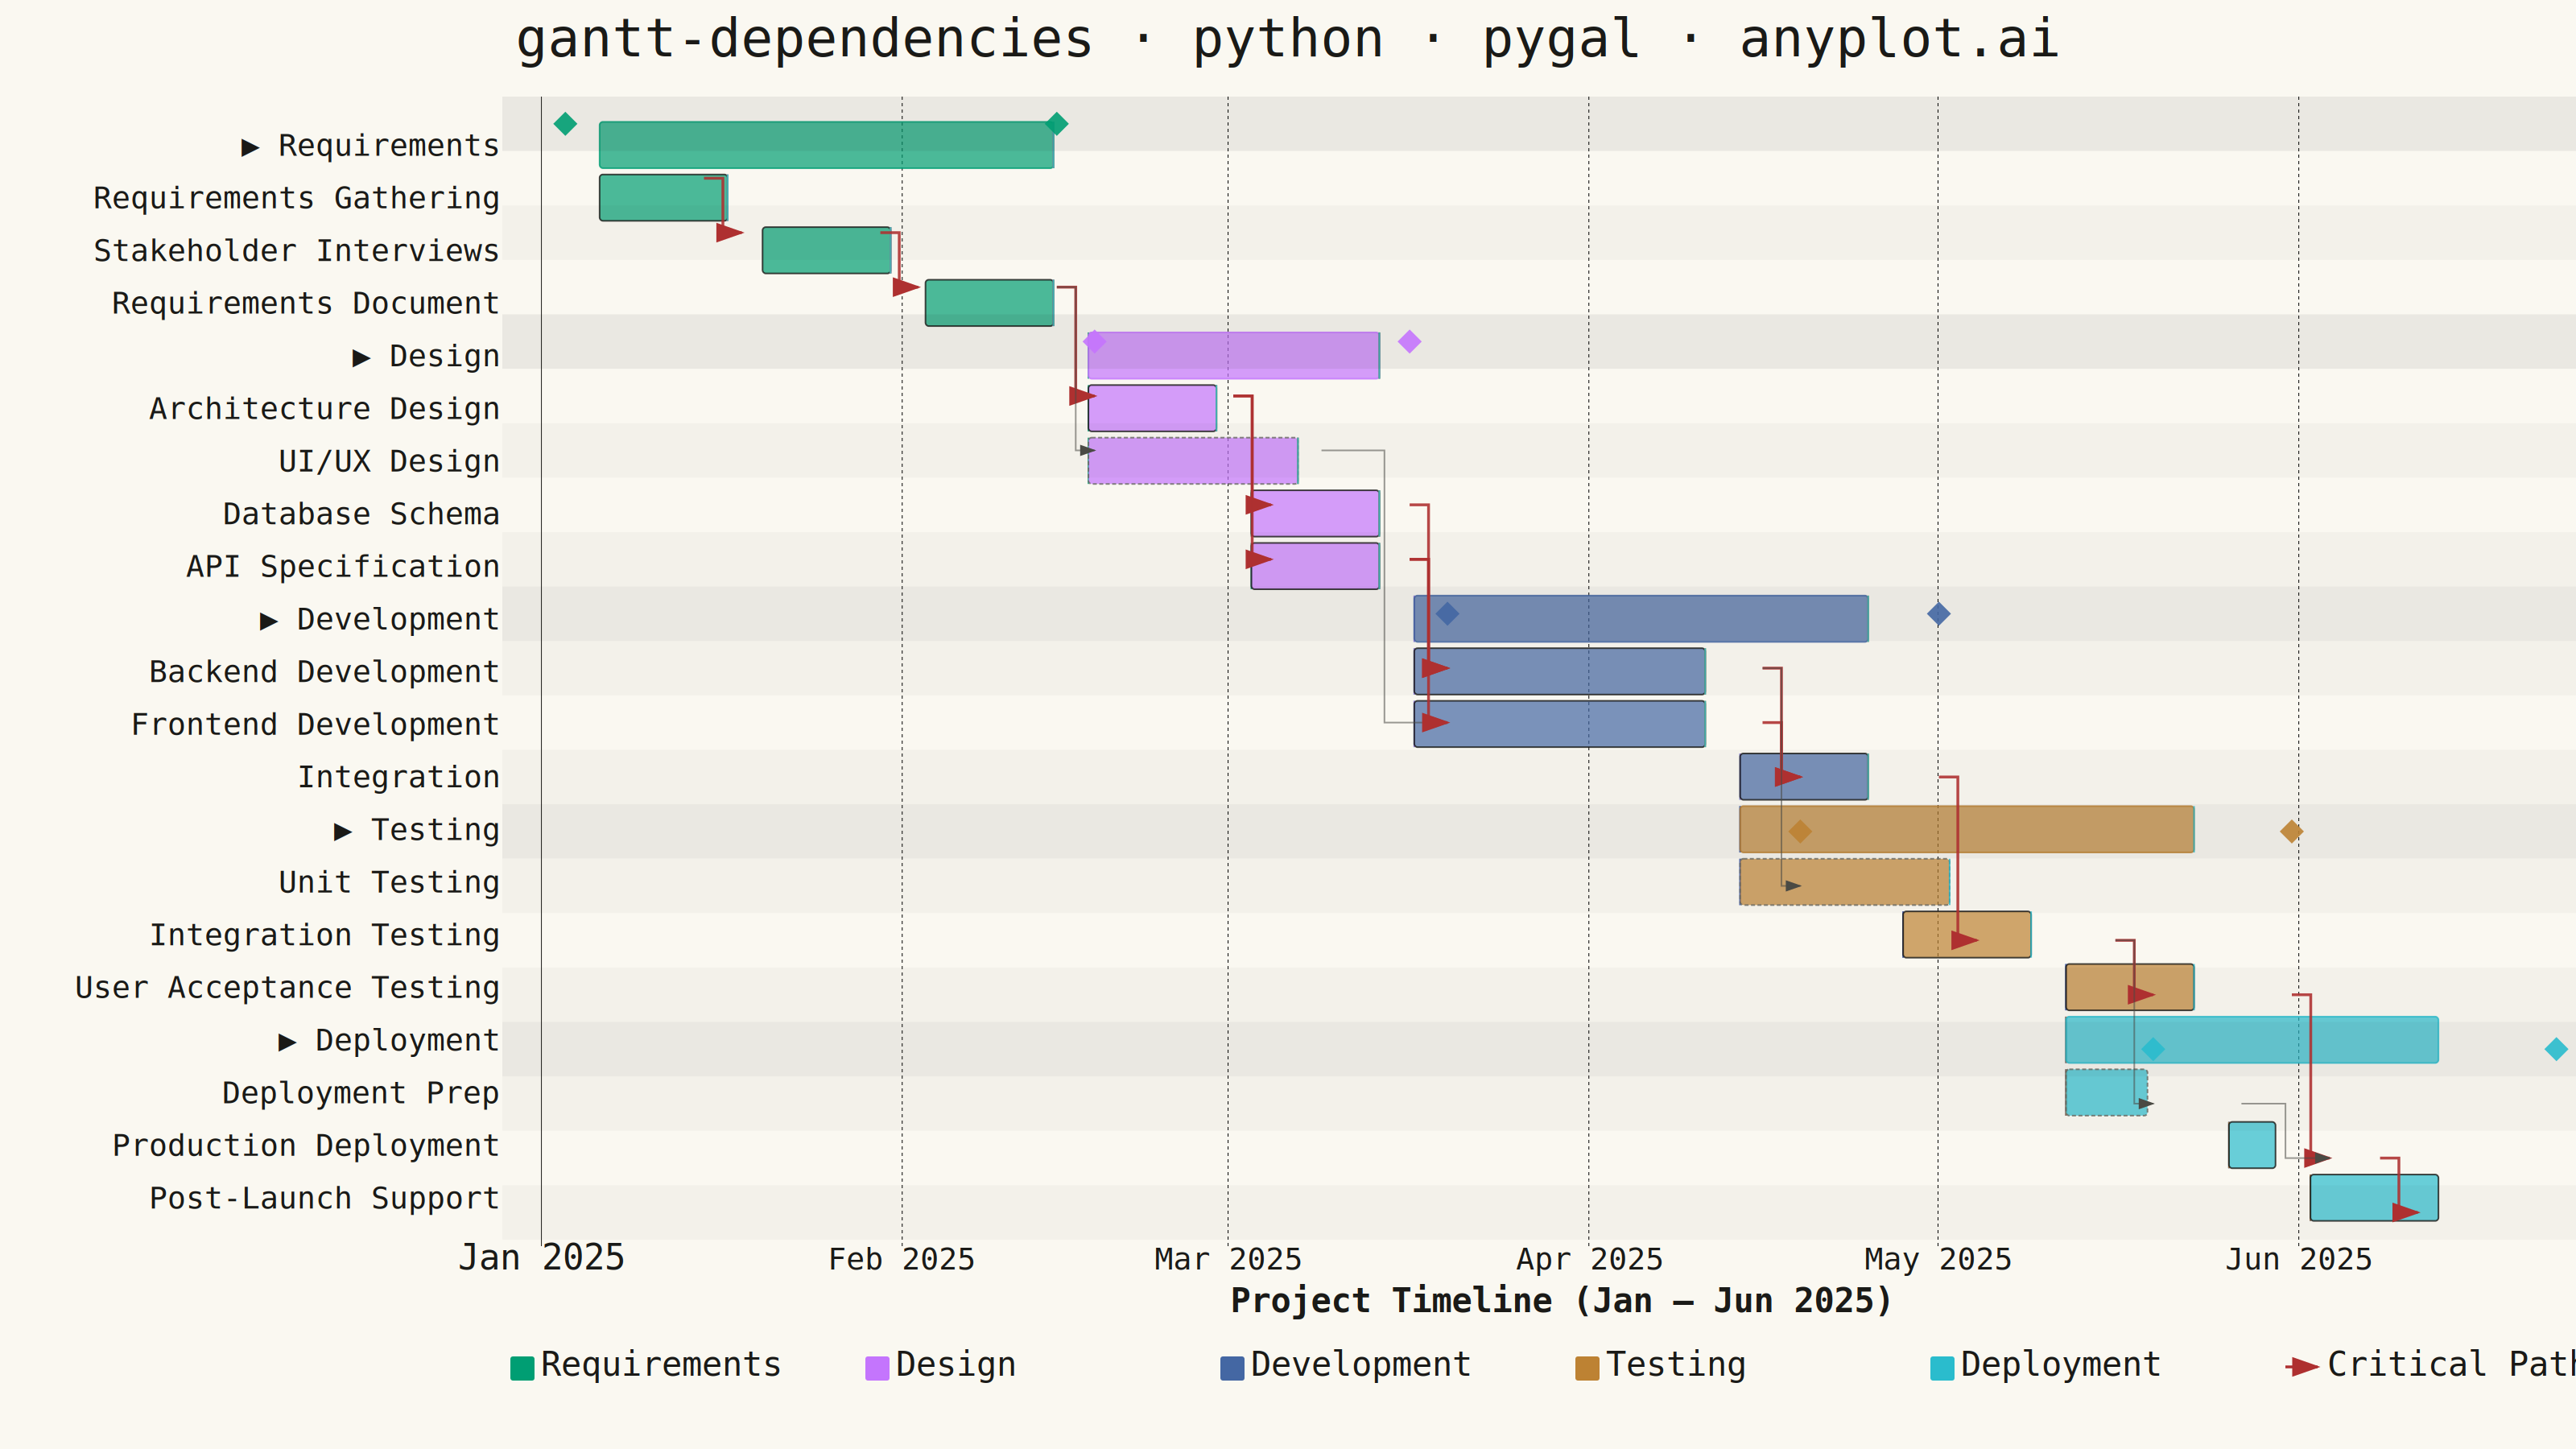
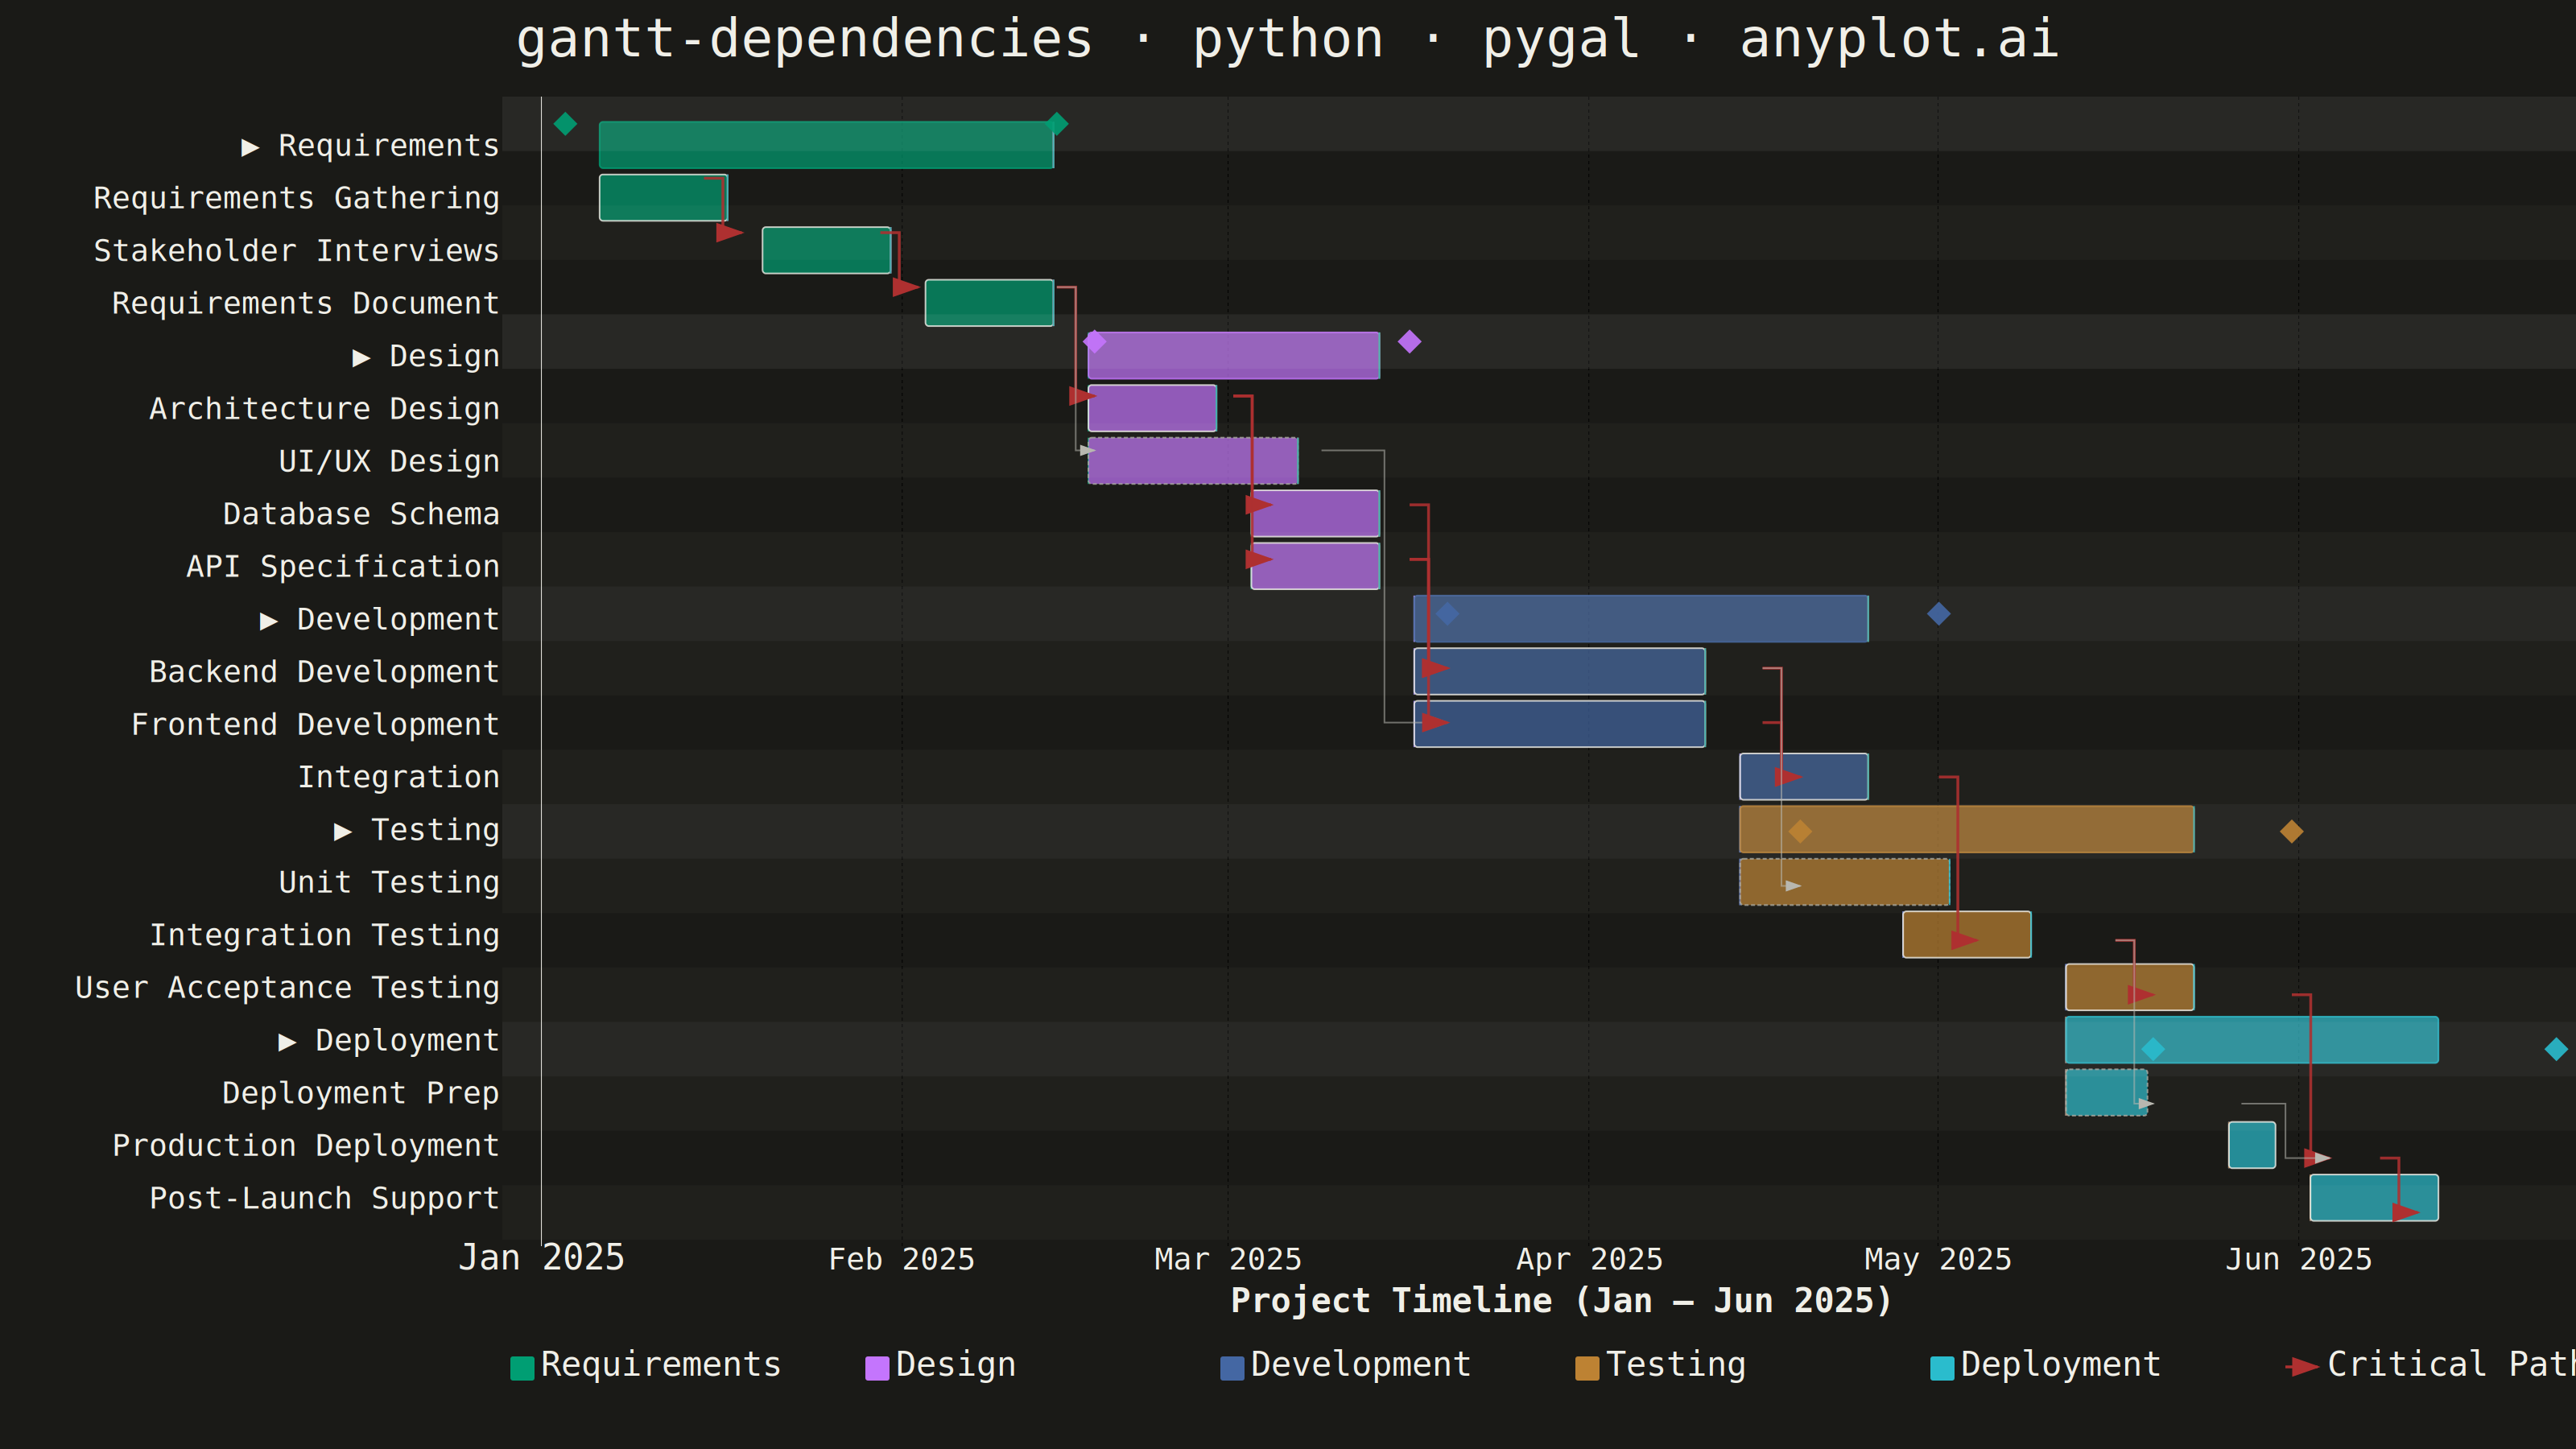
A Gantt chart that visualizes project schedules with task dependencies and groupings. Beyond displaying task timelines, this chart shows relationships between tasks using connector arrows, indicating which tasks must complete before others can begin. Tasks can be organized into groups (phases or work packages) with aggregate timeline bars showing the span of each group. This visualization is essential for understanding critical paths and scheduling constraints in complex projects.
""" anyplot.ai
gantt-dependencies: Gantt Chart with Dependencies
Library: pygal 3.1.0 | Python 3.13.13
Quality: 87/100 | Updated: 2026-06-02
"""

import os
import re
import sys
from datetime import date, timedelta


# Strip script directory from sys.path so 'import pygal' finds the installed package, not this file
_script_dir = os.path.abspath(os.path.dirname(__file__))
sys.path = [p for p in sys.path if p and os.path.abspath(p) != _script_dir]

import cairosvg
import pygal
from pygal.style import Style


# Theme tokens — Imprint palette chrome
THEME = os.getenv("ANYPLOT_THEME", "light")
PAGE_BG = "#FAF8F1" if THEME == "light" else "#1A1A17"
INK = "#1A1A17" if THEME == "light" else "#F0EFE8"
INK_SOFT = "#4A4A44" if THEME == "light" else "#B8B7B0"
INK_MUTED = "#6B6A63" if THEME == "light" else "#A8A79F"

# Imprint categorical palette — positions 1–5 mapped to phases
CAT_COLORS = {
    "Requirements": "#009E73",  # Imprint pos 1 — brand green
    "Design": "#C475FD",  # Imprint pos 2 — lavender
    "Development": "#4467A3",  # Imprint pos 3 — blue
    "Testing": "#BD8233",  # Imprint pos 4 — ochre
    "Deployment": "#2ABCCD",  # Imprint pos 6 — cyan
}
CRITICAL_COLOR = "#AE3030"  # Imprint pos 5 — matte red, critical path semantic anchor

# Data: Software Development Project with phase groupings and dependencies
tasks = [
    (1, "Requirements Gathering", "Requirements", date(2025, 1, 6), date(2025, 1, 17), []),
    (2, "Stakeholder Interviews", "Requirements", date(2025, 1, 20), date(2025, 1, 31), [1]),
    (3, "Requirements Document", "Requirements", date(2025, 2, 3), date(2025, 2, 14), [2]),
    (4, "Architecture Design", "Design", date(2025, 2, 17), date(2025, 2, 28), [3]),
    (5, "UI/UX Design", "Design", date(2025, 2, 17), date(2025, 3, 7), [3]),
    (6, "Database Schema", "Design", date(2025, 3, 3), date(2025, 3, 14), [4]),
    (7, "API Specification", "Design", date(2025, 3, 3), date(2025, 3, 14), [4]),
    (8, "Backend Development", "Development", date(2025, 3, 17), date(2025, 4, 11), [6, 7]),
    (9, "Frontend Development", "Development", date(2025, 3, 17), date(2025, 4, 11), [5, 7]),
    (10, "Integration", "Development", date(2025, 4, 14), date(2025, 4, 25), [8, 9]),
    (11, "Unit Testing", "Testing", date(2025, 4, 14), date(2025, 5, 2), [8]),
    (12, "Integration Testing", "Testing", date(2025, 4, 28), date(2025, 5, 9), [10]),
    (13, "User Acceptance Testing", "Testing", date(2025, 5, 12), date(2025, 5, 23), [12]),
    (14, "Deployment Prep", "Deployment", date(2025, 5, 12), date(2025, 5, 19), [12]),
    (15, "Production Deployment", "Deployment", date(2025, 5, 26), date(2025, 5, 30), [13, 14]),
    (16, "Post-Launch Support", "Deployment", date(2025, 6, 2), date(2025, 6, 13), [15]),
]

categories = ["Requirements", "Design", "Development", "Testing", "Deployment"]
critical_ids = {1, 2, 3, 4, 6, 7, 8, 9, 10, 12, 13, 15, 16}

reference = date(2025, 1, 1)
phase_spans = {}
for cat in categories:
    cat_tasks = [t for t in tasks if t[2] == cat]
    phase_spans[cat] = (min(t[3] for t in cat_tasks), max(t[4] for t in cat_tasks))

all_dates = [d for t in tasks for d in (t[3], t[4])]
start_day = (min(all_dates) - reference).days - 5
end_day = (max(all_dates) - reference).days + 5
day_range = end_day - start_day

# Display rows bottom-to-top (pygal x_labels[0] = bottom row)
display_rows = []
for cat in reversed(categories):
    for t in reversed([t for t in tasks if t[2] == cat]):
        display_rows.append(("task", t))
    display_rows.append(("phase", cat))

num_rows = len(display_rows)

# HorizontalStackedBar: transparent offset bar + per-category bars (pygal-native Gantt technique)
offset_data = []
cat_series = {c: [] for c in categories}

for row_type, row_data in display_rows:
    if row_type == "phase":
        cat = row_data
        ps, pe = phase_spans[cat]
        offset = (ps - reference).days - start_day
        dur = (pe - ps).days
        offset_data.append(offset)
        for c in categories:
            if c == cat:
                cat_series[c].append(
                    {
                        "value": dur,
                        "style": f"fill-opacity:0.22;stroke:{CAT_COLORS[c]};stroke-width:2;stroke-opacity:0.7",
                    }
                )
            else:
                cat_series[c].append(None)
    else:
        tid, name, category, s, e, deps = row_data
        offset = (s - reference).days - start_day
        dur = (e - s).days
        offset_data.append(offset)
        is_crit = tid in critical_ids
        for c in categories:
            if c == category:
                if is_crit:
                    style = f"fill-opacity:0.92;stroke:{INK};stroke-width:1"
                else:
                    style = f"fill-opacity:0.62;stroke-dasharray:5,3;stroke-width:1;stroke:{INK_MUTED}"
                cat_series[c].append({"value": dur, "style": style})
            else:
                cat_series[c].append(None)

row_labels = []
for row_type, row_data in display_rows:
    if row_type == "phase":
        row_labels.append(f"▶ {row_data}")
    else:
        row_labels.append(f"  {row_data[1]}")

# Title length-based font scaling (67-char baseline → 66px default)
title = "gantt-dependencies · python · pygal · anyplot.ai"
title_n = len(title)
title_ratio = 67 / title_n if title_n > 67 else 1.0
title_fs = max(44, round(66 * title_ratio))

custom_style = Style(
    background=PAGE_BG,
    plot_background=PAGE_BG,
    foreground=INK,
    foreground_strong=INK,
    foreground_subtle=INK_MUTED,
    colors=("rgba(0,0,0,0)",) + tuple(CAT_COLORS[c] for c in categories),
    font_family="Consolas, monospace",
    title_font_size=title_fs,
    label_font_size=38,
    major_label_font_size=44,
    legend_font_size=44,
    value_font_size=22,
    stroke_width=2,
)

month_positions = [(date(2025, m, 1) - reference).days - start_day for m in range(1, 7)]

chart = pygal.HorizontalStackedBar(
    width=3200,
    height=1800,
    style=custom_style,
    title=title,
    show_legend=False,
    print_values=False,
    show_y_guides=True,
    show_x_guides=False,
    show_y_labels=True,
    show_x_labels=True,
    y_labels=month_positions,
    value_formatter=lambda v: (reference + timedelta(days=int(round(v)) + start_day)).strftime("%b %Y"),
    margin=50,
    margin_bottom=210,
    spacing=4,
    range=(0, day_range),
    rounded_bars=4,
)

chart.x_labels = row_labels
chart.add("", offset_data)
for cat in categories:
    chart.add(cat, cat_series[cat])

svg_string = chart.render().decode("utf-8")

# Extract plot area from rendered SVG — fallbacks calibrated to 3200×1800 canvas
plot_left, plot_top, plot_w, plot_h = 410, 110, 2630, 1420

m1 = re.search(r'class="plot[^"]*"[^>]*transform="translate\(([\d.]+)[, ]+([\d.]+)\)"', svg_string)
if not m1:
    m1 = re.search(r'transform="translate\(([\d.]+)[, ]+([\d.]+)\)"[^>]*class="plot', svg_string)
if m1:
    plot_left, plot_top = float(m1.group(1)), float(m1.group(2))

m2 = re.search(r'class="plot_background"[^>]*width="([\d.]+)"[^>]*height="([\d.]+)"', svg_string)
if not m2:
    m2 = re.search(r'width="([\d.]+)"[^>]*height="([\d.]+)"[^>]*class="plot_background"', svg_string)
if m2:
    plot_w, plot_h = float(m2.group(1)), float(m2.group(2))

row_h = plot_h / num_rows

# Map task IDs to bar pixel positions for dependency arrow rendering
bar_pos = {}
for i, (row_type, row_data) in enumerate(display_rows):
    if row_type != "task":
        continue
    tid, _, _, s, e, _ = row_data
    off = (s - reference).days - start_day
    dur = (e - s).days
    bar_pos[tid] = {
        "xs": plot_left + (off / day_range) * plot_w,
        "xe": plot_left + ((off + dur) / day_range) * plot_w,
        "yc": plot_top + plot_h - (i + 0.5) * row_h,
    }

custom = []

# SVG defs: arrowhead markers for standard and critical-path dependencies
custom.append(
    "<defs>"
    f'<marker id="arr_dep" markerWidth="10" markerHeight="7" refX="9" refY="3.5" orient="auto">'
    f'<polygon points="0 0,10 3.5,0 7" fill="{INK_SOFT}"/>'
    "</marker>"
    f'<marker id="arr_crit" markerWidth="10" markerHeight="7" refX="9" refY="3.5" orient="auto">'
    f'<polygon points="0 0,10 3.5,0 7" fill="{CRITICAL_COLOR}"/>'
    "</marker>"
    "</defs>"
)

# Alternating row backgrounds — theme-adaptive, ink-tinted
for i in range(num_rows):
    y_top = plot_top + plot_h - (i + 1) * row_h
    row_type = display_rows[i][0]
    if row_type == "phase":
        custom.append(
            f'<rect x="{plot_left:.1f}" y="{y_top:.1f}" '
            f'width="{plot_w:.1f}" height="{row_h:.1f}" '
            f'fill="{INK}" opacity="0.07"/>'
        )
    elif i % 2 == 0:
        custom.append(
            f'<rect x="{plot_left:.1f}" y="{y_top:.1f}" '
            f'width="{plot_w:.1f}" height="{row_h:.1f}" '
            f'fill="{INK}" opacity="0.03"/>'
        )

# Diamond milestone markers at phase aggregate start/end
for i, (row_type, row_data) in enumerate(display_rows):
    if row_type != "phase":
        continue
    cat = row_data
    ps, pe = phase_spans[cat]
    x_s = plot_left + ((ps - reference).days - start_day) / day_range * plot_w
    x_e = plot_left + ((pe - reference).days - start_day) / day_range * plot_w
    yc = plot_top + plot_h - (i + 0.5) * row_h
    color = CAT_COLORS[cat]
    ds = 15
    for dx in [x_s, x_e]:
        custom.append(
            f'<polygon points="{dx:.1f},{yc - ds:.1f} {dx + ds:.1f},{yc:.1f} '
            f'{dx:.1f},{yc + ds:.1f} {dx - ds:.1f},{yc:.1f}" '
            f'fill="{color}" opacity="0.9"/>'
        )

# Dependency arrows — elbow connectors, critical path in Imprint matte red
for tid, _, _, _, _, deps in tasks:
    if not deps:
        continue
    tgt = bar_pos[tid]
    for did in deps:
        src = bar_pos[did]
        x1, y1 = src["xe"], src["yc"]
        x2, y2 = tgt["xs"], tgt["yc"]
        mx = x1 + (x2 - x1) * 0.5
        is_crit = tid in critical_ids and did in critical_ids
        if abs(y1 - y2) < 4:
            d = f"M{x1:.1f},{y1:.1f} L{x2:.1f},{y2:.1f}"
        else:
            d = f"M{x1:.1f},{y1:.1f} L{mx:.1f},{y1:.1f} L{mx:.1f},{y2:.1f} L{x2:.1f},{y2:.1f}"
        if is_crit:
            color, sw, marker, op = CRITICAL_COLOR, "3.5", "url(#arr_crit)", "0.88"
        else:
            color, sw, marker, op = INK_SOFT, "2", "url(#arr_dep)", "0.55"
        custom.append(
            f'<path d="{d}" stroke="{color}" stroke-width="{sw}" fill="none" opacity="{op}" marker-end="{marker}"/>'
        )

# X-axis timeline label (below axis tick labels)
tl_x = plot_left + plot_w / 2
tl_y = plot_top + plot_h + 90
custom.append(
    f'<text x="{tl_x:.1f}" y="{tl_y:.1f}" font-size="42" fill="{INK}" '
    f'font-family="Consolas, monospace" text-anchor="middle" font-weight="600">'
    "Project Timeline (Jan – Jun 2025)</text>"
)

# Bottom legend — category color swatches + critical path indicator
ly = plot_top + plot_h + 145
lx = plot_left + 10
sp = min(475, int((3200 - lx - 360) // 5))

for idx, cat in enumerate(categories):
    x = lx + idx * sp
    color = CAT_COLORS[cat]
    custom.append(f'<rect x="{x:.1f}" y="{ly:.1f}" width="30" height="30" fill="{color}" rx="3"/>')
    custom.append(
        f'<text x="{x + 38:.1f}" y="{ly + 24:.1f}" font-family="Consolas, monospace" '
        f'font-size="42" fill="{INK}">{cat}</text>'
    )

cpx = lx + 5 * sp
custom.append(
    f'<line x1="{cpx:.1f}" y1="{ly + 13:.1f}" x2="{cpx + 40:.1f}" y2="{ly + 13:.1f}" '
    f'stroke="{CRITICAL_COLOR}" stroke-width="3.5" marker-end="url(#arr_crit)"/>'
)
custom.append(
    f'<text x="{cpx + 52:.1f}" y="{ly + 24:.1f}" font-family="Consolas, monospace" '
    f'font-size="42" fill="{INK}">Critical Path</text>'
)

# Inject custom SVG elements into pygal's rendered output
svg_out = svg_string.replace("</svg>", "\n".join(custom) + "\n</svg>")
svg_out = svg_out.replace(">No data<", "><")

cairosvg.svg2png(bytestring=svg_out.encode(), write_to=f"plot-{THEME}.png")

with open(f"plot-{THEME}.html", "wb") as f:
    f.write(chart.render())
Runnable source as JSON, for any HTTP client: https://api.anyplot.ai/specs/gantt-dependencies/pygal/code. Any spec id and library id listed in llms-full.txt fit the same URL shape; every URL below is complete and callable.
{
  "spec_id": "gantt-dependencies",
  "language": "python",
  "library": "pygal",
  "page": "https://anyplot.ai/gantt-dependencies/python/pygal",
  "hub": "https://anyplot.ai/gantt-dependencies",
  "code_json": "https://api.anyplot.ai/specs/gantt-dependencies/pygal/code",
  "spec_json": "https://api.anyplot.ai/specs/gantt-dependencies",
  "render_light_png": "https://storage.googleapis.com/anyplot-images/plots/gantt-dependencies/python/pygal/plot-light.png",
  "render_dark_png": "https://storage.googleapis.com/anyplot-images/plots/gantt-dependencies/python/pygal/plot-dark.png",
  "interactive_light_html": "https://storage.googleapis.com/anyplot-images/plots/gantt-dependencies/python/pygal/plot-light.html",
  "interactive_dark_html": "https://storage.googleapis.com/anyplot-images/plots/gantt-dependencies/python/pygal/plot-dark.html",
  "quality_score": 87.0,
  "license": "MIT",
  "guide": "https://anyplot.ai/llms.txt"
}
Part of Gantt Chart with Dependencies on anyplot.ai.