The same plot in 14 other libraries — JavaScript: Chart.js, D3.js, Highcharts, MUI X Charts; Python: Altair, Bokeh, lets-plot, Matplotlib, Plotly, plotnine, Pygal, Seaborn; R: ggplot2; Julia: Makie.jl. Compare all 15 side by side: Gantt Chart with Dependencies in Python, R, Julia and JavaScript.
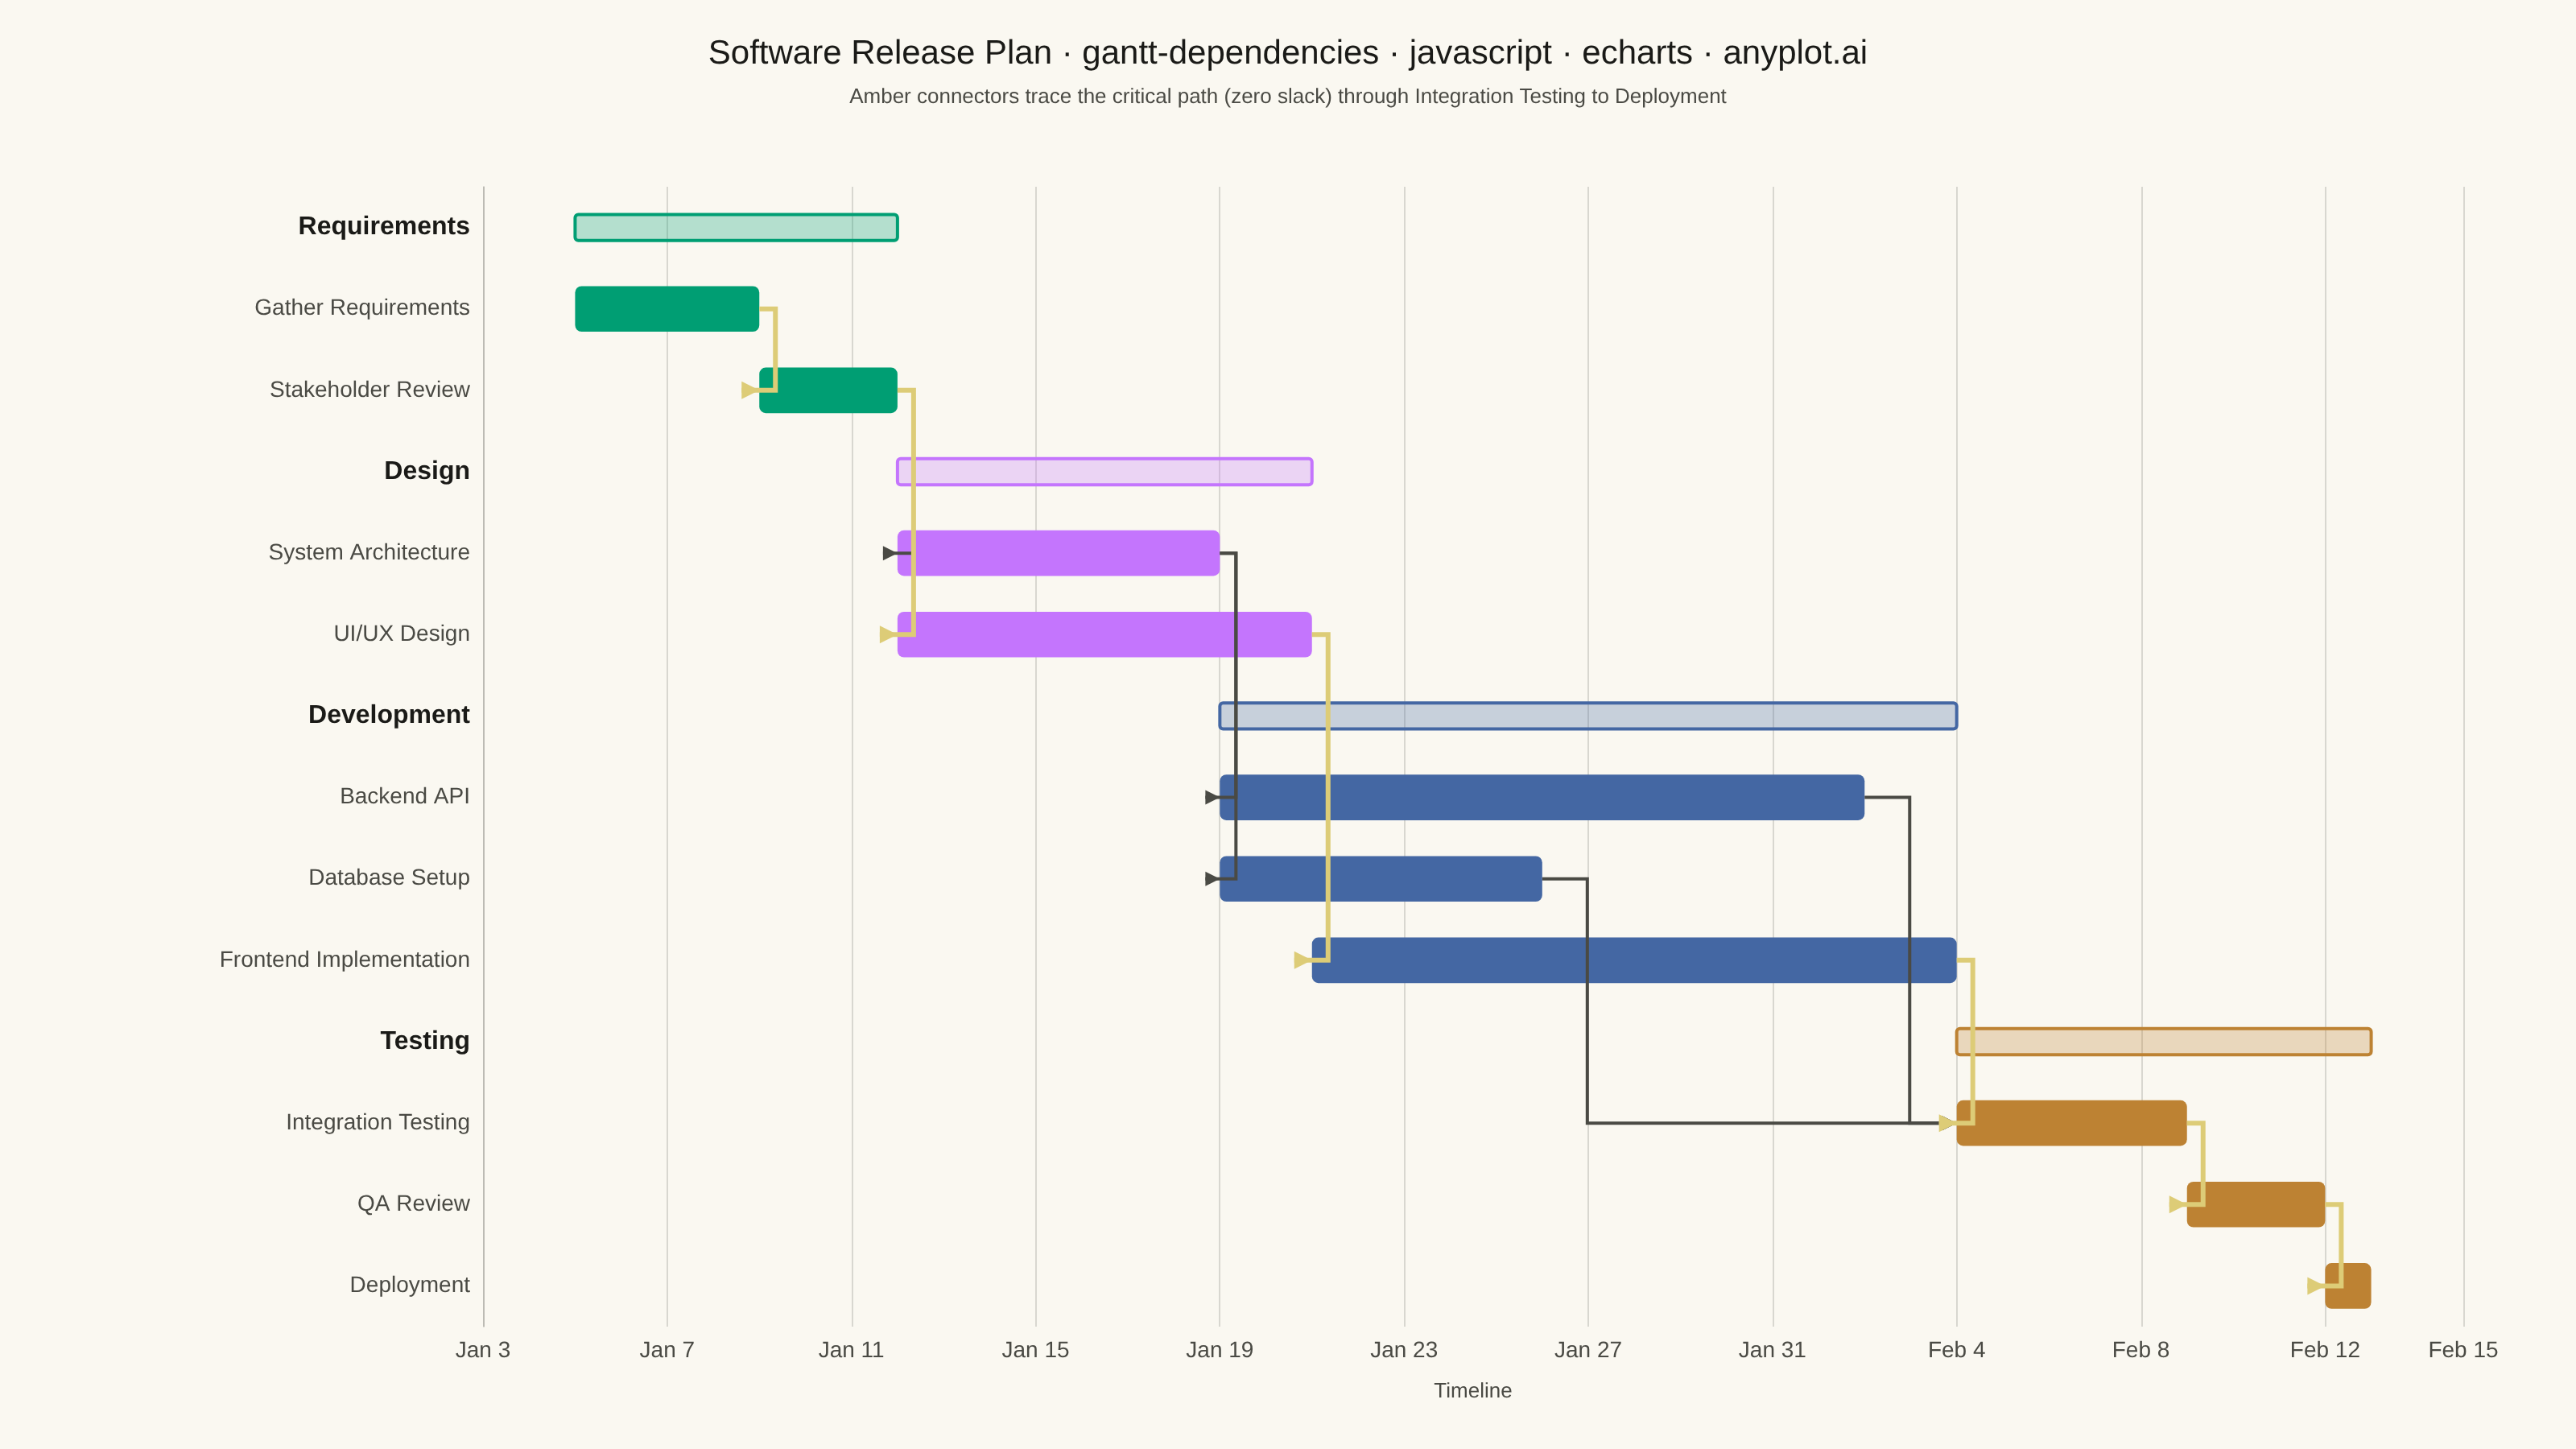
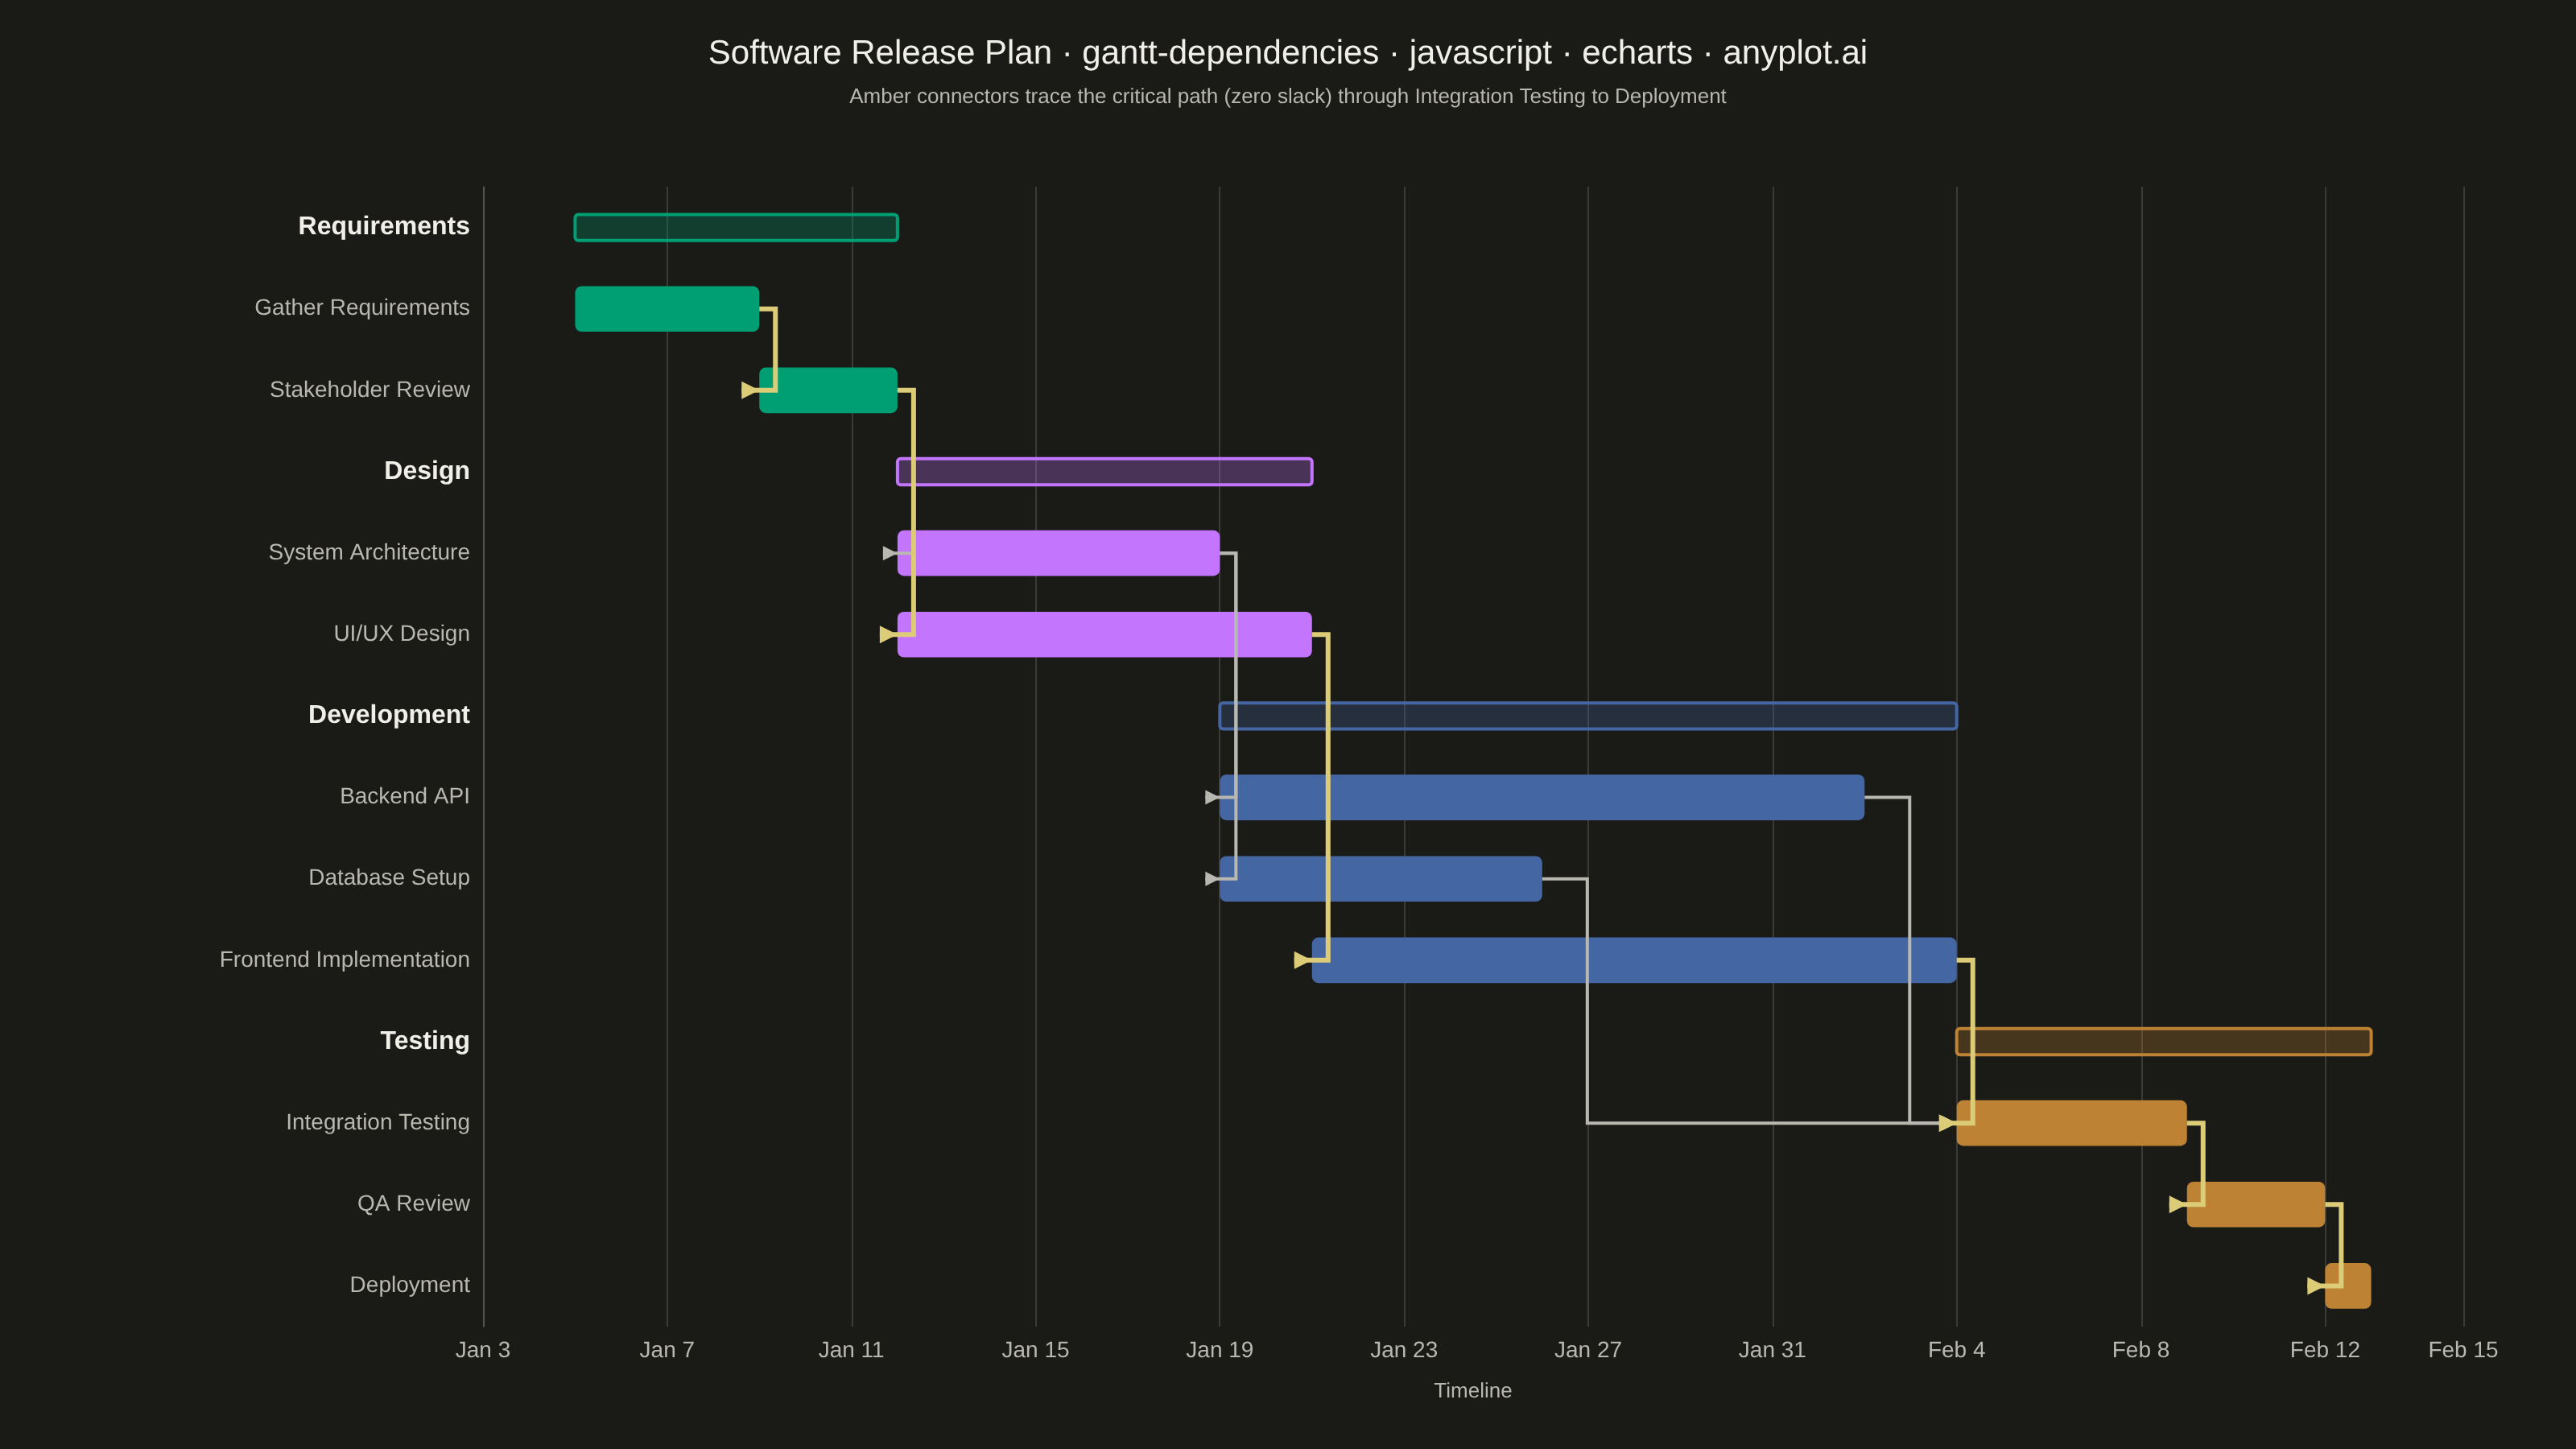
A Gantt chart that visualizes project schedules with task dependencies and groupings. Beyond displaying task timelines, this chart shows relationships between tasks using connector arrows, indicating which tasks must complete before others can begin. Tasks can be organized into groups (phases or work packages) with aggregate timeline bars showing the span of each group. This visualization is essential for understanding critical paths and scheduling constraints in complex projects.
// anyplot.ai
// gantt-dependencies: Gantt Chart with Dependencies
// Library: echarts 6.1.0 | JavaScript 22.23.2
// Quality: 92/100 | Created: 2026-08-25
//# anyplot-orientation: landscape

const t = window.ANYPLOT_TOKENS;

// --- Data (in-memory, deterministic) ----------------------------------------
// Software release plan: four sequential phases, each a group of dependent tasks.
const day = (year, month, date) => Date.UTC(year, month - 1, date);

const rows = [
  { name: "Requirements", isGroup: true },
  { name: "Gather Requirements", group: "Requirements", start: day(2026, 1, 5), end: day(2026, 1, 9), deps: [] },
  { name: "Stakeholder Review", group: "Requirements", start: day(2026, 1, 9), end: day(2026, 1, 12), deps: ["Gather Requirements"] },
  { name: "Design", isGroup: true },
  { name: "System Architecture", group: "Design", start: day(2026, 1, 12), end: day(2026, 1, 19), deps: ["Stakeholder Review"] },
  { name: "UI/UX Design", group: "Design", start: day(2026, 1, 12), end: day(2026, 1, 21), deps: ["Stakeholder Review"] },
  { name: "Development", isGroup: true },
  { name: "Backend API", group: "Development", start: day(2026, 1, 19), end: day(2026, 2, 2), deps: ["System Architecture"] },
  { name: "Database Setup", group: "Development", start: day(2026, 1, 19), end: day(2026, 1, 26), deps: ["System Architecture"] },
  { name: "Frontend Implementation", group: "Development", start: day(2026, 1, 21), end: day(2026, 2, 4), deps: ["UI/UX Design"] },
  { name: "Testing", isGroup: true },
  { name: "Integration Testing", group: "Testing", start: day(2026, 2, 4), end: day(2026, 2, 9), deps: ["Backend API", "Database Setup", "Frontend Implementation"] },
  { name: "QA Review", group: "Testing", start: day(2026, 2, 9), end: day(2026, 2, 12), deps: ["Integration Testing"] },
  { name: "Deployment", group: "Testing", start: day(2026, 2, 12), end: day(2026, 2, 13), deps: ["QA Review"] },
];

// Group headers show the aggregate span of their child tasks.
rows.forEach((row) => {
  if (!row.isGroup) return;
  const children = rows.filter((r) => r.group === row.name);
  row.start = Math.min(...children.map((r) => r.start));
  row.end = Math.max(...children.map((r) => r.end));
});

const rowIndex = new Map(rows.map((row, i) => [row.name, i]));
const groupColor = {
  Requirements: t.palette[0],
  Design: t.palette[1],
  Development: t.palette[2],
  Testing: t.palette[3],
};

function hexToRgba(hex, alpha) {
  const r = parseInt(hex.slice(1, 3), 16);
  const g = parseInt(hex.slice(3, 5), 16);
  const b = parseInt(hex.slice(5, 7), 16);
  return `rgba(${r}, ${g}, ${b}, ${alpha})`;
}

// One bar per row — group headers render as thin outlined spans, tasks as solid bars.
const barData = rows.map((row, i) => {
  const color = groupColor[row.group || row.name];
  return {
    value: [i, row.start, row.end, row.isGroup ? 1 : 0],
    itemStyle: row.isGroup
      ? { color: hexToRgba(color, 0.28), borderColor: color, borderWidth: 2 }
      : { color },
  };
});

// Critical path (CPM forward/backward pass): a dependency edge is on the
// critical path when both ends have zero slack against the fixed schedule
// and the edge itself is the tight one (no idle gap) — this is what
// distinguishes the true scheduling bottleneck (e.g. Frontend Implementation
// feeding Integration Testing) from a converging predecessor with slack
// (e.g. Database Setup, which finishes days early).
const taskRows = rows.filter((r) => !r.isGroup);
const successorsOf = new Map(taskRows.map((r) => [r.name, []]));
taskRows.forEach((r) => (r.deps || []).forEach((dep) => successorsOf.get(dep).push(r.name)));
const taskByName = new Map(taskRows.map((r) => [r.name, r]));
const projectFinish = Math.max(...taskRows.map((r) => r.end));

const lateFinish = new Map();
for (let i = taskRows.length - 1; i >= 0; i--) {
  const r = taskRows[i];
  const succs = successorsOf.get(r.name);
  lateFinish.set(
    r.name,
    succs.length
      ? Math.min(...succs.map((s) => lateFinish.get(s) - (taskByName.get(s).end - taskByName.get(s).start)))
      : projectFinish
  );
}
const isCritical = (name) => {
  const r = taskByName.get(name);
  return lateFinish.get(name) - (r.end - r.start) === r.start;
};

// Dependency edges: predecessor's end (finish) -> successor's start.
const depData = [];
rows.forEach((row) => {
  if (!row.deps) return;
  row.deps.forEach((predName) => {
    const pred = rows[rowIndex.get(predName)];
    const critical = pred.end === row.start && isCritical(predName) && isCritical(row.name);
    depData.push({ value: [rowIndex.get(predName), pred.end, rowIndex.get(row.name), row.start, critical ? 1 : 0] });
  });
});
depData.sort((a, b) => a.value[4] - b.value[4]); // critical-path arrows paint last, on top

function renderTask(params, api) {
  const idx = api.value(0);
  const isGroup = api.value(3) === 1;
  const start = api.coord([api.value(1), idx]);
  const end = api.coord([api.value(2), idx]);
  const rowHeight = api.size([0, 1])[1];
  const barHeight = isGroup ? rowHeight * 0.32 : rowHeight * 0.56;
  const shape = echarts.graphic.clipRectByRect(
    { x: start[0], y: start[1] - barHeight / 2, width: Math.max(end[0] - start[0], 2), height: barHeight },
    { x: params.coordSys.x, y: params.coordSys.y, width: params.coordSys.width, height: params.coordSys.height }
  );
  if (shape) shape.r = isGroup ? 2 : 4;
  return shape && { type: "rect", shape, style: api.style() };
}

// Elbow connector (horizontal-vertical-horizontal) with an arrowhead landing on
// the successor's left edge — keeps the line out of the row band between the
// two tasks rather than cutting diagonally across intermediate bars. Edges on
// the critical path render bolder and in accent amber so the scheduling
// bottleneck reads at a glance.
function renderDependency(params, api) {
  const p1 = api.coord([api.value(1), api.value(0)]);
  const p2 = api.coord([api.value(3), api.value(2)]);
  const critical = api.value(4) === 1;
  const stroke = critical ? t.amber : t.inkSoft;
  const lineWidth = critical ? 3 : 2;
  const arrow = critical ? 11 : 9;
  const gap = Math.min(28, Math.max((p2[0] - p1[0]) / 2, 10));
  const midX = p1[0] + gap;
  return {
    type: "group",
    children: [
      {
        type: "polyline",
        shape: {
          points: [
            [p1[0], p1[1]],
            [midX, p1[1]],
            [midX, p2[1]],
            [p2[0] - arrow, p2[1]],
          ],
        },
        style: { stroke, lineWidth, fill: "none" },
      },
      {
        type: "polygon",
        shape: {
          points: [
            [p2[0], p2[1]],
            [p2[0] - arrow, p2[1] - arrow / 2],
            [p2[0] - arrow, p2[1] + arrow / 2],
          ],
        },
        style: { fill: stroke },
      },
    ],
  };
}

function formatDate(ts) {
  const months = ["Jan", "Feb", "Mar", "Apr", "May", "Jun", "Jul", "Aug", "Sep", "Oct", "Nov", "Dec"];
  const dt = new Date(ts);
  return `${months[dt.getUTCMonth()]} ${dt.getUTCDate()}`;
}

function formatRowLabel(name, index) {
  return rows[index].isGroup ? `{group|${name}}` : `{task|${name}}`;
}

const title = "Software Release Plan · gantt-dependencies · javascript · echarts · anyplot.ai";
const titleFontSize = title.length > 67 ? Math.round(24 * (67 / title.length)) : 24;

const minStart = Math.min(...rows.map((r) => r.start));
const maxEnd = Math.max(...rows.map((r) => r.end));
const pad = 2 * 24 * 60 * 60 * 1000; // 2-day breathing room on each side

// --- Init --------------------------------------------------------------------
const chart = echarts.init(document.getElementById("container"));

// --- Option --------------------------------------------------------------------
chart.setOption({
  animation: false,
  backgroundColor: "transparent",
  title: {
    text: title,
    subtext: "Amber connectors trace the critical path (zero slack) through Integration Testing to Deployment",
    left: "center",
    top: 18,
    textStyle: { color: t.ink, fontSize: titleFontSize, fontWeight: 500 },
    subtextStyle: { color: t.inkSoft, fontSize: 13 },
  },
  grid: { left: 300, right: 70, top: 116, bottom: 76 },
  xAxis: {
    // A plain value axis (timestamps in ms) rather than type "time" — the
    // "time" axis's automatic "nice" tick picker always adds a tick at each
    // month boundary in addition to its regular interval, which can land the
    // two ticks a single day apart and overlap. A value axis honors a fixed
    // "interval" exactly, so a 4-day cadence is guaranteed to space out labels.
    type: "value",
    min: minStart - pad,
    max: maxEnd + pad,
    interval: 4 * 24 * 60 * 60 * 1000,
    name: "Timeline",
    nameLocation: "middle",
    nameGap: 34,
    nameTextStyle: { color: t.inkSoft, fontSize: 13 },
    axisLabel: { color: t.inkSoft, fontSize: 14, formatter: formatDate },
    axisLine: { lineStyle: { color: t.grid, width: 1 } },
    axisTick: { show: false },
    splitLine: { show: true, lineStyle: { color: t.grid } },
  },
  yAxis: {
    type: "category",
    inverse: true,
    data: rows.map((r) => r.name),
    axisLabel: {
      fontSize: 15,
      formatter: formatRowLabel,
      rich: {
        group: { color: t.ink, fontWeight: 700, fontSize: 16 },
        task: { color: t.inkSoft, fontSize: 14, padding: [0, 0, 0, 22] },
      },
    },
    axisLine: { lineStyle: { color: t.grid, width: 1 } },
    axisTick: { show: false },
    splitLine: { show: false },
  },
  series: [
    { type: "custom", name: "Tasks", renderItem: renderTask, encode: { x: [1, 2], y: 0 }, data: barData, z: 2 },
    { type: "custom", name: "Dependencies", renderItem: renderDependency, data: depData, silent: true, z: 3 },
  ],
});
chart.on("finished", () => {
  window.__anyplotReady = true;
});
Runnable source as JSON, for any HTTP client: https://api.anyplot.ai/specs/gantt-dependencies/echarts/code. Any spec id and library id listed in llms-full.txt fit the same URL shape; every URL below is complete and callable.
{
  "spec_id": "gantt-dependencies",
  "language": "javascript",
  "library": "echarts",
  "page": "https://anyplot.ai/gantt-dependencies/javascript/echarts",
  "hub": "https://anyplot.ai/gantt-dependencies",
  "code_json": "https://api.anyplot.ai/specs/gantt-dependencies/echarts/code",
  "spec_json": "https://api.anyplot.ai/specs/gantt-dependencies",
  "render_light_png": "https://storage.googleapis.com/anyplot-images/plots/gantt-dependencies/javascript/echarts/plot-light.png",
  "render_dark_png": "https://storage.googleapis.com/anyplot-images/plots/gantt-dependencies/javascript/echarts/plot-dark.png",
  "interactive_light_html": "https://storage.googleapis.com/anyplot-images/plots/gantt-dependencies/javascript/echarts/plot-light.html",
  "interactive_dark_html": "https://storage.googleapis.com/anyplot-images/plots/gantt-dependencies/javascript/echarts/plot-dark.html",
  "quality_score": 92.0,
  "license": "MIT",
  "guide": "https://anyplot.ai/llms.txt"
}
Part of Gantt Chart with Dependencies on anyplot.ai.