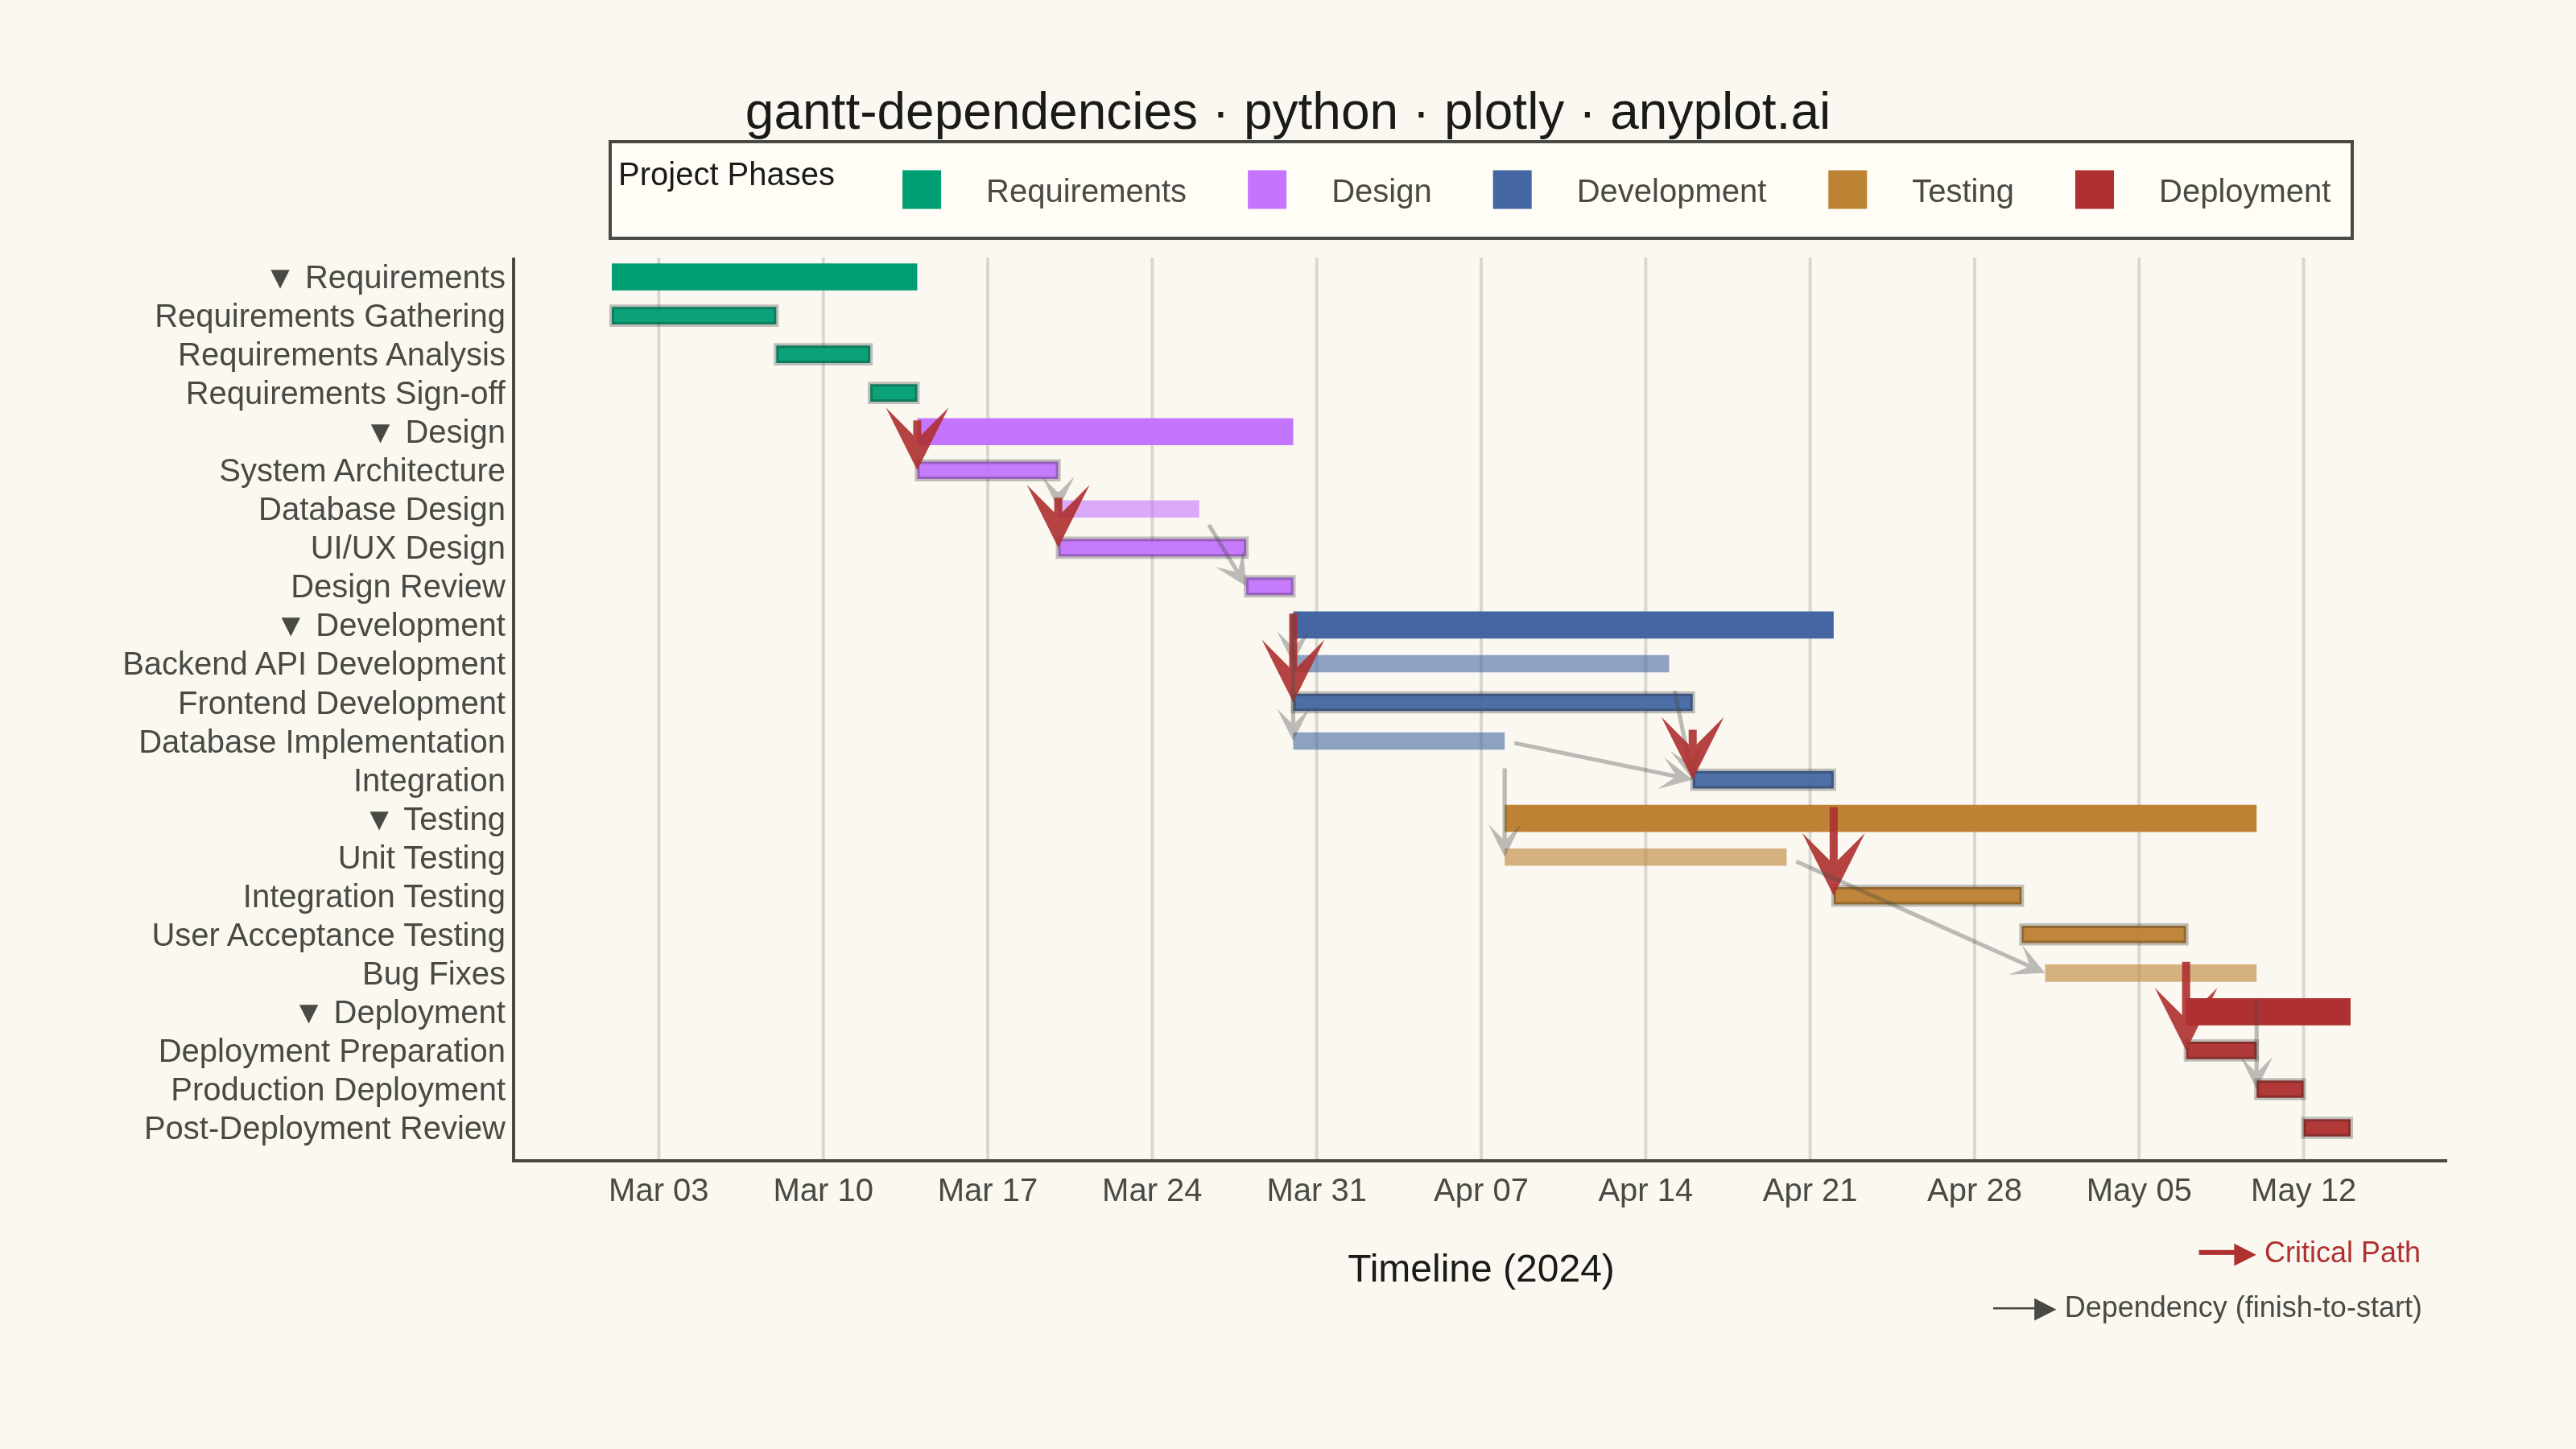
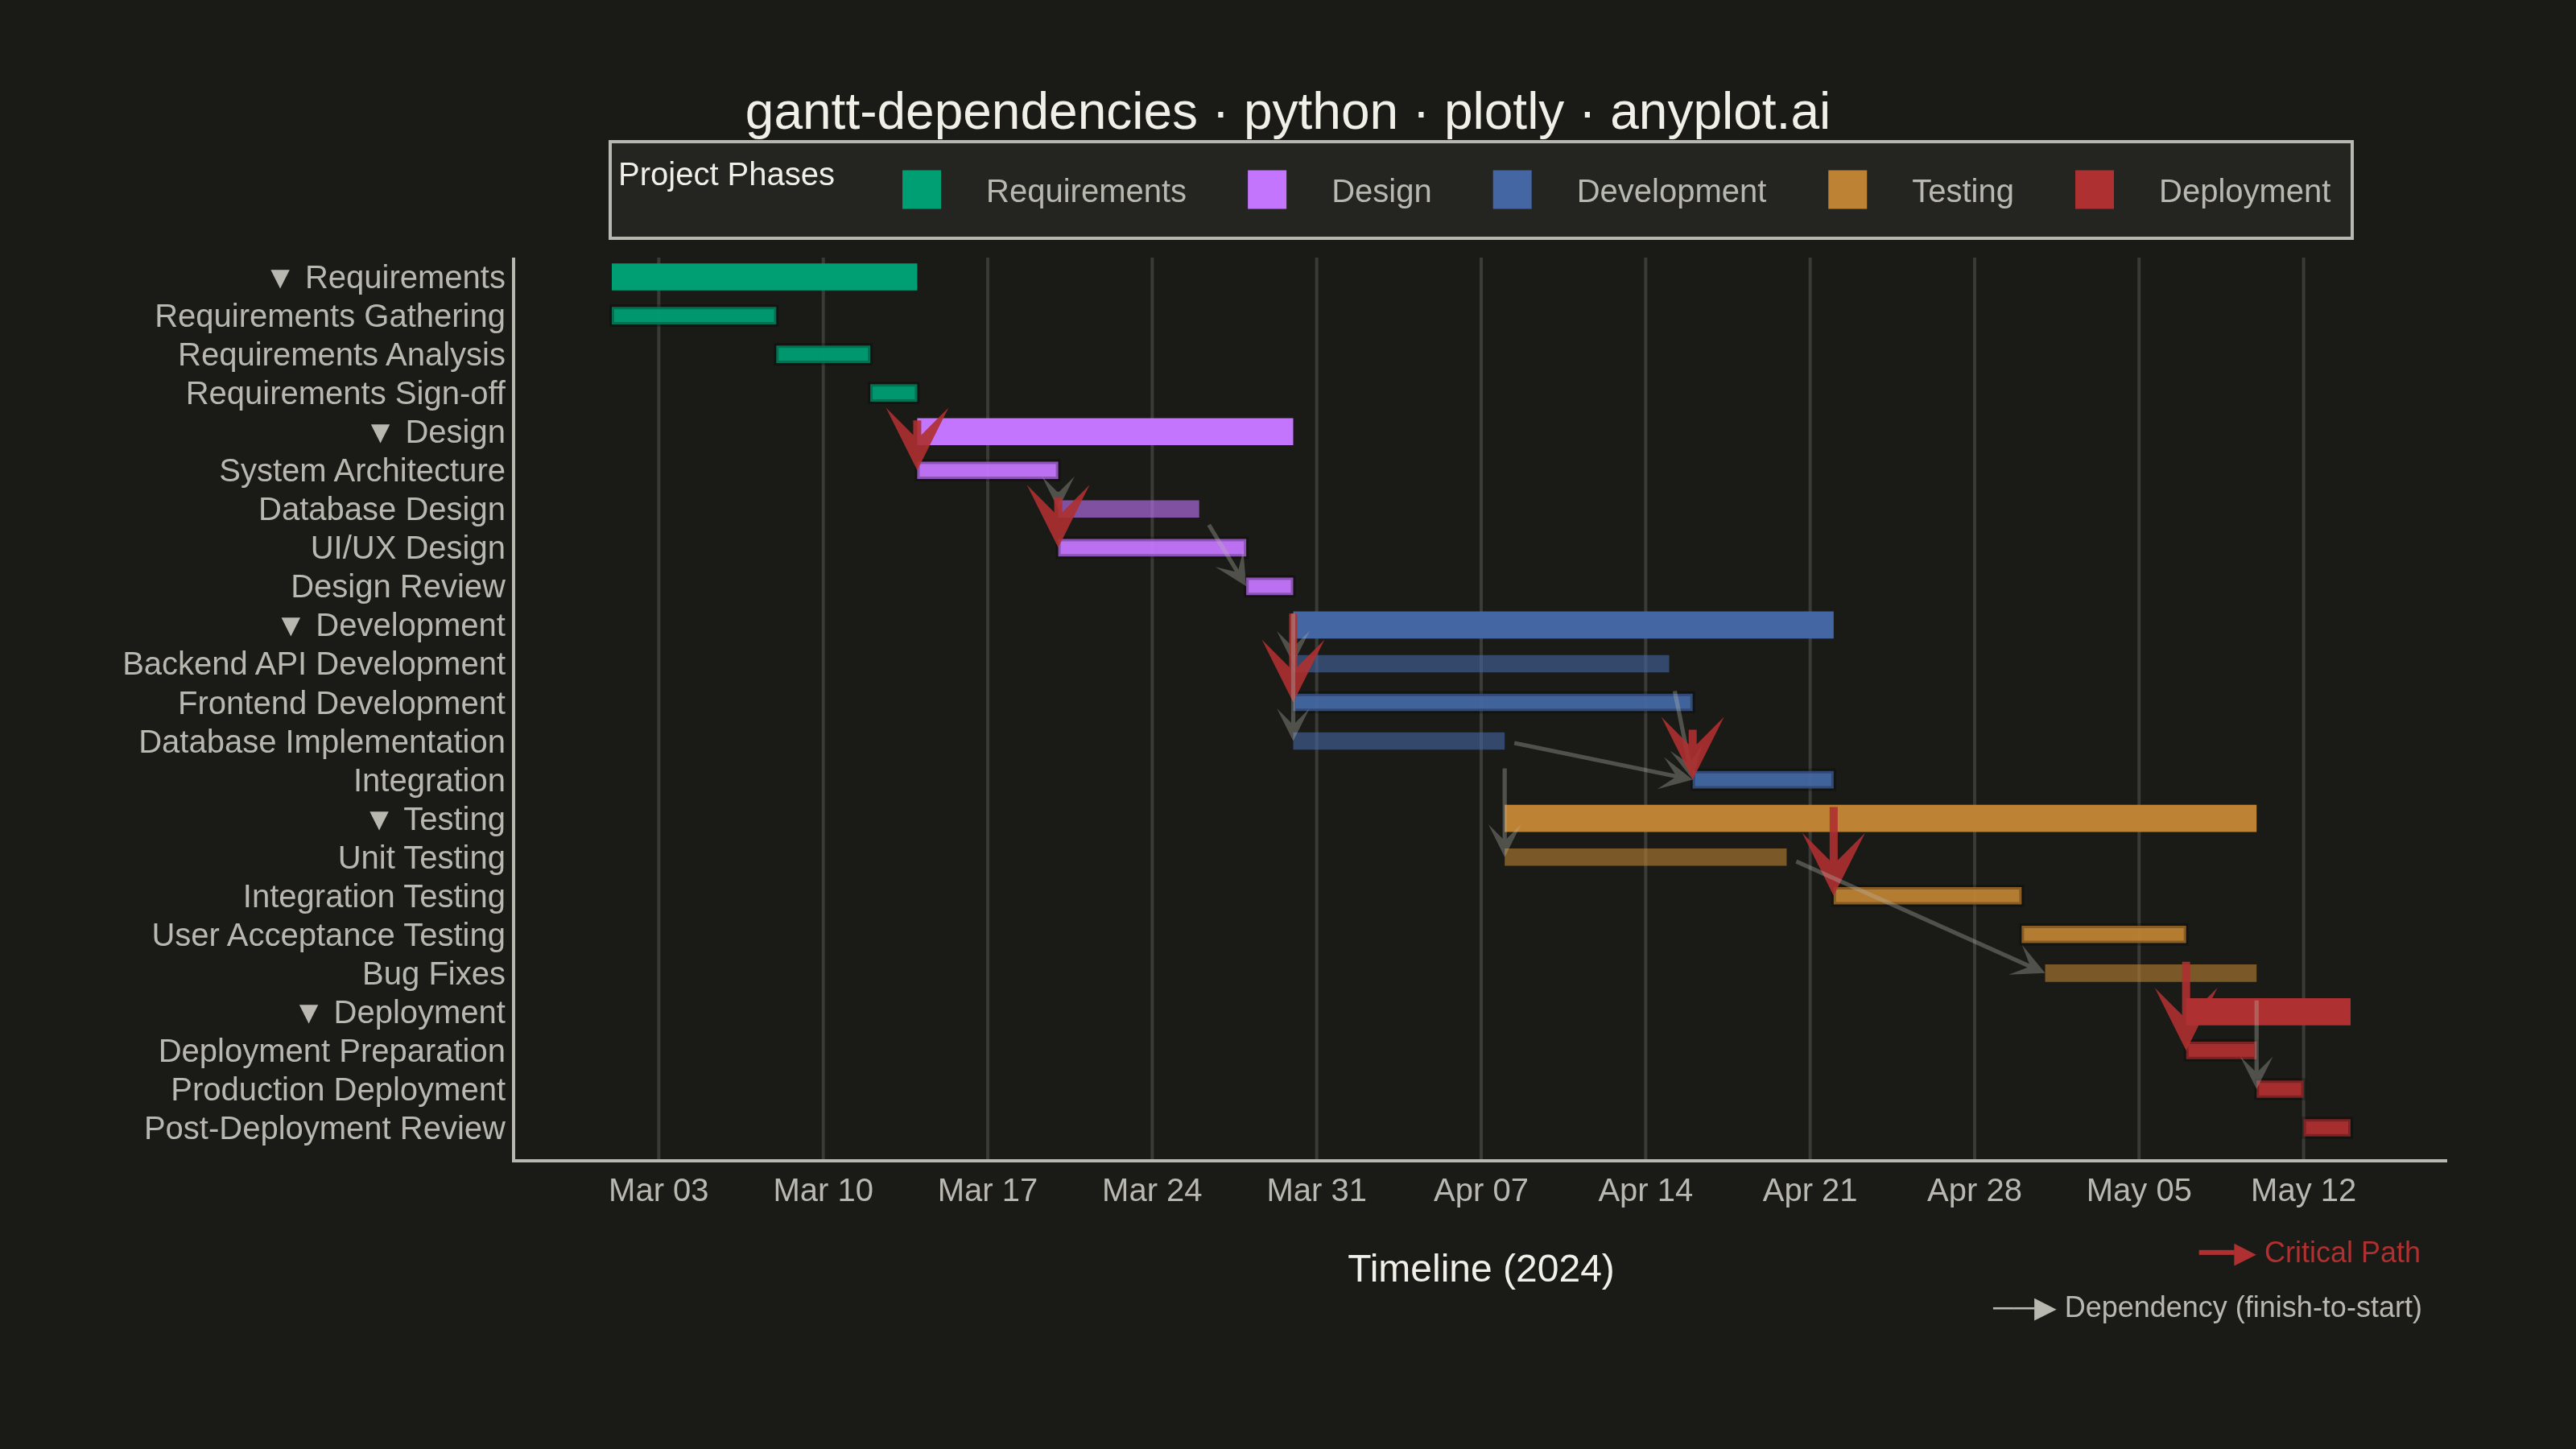
A Gantt chart that visualizes project schedules with task dependencies and groupings. Beyond displaying task timelines, this chart shows relationships between tasks using connector arrows, indicating which tasks must complete before others can begin. Tasks can be organized into groups (phases or work packages) with aggregate timeline bars showing the span of each group. This visualization is essential for understanding critical paths and scheduling constraints in complex projects.
""" anyplot.ai
gantt-dependencies: Gantt Chart with Dependencies
Library: plotly 6.7.0 | Python 3.13.13
Quality: 92/100 | Updated: 2026-06-02
"""

import os
import sys


# Prevent this file from shadowing the installed plotly package
_this_dir = os.path.dirname(os.path.abspath(__file__))
sys.path = [p for p in sys.path if os.path.abspath(p) != _this_dir]

import pandas as pd
import plotly.graph_objects as go


THEME = os.getenv("ANYPLOT_THEME", "light")

# Imprint palette — theme-adaptive chrome
PAGE_BG = "#FAF8F1" if THEME == "light" else "#1A1A17"
ELEVATED_BG = "#FFFDF6" if THEME == "light" else "#242420"
INK = "#1A1A17" if THEME == "light" else "#F0EFE8"
INK_SOFT = "#4A4A44" if THEME == "light" else "#B8B7B0"
INK_MUTED = "#6B6A63" if THEME == "light" else "#A8A79F"
GRID = "rgba(26,26,23,0.15)" if THEME == "light" else "rgba(240,239,232,0.15)"

# Imprint categorical palette — positions 1–5, canonical order
IMPRINT_PALETTE = ["#009E73", "#C475FD", "#4467A3", "#BD8233", "#AE3030"]

# Data — Software Development Project with phases and dependencies
tasks = [
    # Requirements Phase
    {
        "task": "Requirements Gathering",
        "start": "2024-03-01",
        "end": "2024-03-08",
        "group": "Requirements",
        "depends_on": [],
    },
    {
        "task": "Requirements Analysis",
        "start": "2024-03-08",
        "end": "2024-03-12",
        "group": "Requirements",
        "depends_on": ["Requirements Gathering"],
    },
    {
        "task": "Requirements Sign-off",
        "start": "2024-03-12",
        "end": "2024-03-14",
        "group": "Requirements",
        "depends_on": ["Requirements Analysis"],
    },
    # Design Phase
    {
        "task": "System Architecture",
        "start": "2024-03-14",
        "end": "2024-03-20",
        "group": "Design",
        "depends_on": ["Requirements Sign-off"],
    },
    {
        "task": "Database Design",
        "start": "2024-03-20",
        "end": "2024-03-26",
        "group": "Design",
        "depends_on": ["System Architecture"],
    },
    {
        "task": "UI/UX Design",
        "start": "2024-03-20",
        "end": "2024-03-28",
        "group": "Design",
        "depends_on": ["System Architecture"],
    },
    {
        "task": "Design Review",
        "start": "2024-03-28",
        "end": "2024-03-30",
        "group": "Design",
        "depends_on": ["Database Design", "UI/UX Design"],
    },
    # Development Phase
    {
        "task": "Backend API Development",
        "start": "2024-03-30",
        "end": "2024-04-15",
        "group": "Development",
        "depends_on": ["Design Review"],
    },
    {
        "task": "Frontend Development",
        "start": "2024-03-30",
        "end": "2024-04-16",
        "group": "Development",
        "depends_on": ["Design Review"],
    },
    {
        "task": "Database Implementation",
        "start": "2024-03-30",
        "end": "2024-04-08",
        "group": "Development",
        "depends_on": ["Design Review"],
    },
    {
        "task": "Integration",
        "start": "2024-04-16",
        "end": "2024-04-22",
        "group": "Development",
        "depends_on": ["Backend API Development", "Frontend Development", "Database Implementation"],
    },
    # Testing Phase
    {
        "task": "Unit Testing",
        "start": "2024-04-08",
        "end": "2024-04-20",
        "group": "Testing",
        "depends_on": ["Database Implementation"],
    },
    {
        "task": "Integration Testing",
        "start": "2024-04-22",
        "end": "2024-04-30",
        "group": "Testing",
        "depends_on": ["Integration"],
    },
    {
        "task": "User Acceptance Testing",
        "start": "2024-04-30",
        "end": "2024-05-07",
        "group": "Testing",
        "depends_on": ["Integration Testing"],
    },
    {
        "task": "Bug Fixes",
        "start": "2024-05-01",
        "end": "2024-05-10",
        "group": "Testing",
        "depends_on": ["Unit Testing"],
    },
    # Deployment Phase
    {
        "task": "Deployment Preparation",
        "start": "2024-05-07",
        "end": "2024-05-10",
        "group": "Deployment",
        "depends_on": ["User Acceptance Testing"],
    },
    {
        "task": "Production Deployment",
        "start": "2024-05-10",
        "end": "2024-05-12",
        "group": "Deployment",
        "depends_on": ["Deployment Preparation", "Bug Fixes"],
    },
    {
        "task": "Post-Deployment Review",
        "start": "2024-05-12",
        "end": "2024-05-14",
        "group": "Deployment",
        "depends_on": ["Production Deployment"],
    },
]

df = pd.DataFrame(tasks)
df["start"] = pd.to_datetime(df["start"])
df["end"] = pd.to_datetime(df["end"])

# Group colors — Imprint palette canonical order
group_order = ["Requirements", "Design", "Development", "Testing", "Deployment"]
group_colors = dict(zip(group_order, IMPRINT_PALETTE, strict=False))

# Compute critical path by backward traversal from project end
task_deps = {row["task"]: row["depends_on"] for _, row in df.iterrows()}
task_ends = {row["task"]: row["end"] for _, row in df.iterrows()}

all_predecessors = {dep for deps in task_deps.values() for dep in deps}
terminal_tasks = [t for t in task_deps if t not in all_predecessors]
last_task = max(terminal_tasks, key=lambda t: task_ends[t])

critical_path = set()
critical_edges = set()
current = last_task
while current:
    critical_path.add(current)
    deps = task_deps[current]
    if not deps:
        break
    binding = max(deps, key=lambda d: task_ends[d])
    critical_edges.add((binding, current))
    current = binding

# Build ordered task list (group headers + indented tasks)
groups_agg = df.groupby("group").agg({"start": "min", "end": "max"}).reset_index()

ordered_items = []
task_y_labels = {}
for group in group_order:
    ordered_items.append({"label": f"▼ {group}", "is_group": True, "group": group})
    for _, row in df[df["group"] == group].sort_values("start").iterrows():
        label = f"   {row['task']}"
        ordered_items.append({"label": label, "is_group": False, "task": row})
        task_y_labels[row["task"]] = label

y_categories = [item["label"] for item in ordered_items]

# Create figure
fig = go.Figure()

# Draw bars
for group in group_order:
    color = group_colors[group]
    g = groups_agg[groups_agg["group"] == group].iloc[0]
    dur_ms = (g["end"] - g["start"]).total_seconds() * 1000

    # Group summary bar (wider, shown in legend)
    fig.add_trace(
        go.Bar(
            y=[f"▼ {group}"],
            x=[dur_ms],
            base=[g["start"].isoformat()],
            orientation="h",
            name=group,
            legendgroup=group,
            marker={"color": color, "line": {"width": 0}},
            width=0.7,
            hovertemplate=(
                f"<b>{group} Phase</b><br>"
                f"Start: {g['start'].strftime('%b %d, %Y')}<br>"
                f"End: {g['end'].strftime('%b %d, %Y')}<extra></extra>"
            ),
        )
    )

    # Individual task bars (narrower, hidden from legend)
    for _, task in df[df["group"] == group].sort_values("start").iterrows():
        is_cp = task["task"] in critical_path
        label = task_y_labels[task["task"]]
        dur_ms_task = (task["end"] - task["start"]).total_seconds() * 1000
        dur_days = (task["end"] - task["start"]).days

        fig.add_trace(
            go.Bar(
                y=[label],
                x=[dur_ms_task],
                base=[task["start"].isoformat()],
                orientation="h",
                showlegend=False,
                legendgroup=group,
                marker={
                    "color": color,
                    "opacity": 0.95 if is_cp else 0.6,
                    "line": {"width": 1.5 if is_cp else 0, "color": "rgba(0,0,0,0.25)" if is_cp else "rgba(0,0,0,0)"},
                },
                width=0.45,
                hovertemplate=(
                    f"<b>{task['task']}</b>" + (" ⚡ Critical Path" if is_cp else "") + f"<br>Phase: {group}<br>"
                    f"Start: {task['start'].strftime('%b %d, %Y')}<br>"
                    f"End: {task['end'].strftime('%b %d, %Y')}<br>"
                    f"Duration: {dur_days} days<extra></extra>"
                ),
            )
        )

# Dependency arrows (critical path edges highlighted in Imprint matte-red)
CP_RED = "#AE3030"
for _, task in df.iterrows():
    for dep in task["depends_on"]:
        if dep in task_y_labels:
            pred = df[df["task"] == dep].iloc[0]
            is_cp_edge = (dep, task["task"]) in critical_edges

            fig.add_annotation(
                x=task["start"].isoformat(),
                y=task_y_labels[task["task"]],
                ax=pred["end"].isoformat(),
                ay=task_y_labels[dep],
                xref="x",
                yref="y",
                axref="x",
                ayref="y",
                showarrow=True,
                arrowhead=3,
                arrowsize=1.3,
                arrowwidth=2.5 if is_cp_edge else 1.3,
                arrowcolor=CP_RED if is_cp_edge else INK_SOFT,
                opacity=0.9 if is_cp_edge else 0.35,
            )

# Layout
fig.update_layout(
    autosize=False,
    paper_bgcolor=PAGE_BG,
    plot_bgcolor=PAGE_BG,
    font=dict(color=INK),
    title=dict(
        text="gantt-dependencies · python · plotly · anyplot.ai", font=dict(size=16, color=INK), x=0.5, xanchor="center"
    ),
    xaxis=dict(
        title=dict(text="Timeline (2024)", font=dict(size=12, color=INK)),
        tickfont=dict(size=10, color=INK_SOFT),
        type="date",
        tickformat="%b %d",
        gridcolor=GRID,
        showgrid=True,
        dtick=7 * 24 * 60 * 60 * 1000,
        tickangle=0,
        linecolor=INK_SOFT,
        zerolinecolor=INK_SOFT,
        mirror=False,
    ),
    yaxis=dict(
        tickfont=dict(size=10, color=INK_SOFT),
        categoryorder="array",
        categoryarray=y_categories[::-1],
        showgrid=False,
        linecolor=INK_SOFT,
        mirror=False,
    ),
    barmode="overlay",
    legend=dict(
        title=dict(text="Project Phases", font=dict(size=10, color=INK)),
        font=dict(size=10, color=INK_SOFT),
        bgcolor=ELEVATED_BG,
        bordercolor=INK_SOFT,
        borderwidth=1,
        orientation="h",
        yanchor="bottom",
        y=1.02,
        xanchor="center",
        x=0.5,
        itemwidth=30,
    ),
    margin=dict(l=160, r=40, t=80, b=90),
)

# Dependency type legend (bottom-right annotation)
fig.add_annotation(
    x=0.99,
    y=-0.13,
    xref="paper",
    yref="paper",
    text="━━▶ Critical Path",
    showarrow=False,
    font=dict(size=9, color=CP_RED),
    xanchor="right",
)
fig.add_annotation(
    x=0.99,
    y=-0.19,
    xref="paper",
    yref="paper",
    text="──▶ Dependency (finish-to-start)",
    showarrow=False,
    font=dict(size=9, color=INK_SOFT),
    xanchor="right",
)

# Save — landscape 3200×1800
fig.write_image(f"plot-{THEME}.png", width=800, height=450, scale=4)
fig.write_html(f"plot-{THEME}.html", include_plotlyjs="cdn")
Runnable source as JSON, for any HTTP client: https://api.anyplot.ai/specs/gantt-dependencies/plotly/code. Any spec id and library id listed in llms-full.txt fit the same URL shape; every URL below is complete and callable.
{
  "spec_id": "gantt-dependencies",
  "language": "python",
  "library": "plotly",
  "page": "https://anyplot.ai/gantt-dependencies/python/plotly",
  "hub": "https://anyplot.ai/gantt-dependencies",
  "code_json": "https://api.anyplot.ai/specs/gantt-dependencies/plotly/code",
  "spec_json": "https://api.anyplot.ai/specs/gantt-dependencies",
  "render_light_png": "https://storage.googleapis.com/anyplot-images/plots/gantt-dependencies/python/plotly/plot-light.png",
  "render_dark_png": "https://storage.googleapis.com/anyplot-images/plots/gantt-dependencies/python/plotly/plot-dark.png",
  "interactive_light_html": "https://storage.googleapis.com/anyplot-images/plots/gantt-dependencies/python/plotly/plot-light.html",
  "interactive_dark_html": "https://storage.googleapis.com/anyplot-images/plots/gantt-dependencies/python/plotly/plot-dark.html",
  "quality_score": 92.0,
  "license": "MIT",
  "guide": "https://anyplot.ai/llms.txt"
}
Part of Gantt Chart with Dependencies on anyplot.ai.