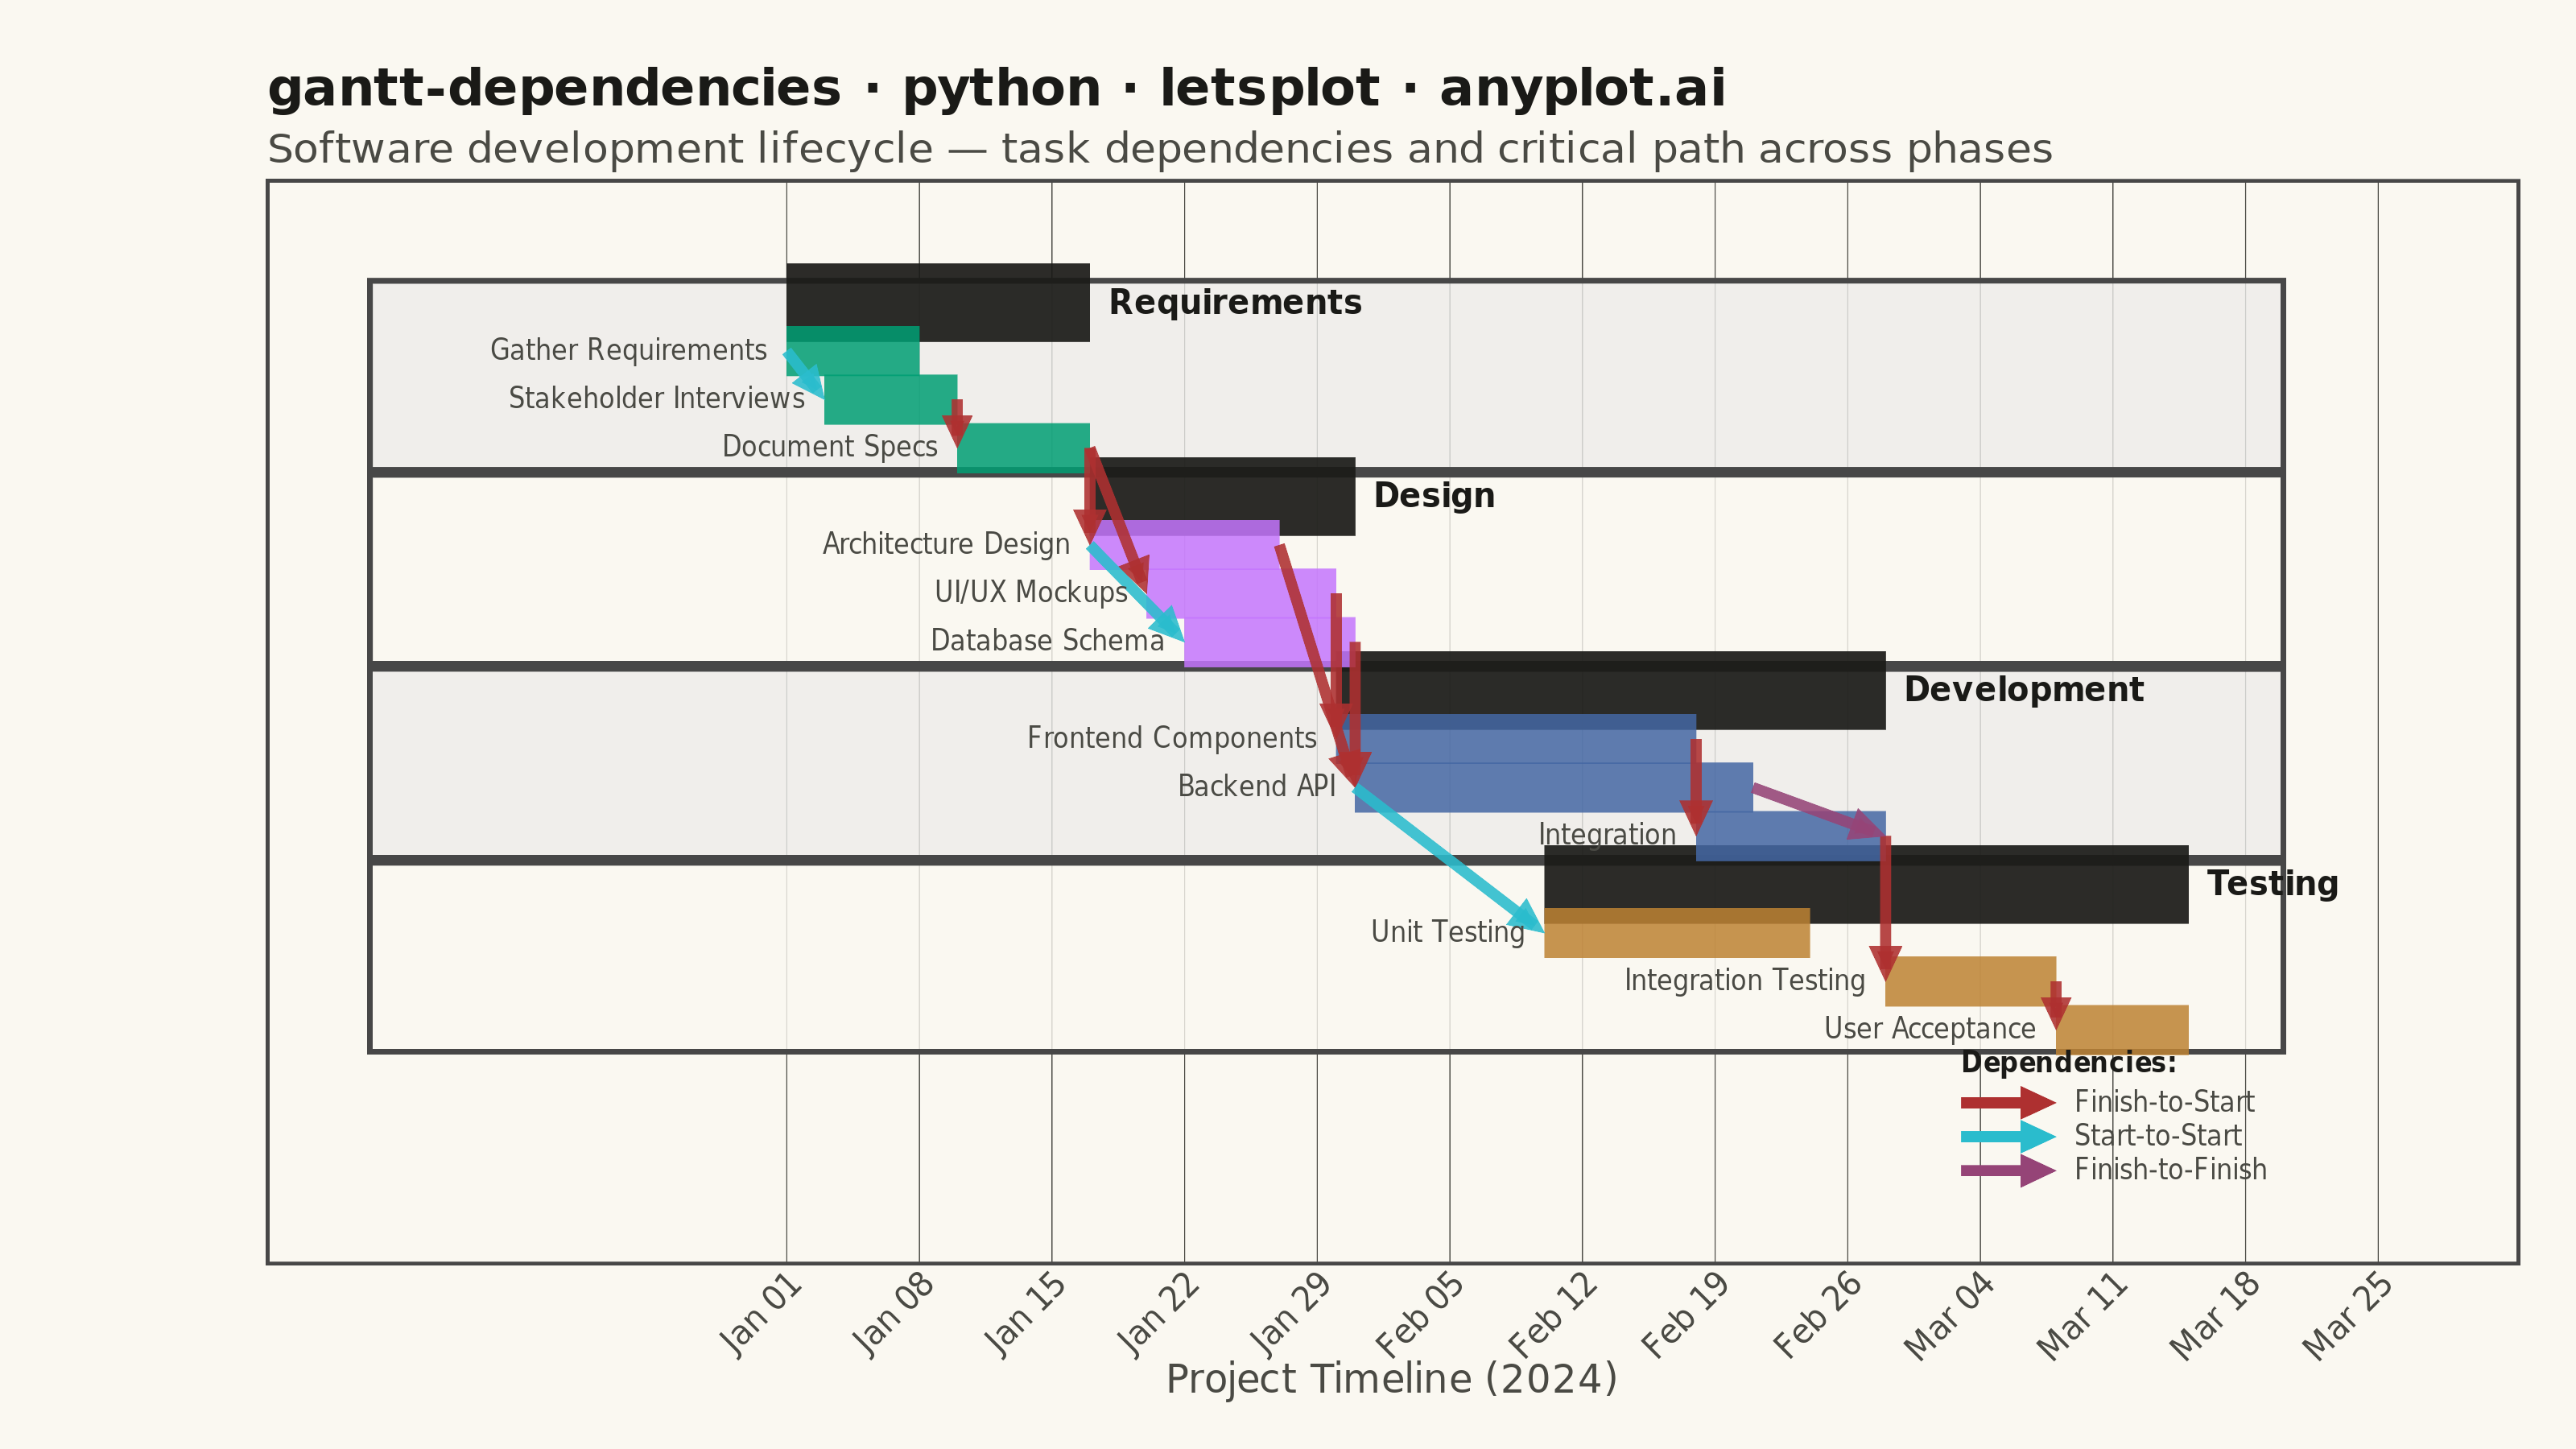
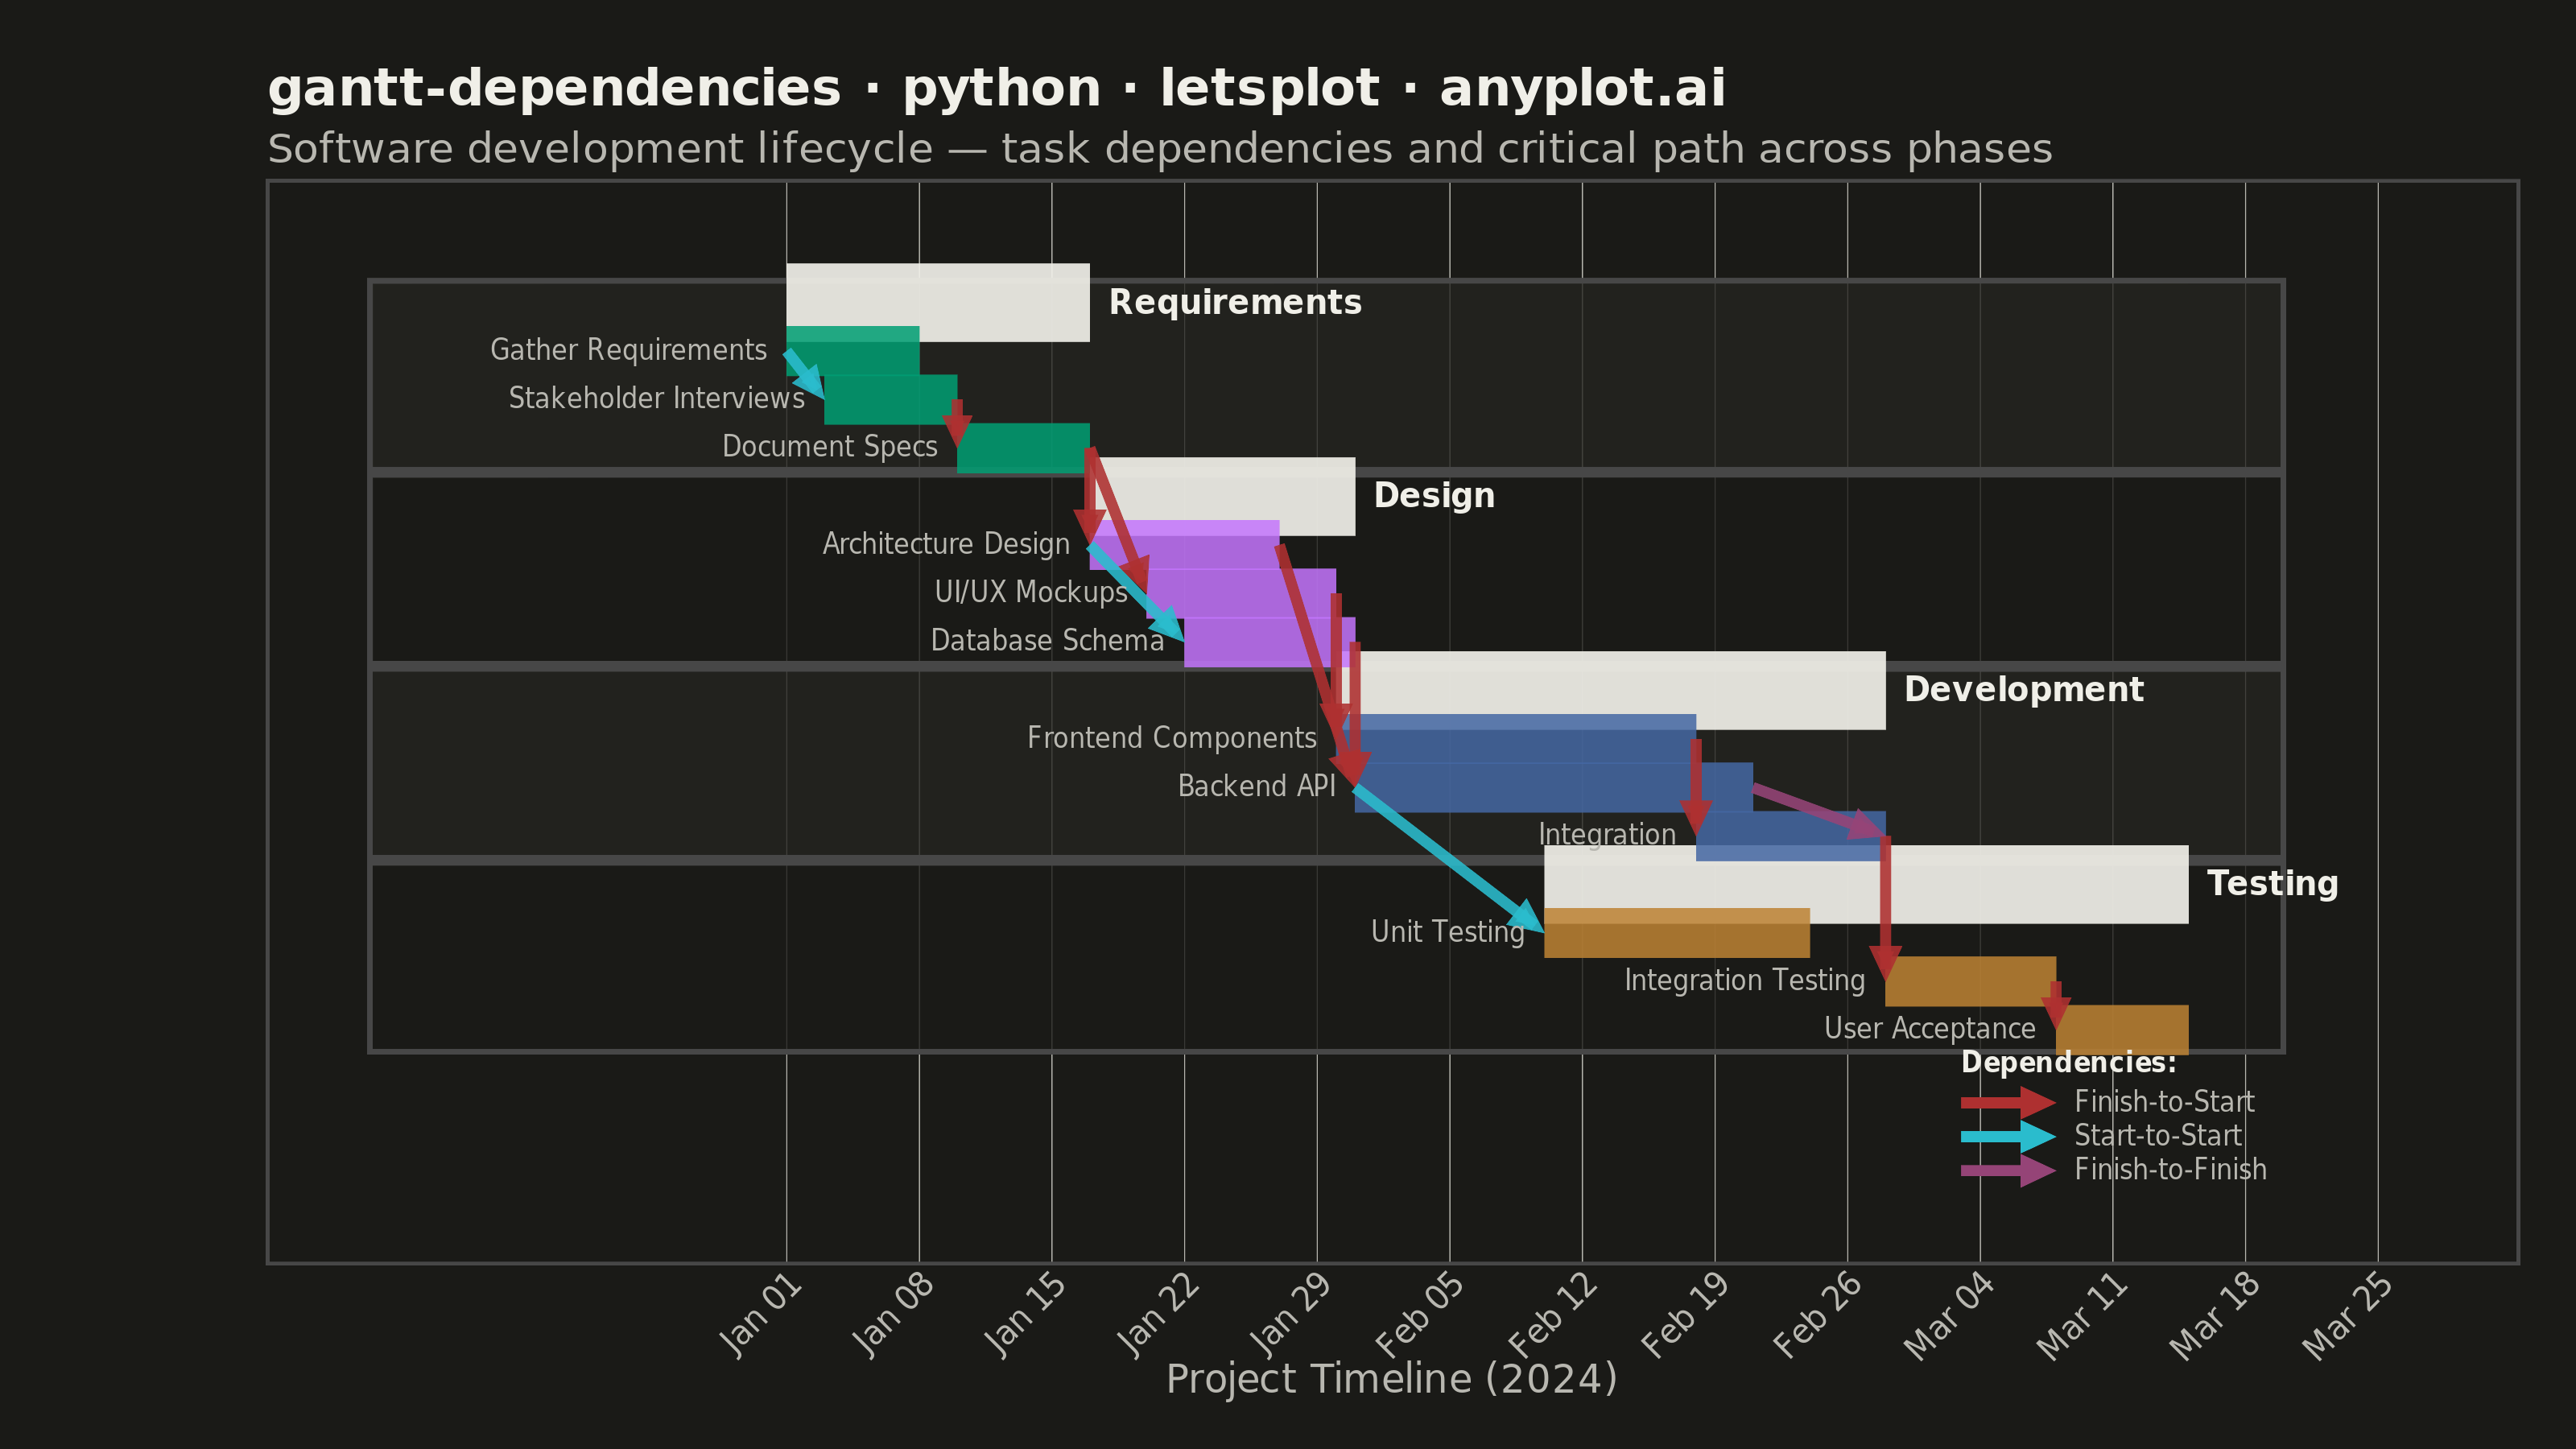
A Gantt chart that visualizes project schedules with task dependencies and groupings. Beyond displaying task timelines, this chart shows relationships between tasks using connector arrows, indicating which tasks must complete before others can begin. Tasks can be organized into groups (phases or work packages) with aggregate timeline bars showing the span of each group. This visualization is essential for understanding critical paths and scheduling constraints in complex projects.
""" anyplot.ai
gantt-dependencies: Gantt Chart with Dependencies
Library: letsplot 4.10.1 | Python 3.13.13
Quality: 85/100 | Updated: 2026-06-02
"""

import os

import pandas as pd
from lets_plot import *
from lets_plot.export import ggsave


LetsPlot.setup_html()

# Theme-adaptive chrome — Imprint palette tokens
THEME = os.getenv("ANYPLOT_THEME", "light")
PAGE_BG = "#FAF8F1" if THEME == "light" else "#1A1A17"
ELEVATED_BG = "#FFFDF6" if THEME == "light" else "#242420"
INK = "#1A1A17" if THEME == "light" else "#F0EFE8"
INK_SOFT = "#4A4A44" if THEME == "light" else "#B8B7B0"

# Imprint categorical palette
IMPRINT_PALETTE = ["#009E73", "#C475FD", "#4467A3", "#BD8233", "#AE3030", "#2ABCCD", "#954477", "#99B314"]

# Group colors: Imprint palette positions 1–4
group_order = ["Requirements", "Design", "Development", "Testing"]
group_colors = {
    "Requirements": IMPRINT_PALETTE[0],  # brand green
    "Design": IMPRINT_PALETTE[1],  # lavender
    "Development": IMPRINT_PALETTE[2],  # blue
    "Testing": IMPRINT_PALETTE[3],  # ochre
}

# Dependency arrow colors: Imprint palette positions 5–7
dep_colors = {
    "finish-to-start": IMPRINT_PALETTE[4],  # matte red
    "start-to-start": IMPRINT_PALETTE[5],  # cyan
    "finish-to-finish": IMPRINT_PALETTE[6],  # rose
}

# Data — software development project with phases and dependencies
tasks_data = [
    # Requirements phase
    {
        "task": "Gather Requirements",
        "start": "2024-01-01",
        "end": "2024-01-08",
        "group": "Requirements",
        "depends_on": [],
    },
    {
        "task": "Stakeholder Interviews",
        "start": "2024-01-03",
        "end": "2024-01-10",
        "group": "Requirements",
        "depends_on": [("Gather Requirements", "start-to-start")],
    },
    {
        "task": "Document Specs",
        "start": "2024-01-10",
        "end": "2024-01-17",
        "group": "Requirements",
        "depends_on": [("Stakeholder Interviews", "finish-to-start")],
    },
    # Design phase
    {
        "task": "Architecture Design",
        "start": "2024-01-17",
        "end": "2024-01-27",
        "group": "Design",
        "depends_on": [("Document Specs", "finish-to-start")],
    },
    {
        "task": "UI/UX Mockups",
        "start": "2024-01-20",
        "end": "2024-01-30",
        "group": "Design",
        "depends_on": [("Document Specs", "finish-to-start")],
    },
    {
        "task": "Database Schema",
        "start": "2024-01-22",
        "end": "2024-01-31",
        "group": "Design",
        "depends_on": [("Architecture Design", "start-to-start")],
    },
    # Development phase
    {
        "task": "Backend API",
        "start": "2024-01-31",
        "end": "2024-02-21",
        "group": "Development",
        "depends_on": [("Database Schema", "finish-to-start"), ("Architecture Design", "finish-to-start")],
    },
    {
        "task": "Frontend Components",
        "start": "2024-01-30",
        "end": "2024-02-18",
        "group": "Development",
        "depends_on": [("UI/UX Mockups", "finish-to-start")],
    },
    {
        "task": "Integration",
        "start": "2024-02-18",
        "end": "2024-02-28",
        "group": "Development",
        "depends_on": [("Backend API", "finish-to-finish"), ("Frontend Components", "finish-to-start")],
    },
    # Testing phase
    {
        "task": "Unit Testing",
        "start": "2024-02-10",
        "end": "2024-02-24",
        "group": "Testing",
        "depends_on": [("Backend API", "start-to-start")],
    },
    {
        "task": "Integration Testing",
        "start": "2024-02-28",
        "end": "2024-03-08",
        "group": "Testing",
        "depends_on": [("Integration", "finish-to-start")],
    },
    {
        "task": "User Acceptance",
        "start": "2024-03-08",
        "end": "2024-03-15",
        "group": "Testing",
        "depends_on": [("Integration Testing", "finish-to-start")],
    },
]

df = pd.DataFrame(tasks_data)
df["start"] = pd.to_datetime(df["start"])
df["end"] = pd.to_datetime(df["end"])

# Build y positions — reading order top-to-bottom, then flipped for chart
y_positions = {}
task_info = {}
reading_order = []

for group in group_order:
    group_tasks = df[df["group"] == group]
    reading_order.append(group)
    task_info[group] = {
        "start": group_tasks["start"].min(),
        "end": group_tasks["end"].max(),
        "is_group": True,
        "group": group,
    }
    for _, row in group_tasks.sort_values("start").iterrows():
        reading_order.append(row["task"])
        task_info[row["task"]] = {
            "start": row["start"],
            "end": row["end"],
            "is_group": False,
            "group": row["group"],
            "depends_on": row["depends_on"],
        }

n = len(reading_order)
for i, name in enumerate(reading_order):
    y_positions[name] = n - 1 - i

# Prepare plot DataFrames
plot_data = []
for name, y in y_positions.items():
    info = task_info[name]
    plot_data.append(
        {
            "task": name,
            "y": y,
            "start": info["start"],
            "end": info["end"],
            "is_group": info["is_group"],
            "group": info["group"],
            "duration": (info["end"] - info["start"]).days,
        }
    )

plot_df = pd.DataFrame(plot_data)
groups_df = plot_df[plot_df["is_group"]]
tasks_df = plot_df[~plot_df["is_group"]]

# Build dependency arrows
arrows_data = []
for task_name, info in task_info.items():
    if info["is_group"] or not info.get("depends_on"):
        continue
    for dep_name, dep_type in info["depends_on"]:
        if dep_name not in task_info:
            continue
        dep_info = task_info[dep_name]
        if dep_type == "start-to-start":
            x_from, x_to = dep_info["start"], info["start"]
        elif dep_type == "finish-to-finish":
            x_from, x_to = dep_info["end"], info["end"]
        else:
            x_from, x_to = dep_info["end"], info["start"]
        arrows_data.append(
            {
                "x": x_from,
                "y": y_positions[dep_name],
                "xend": x_to,
                "yend": y_positions[task_name],
                "dep_type": dep_type,
                "from_task": dep_name,
                "to_task": task_name,
            }
        )

arrows_df = pd.DataFrame(arrows_data) if arrows_data else None

# Build plot
x_min = plot_df["start"].min()
x_max = plot_df["end"].max()

plot = ggplot()

# Alternating background bands (theme-adaptive warm tones)
band_even = "#EDECEA" if THEME == "light" else ELEVATED_BG
band_odd = PAGE_BG

for i, group in enumerate(group_order):
    group_task_ys = [y_positions[t] for t, info in task_info.items() if info["group"] == group]
    y_lo = min(group_task_ys) - 0.45
    y_hi = max(group_task_ys) + 0.45
    band_color = band_even if i % 2 == 0 else band_odd
    band_df = pd.DataFrame(
        [{"xmin": x_min - pd.Timedelta(days=22), "xmax": x_max + pd.Timedelta(days=5), "ymin": y_lo, "ymax": y_hi}]
    )
    plot += geom_rect(aes(xmin="xmin", xmax="xmax", ymin="ymin", ymax="ymax"), data=band_df, fill=band_color, alpha=0.8)

# Group header bars (full phase span, ink color)
plot += geom_segment(
    aes(x="start", xend="end", y="y", yend="y"),
    data=groups_df,
    size=11,
    color=INK,
    alpha=0.92,
    tooltips=layer_tooltips().title("@task").line("@start — @end").line("Duration: @duration days"),
)

# Task bars — color mapped to group via Imprint palette
task_tooltips = (
    layer_tooltips().title("@task").line("@start — @end").line("Group: @group").line("Duration: @duration days")
)
plot += geom_segment(
    aes(x="start", xend="end", y="y", yend="y", color="group"),
    data=tasks_df,
    size=7,
    alpha=0.85,
    tooltips=task_tooltips,
    show_legend=False,
)
plot += scale_color_manual(values=[group_colors[g] for g in group_order], breaks=group_order)

# Dependency arrows — three types, each in a distinct Imprint hue
if arrows_df is not None and not arrows_df.empty:
    for dep_type, color in dep_colors.items():
        type_df = arrows_df[arrows_df["dep_type"] == dep_type]
        if not type_df.empty:
            plot += geom_segment(
                aes(x="x", xend="xend", y="y", yend="yend"),
                data=type_df,
                size=1.5,
                color=color,
                alpha=0.88,
                arrow=arrow(angle=25, length=6, type="closed"),
                tooltips=layer_tooltips().line("@from_task → @to_task").line("Type: @dep_type"),
            )

# Labels: group names right of bars (bold), task names left of bars
label_offset = pd.Timedelta(days=1)
group_labels = groups_df.assign(label_x=groups_df["end"] + label_offset)
task_labels_df = tasks_df.assign(label_x=tasks_df["start"] - label_offset)

plot += geom_text(aes(x="label_x", y="y", label="task"), data=group_labels, hjust=0, size=5, fontface="bold", color=INK)
plot += geom_text(aes(x="label_x", y="y", label="task"), data=task_labels_df, hjust=1, size=4, color=INK_SOFT)

# Dependency legend (consolidated DataFrames)
legend_x = x_max - pd.Timedelta(days=12)
legend_xend = legend_x + pd.Timedelta(days=5)
legend_text_x = legend_xend + pd.Timedelta(days=1)
legend_entries = [
    ("Finish-to-Start", "finish-to-start", -1.5),
    ("Start-to-Start", "start-to-start", -2.2),
    ("Finish-to-Finish", "finish-to-finish", -2.9),
]

plot += geom_text(
    aes(x="x", y="y", label="label"),
    data=pd.DataFrame([{"x": legend_x, "y": -0.7, "label": "Dependencies:"}]),
    hjust=0,
    size=4,
    fontface="bold",
    color=INK,
)

legend_seg_df = pd.DataFrame(
    [{"x": legend_x, "xend": legend_xend, "y": y, "dep_type": dt} for _, dt, y in legend_entries]
)
for dep_type, color in dep_colors.items():
    seg = legend_seg_df[legend_seg_df["dep_type"] == dep_type]
    if not seg.empty:
        plot += geom_segment(
            aes(x="x", xend="xend", y="y", yend="y"),
            data=seg,
            size=1.5,
            color=color,
            arrow=arrow(angle=25, length=6, type="closed"),
        )

plot += geom_text(
    aes(x="x", y="y", label="label"),
    data=pd.DataFrame([{"x": legend_text_x, "y": y, "label": label} for label, _, y in legend_entries]),
    hjust=0,
    size=4,
    color=INK_SOFT,
)

# Scales
x_breaks = pd.date_range(start=x_min, end=x_max + pd.Timedelta(days=10), freq="W-MON").tolist()
plot += scale_x_datetime(
    format="%b %d", limits=[x_min - pd.Timedelta(days=22), x_max + pd.Timedelta(days=12)], breaks=x_breaks
)
plot += scale_y_continuous(breaks=[], labels=[], limits=[-3.8, n + 0.5])
plot += labs(
    x="Project Timeline (2024)",
    y="",
    title="gantt-dependencies · python · letsplot · anyplot.ai",
    subtitle="Software development lifecycle — task dependencies and critical path across phases",
)

# Theme — canvas 800×450, saved at scale=4 → 3200×1800 px
plot += theme_minimal()
plot += theme(
    plot_background=element_rect(fill=PAGE_BG, color=PAGE_BG),
    panel_background=element_rect(fill=PAGE_BG),
    axis_title_x=element_text(size=12, color=INK_SOFT),
    axis_title_y=element_blank(),
    axis_text_x=element_text(size=10, angle=45, color=INK_SOFT),
    axis_text_y=element_blank(),
    plot_title=element_text(size=16, face="bold", color=INK),
    plot_subtitle=element_text(size=13, color=INK_SOFT),
    panel_grid_major_y=element_blank(),
    panel_grid_minor=element_blank(),
    panel_grid_major_x=element_line(color=INK_SOFT, size=0.3),
    panel_border=element_blank(),
    plot_margin=[20, 15, 15, 80],
)
plot += ggsize(800, 450)

# Save — PNG at scale=4 (3200×1800) + interactive HTML
ggsave(plot, f"plot-{THEME}.png", path=".", scale=4)
ggsave(plot, f"plot-{THEME}.html", path=".")
Runnable source as JSON, for any HTTP client: https://api.anyplot.ai/specs/gantt-dependencies/letsplot/code. Any spec id and library id listed in llms-full.txt fit the same URL shape; every URL below is complete and callable.
{
  "spec_id": "gantt-dependencies",
  "language": "python",
  "library": "letsplot",
  "page": "https://anyplot.ai/gantt-dependencies/python/letsplot",
  "hub": "https://anyplot.ai/gantt-dependencies",
  "code_json": "https://api.anyplot.ai/specs/gantt-dependencies/letsplot/code",
  "spec_json": "https://api.anyplot.ai/specs/gantt-dependencies",
  "render_light_png": "https://storage.googleapis.com/anyplot-images/plots/gantt-dependencies/python/letsplot/plot-light.png",
  "render_dark_png": "https://storage.googleapis.com/anyplot-images/plots/gantt-dependencies/python/letsplot/plot-dark.png",
  "interactive_light_html": "https://storage.googleapis.com/anyplot-images/plots/gantt-dependencies/python/letsplot/plot-light.html",
  "interactive_dark_html": "https://storage.googleapis.com/anyplot-images/plots/gantt-dependencies/python/letsplot/plot-dark.html",
  "quality_score": 85.0,
  "license": "MIT",
  "guide": "https://anyplot.ai/llms.txt"
}
Part of Gantt Chart with Dependencies on anyplot.ai.