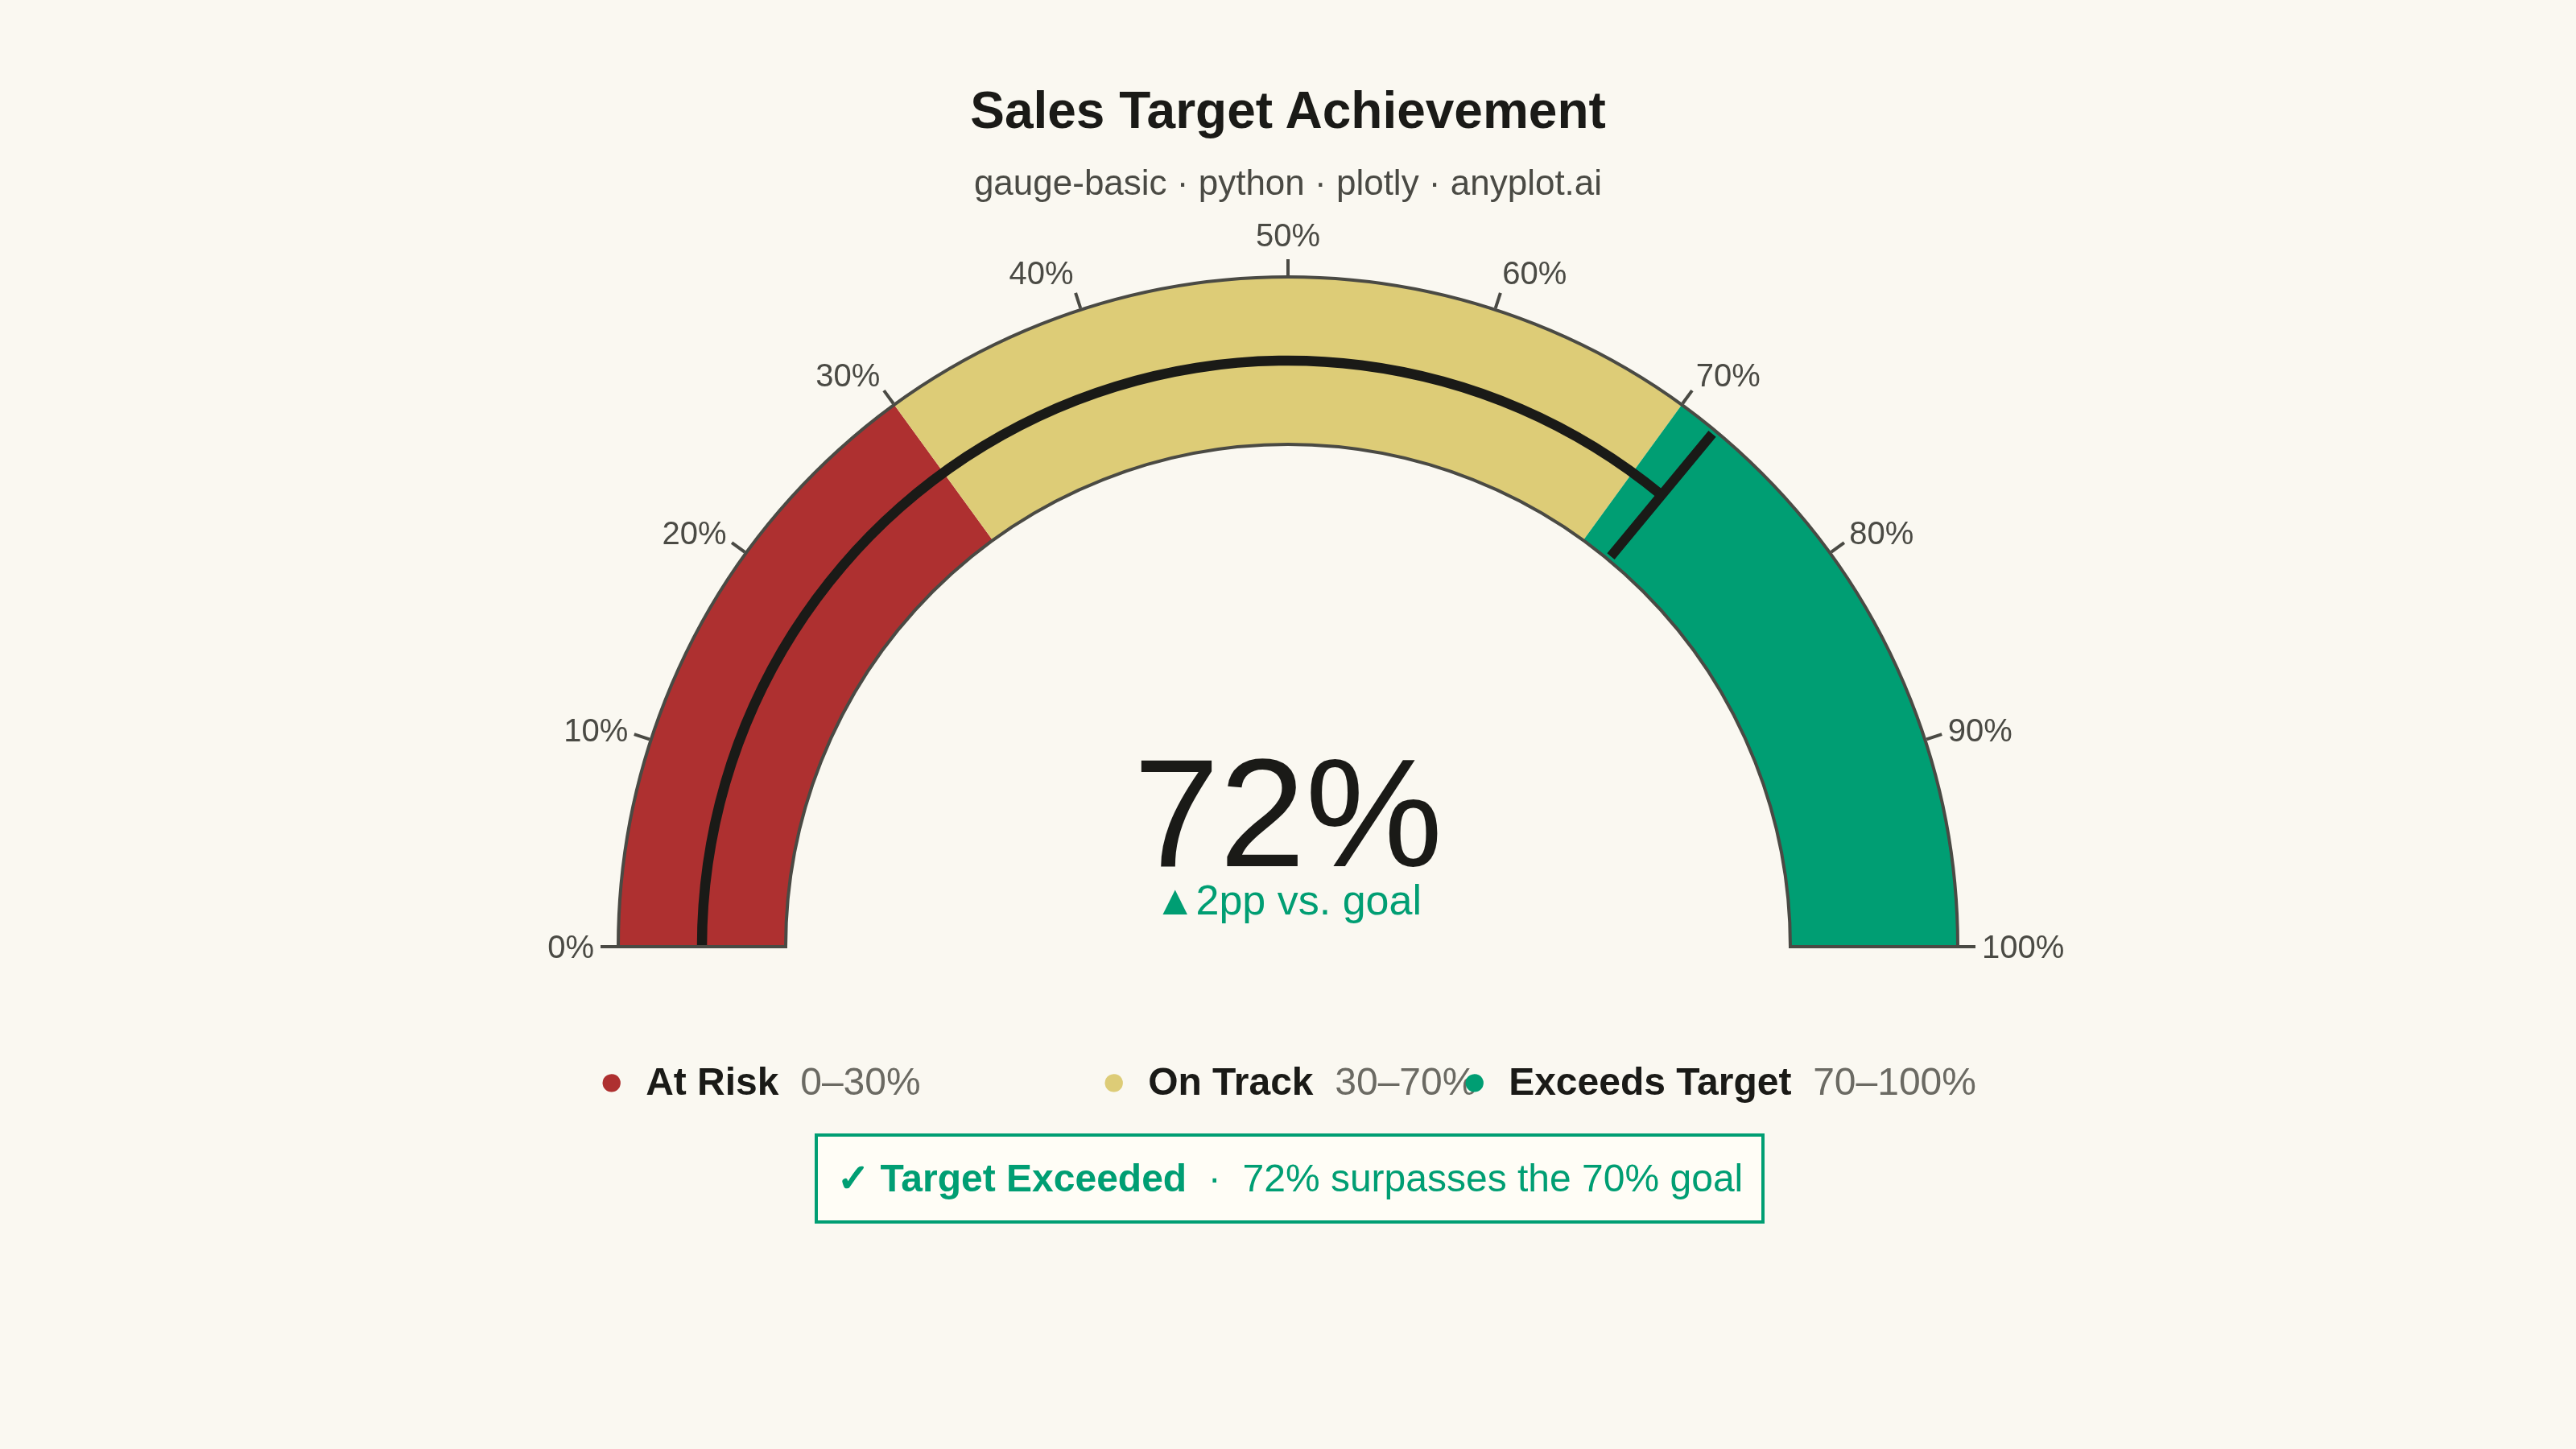
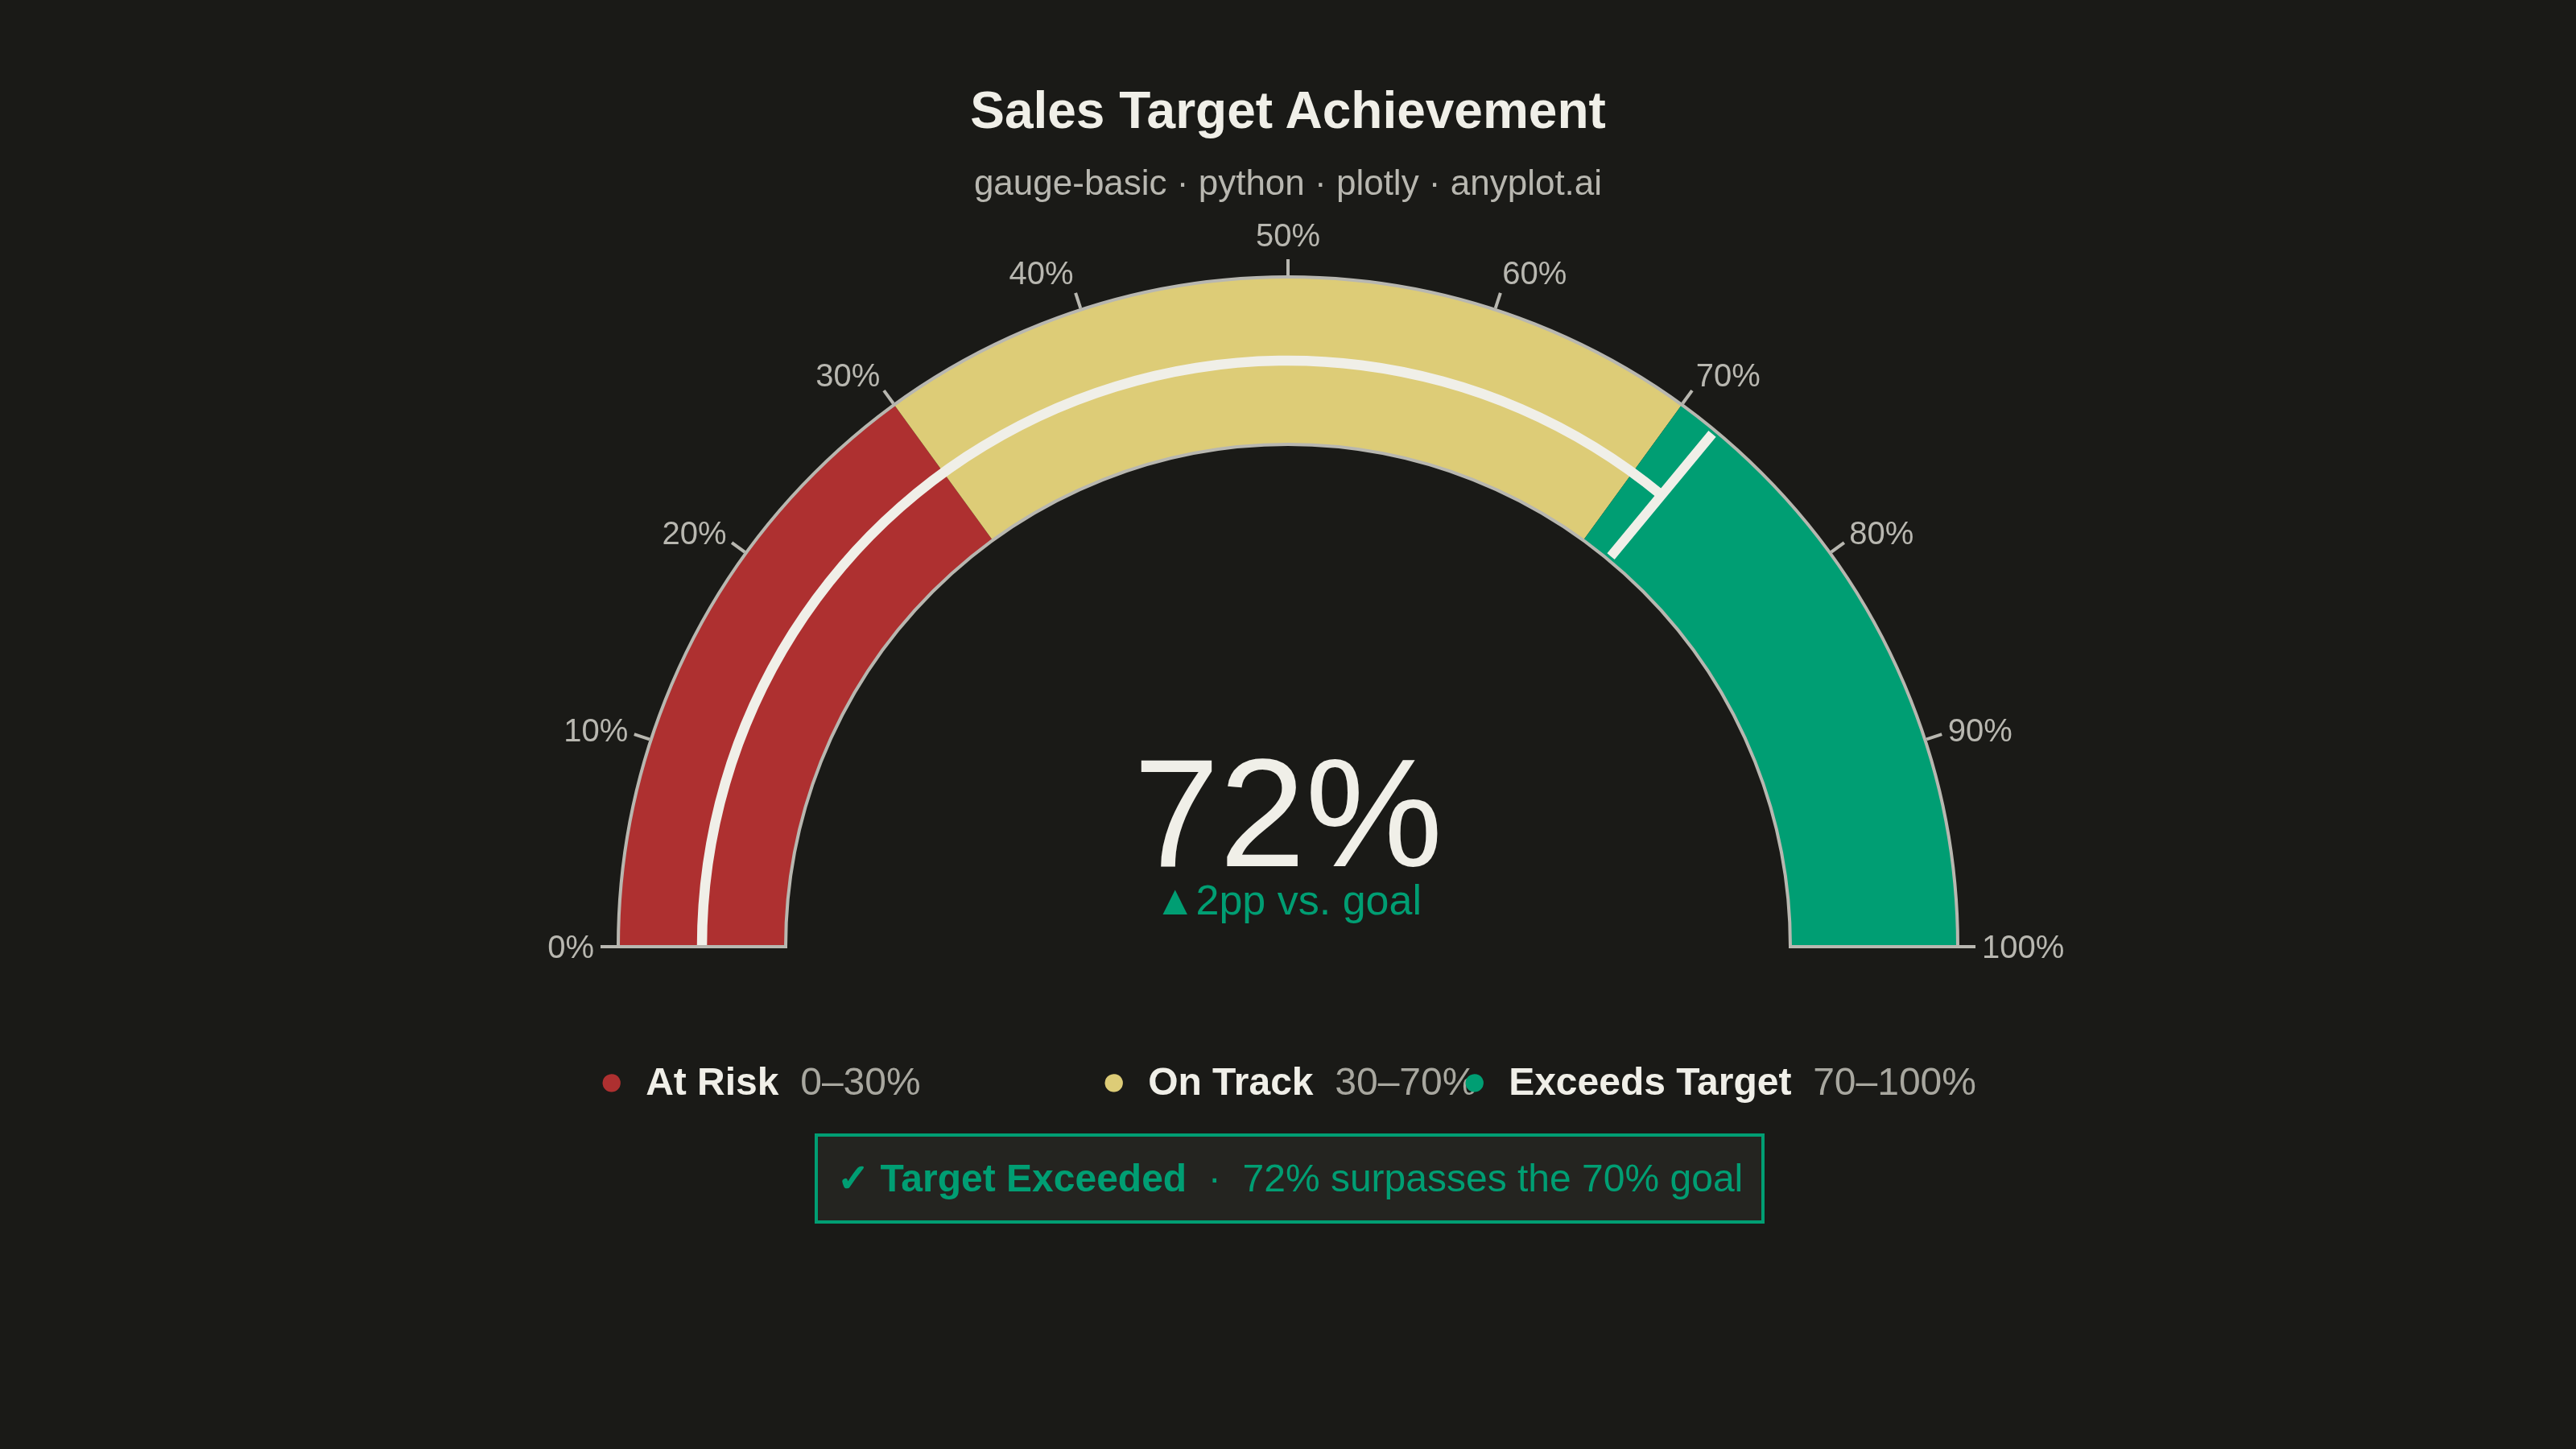
A gauge chart (also known as a speedometer chart) displays a single value within a defined range using a semi-circular or circular dial. It is ideal for showing progress toward a goal, performance metrics, or any KPI that needs to be evaluated against minimum and maximum bounds. The visual metaphor of a speedometer makes it intuitive to quickly assess whether a value is in an acceptable range.
Preview render from the Plotly implementation.