The same plot in 14 other libraries — JavaScript: D3.js, Apache ECharts, Highcharts, MUI X Charts; Python: Altair, Bokeh, lets-plot, Matplotlib, Plotly, plotnine, Pygal, Seaborn; R: ggplot2; Julia: Makie.jl. Compare all 15 side by side: Basic Gauge Chart in Python, R, Julia and JavaScript.
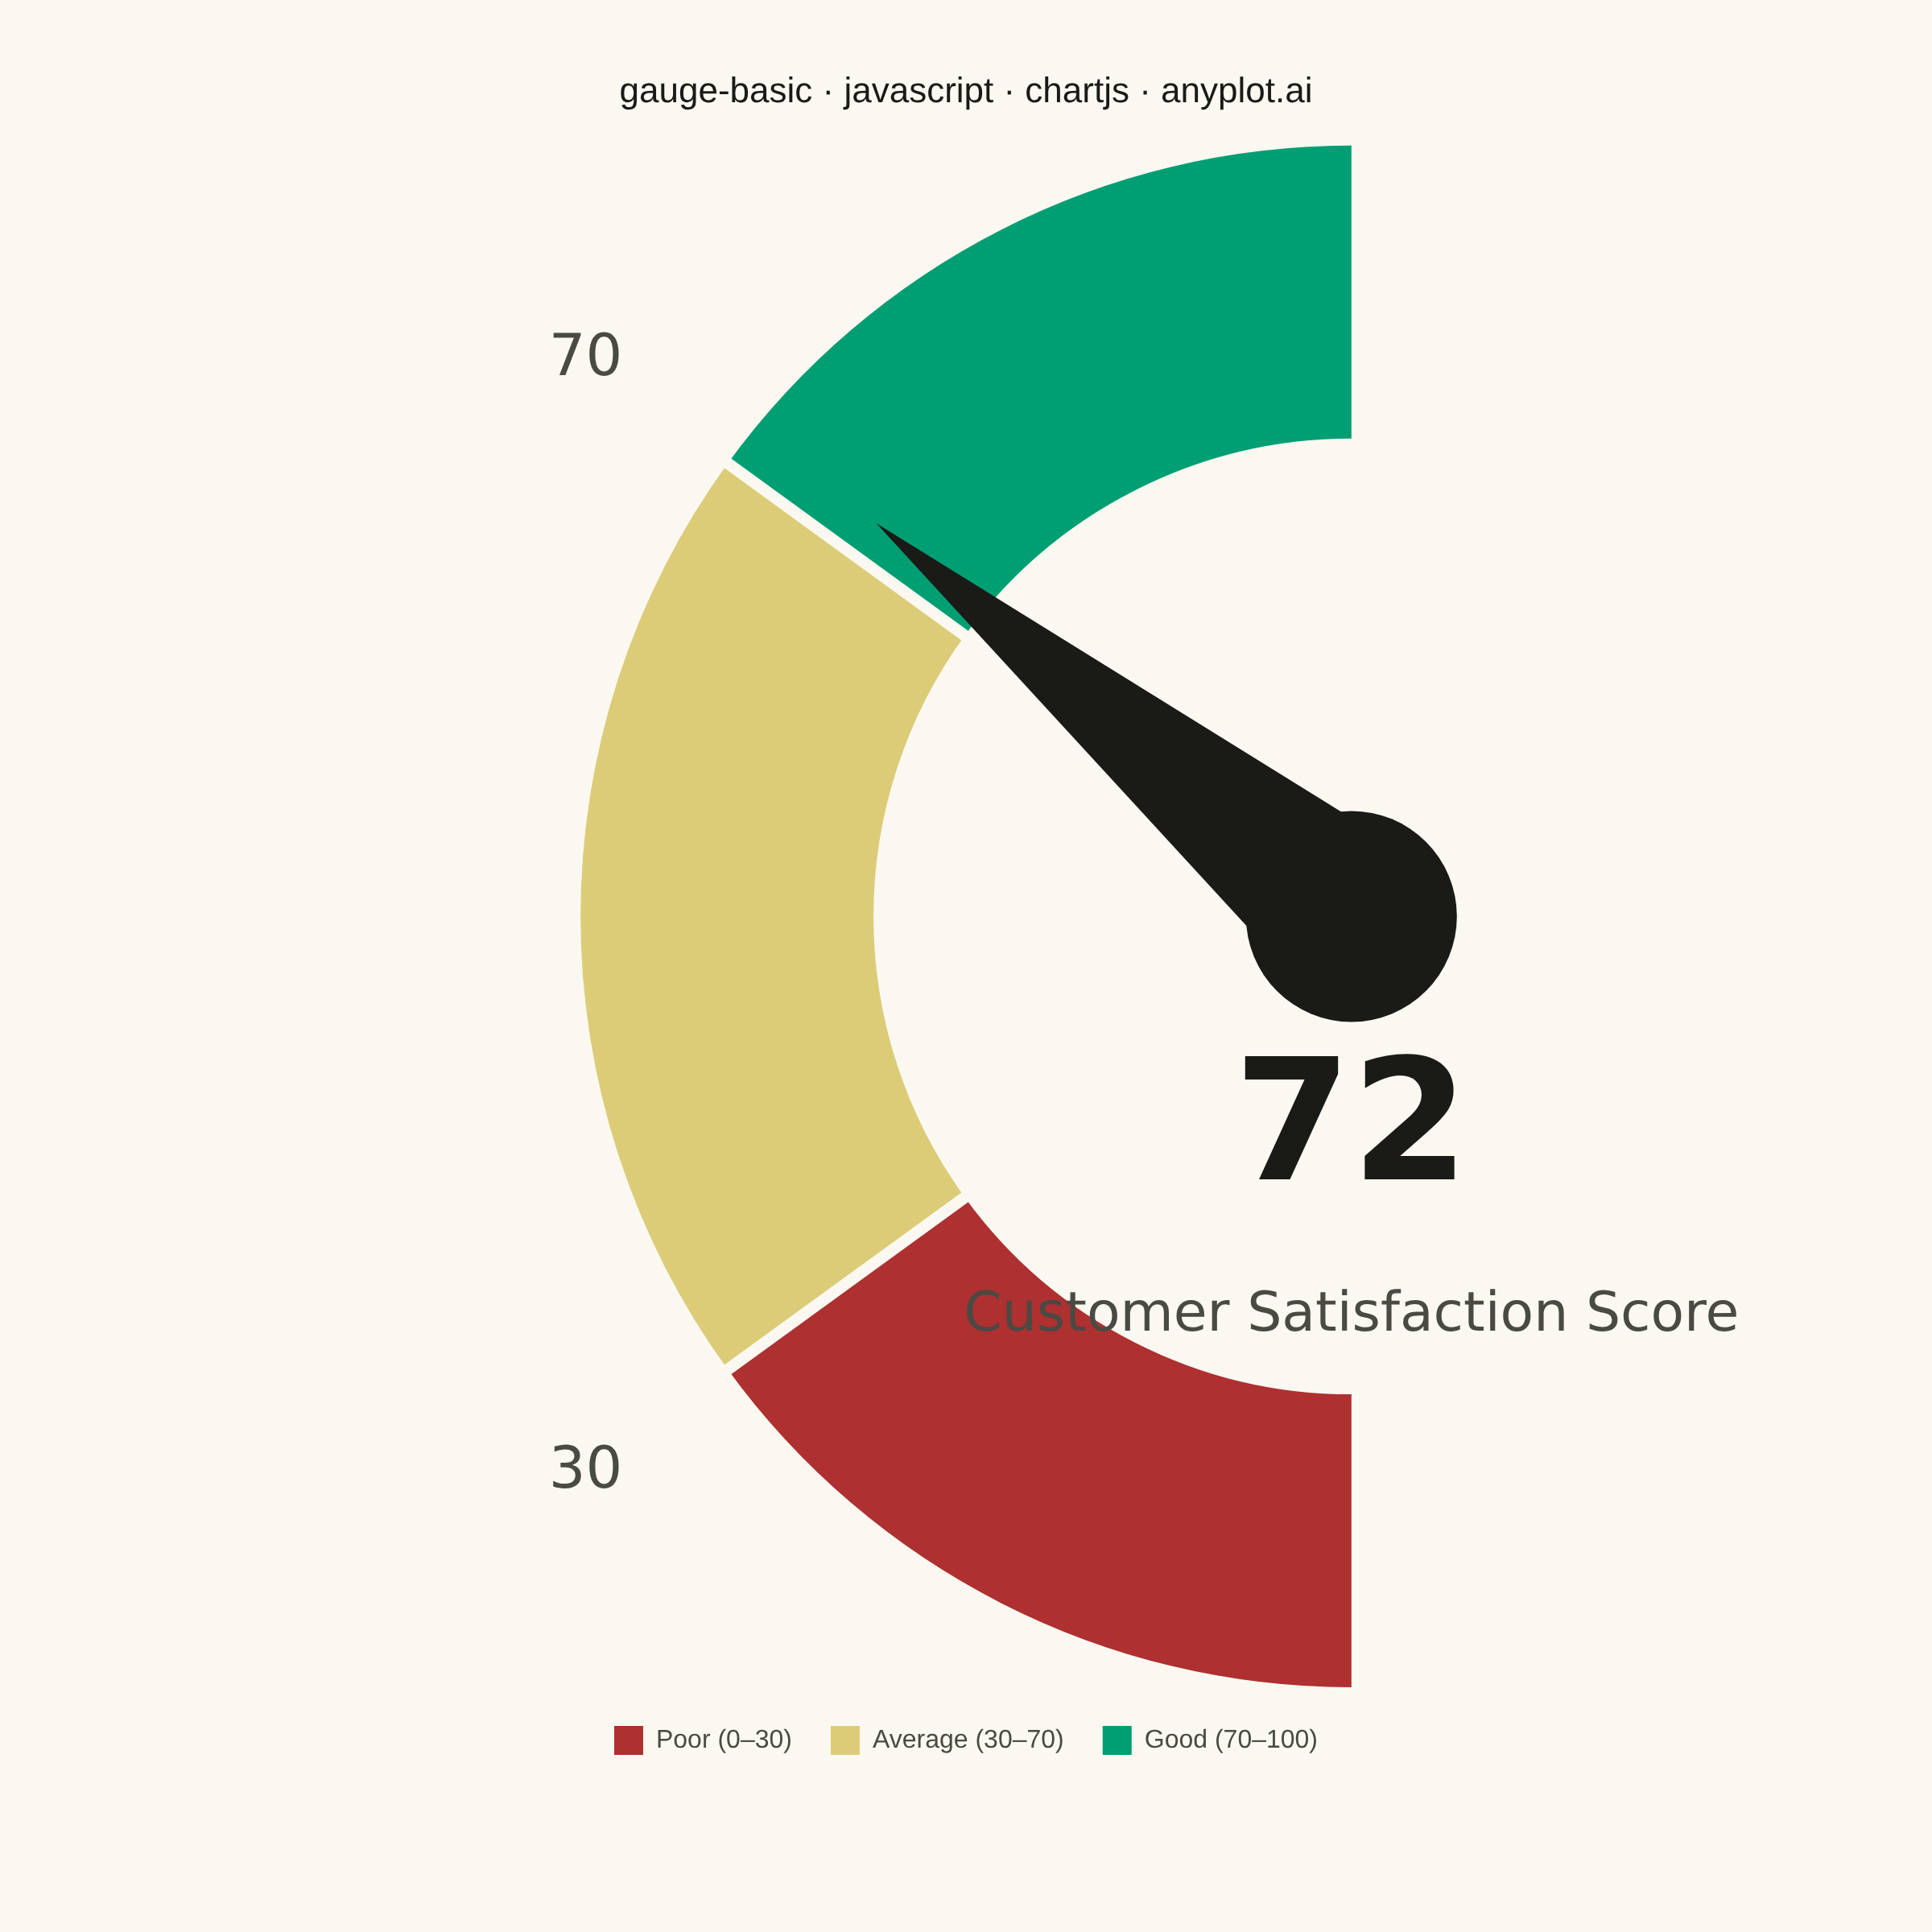
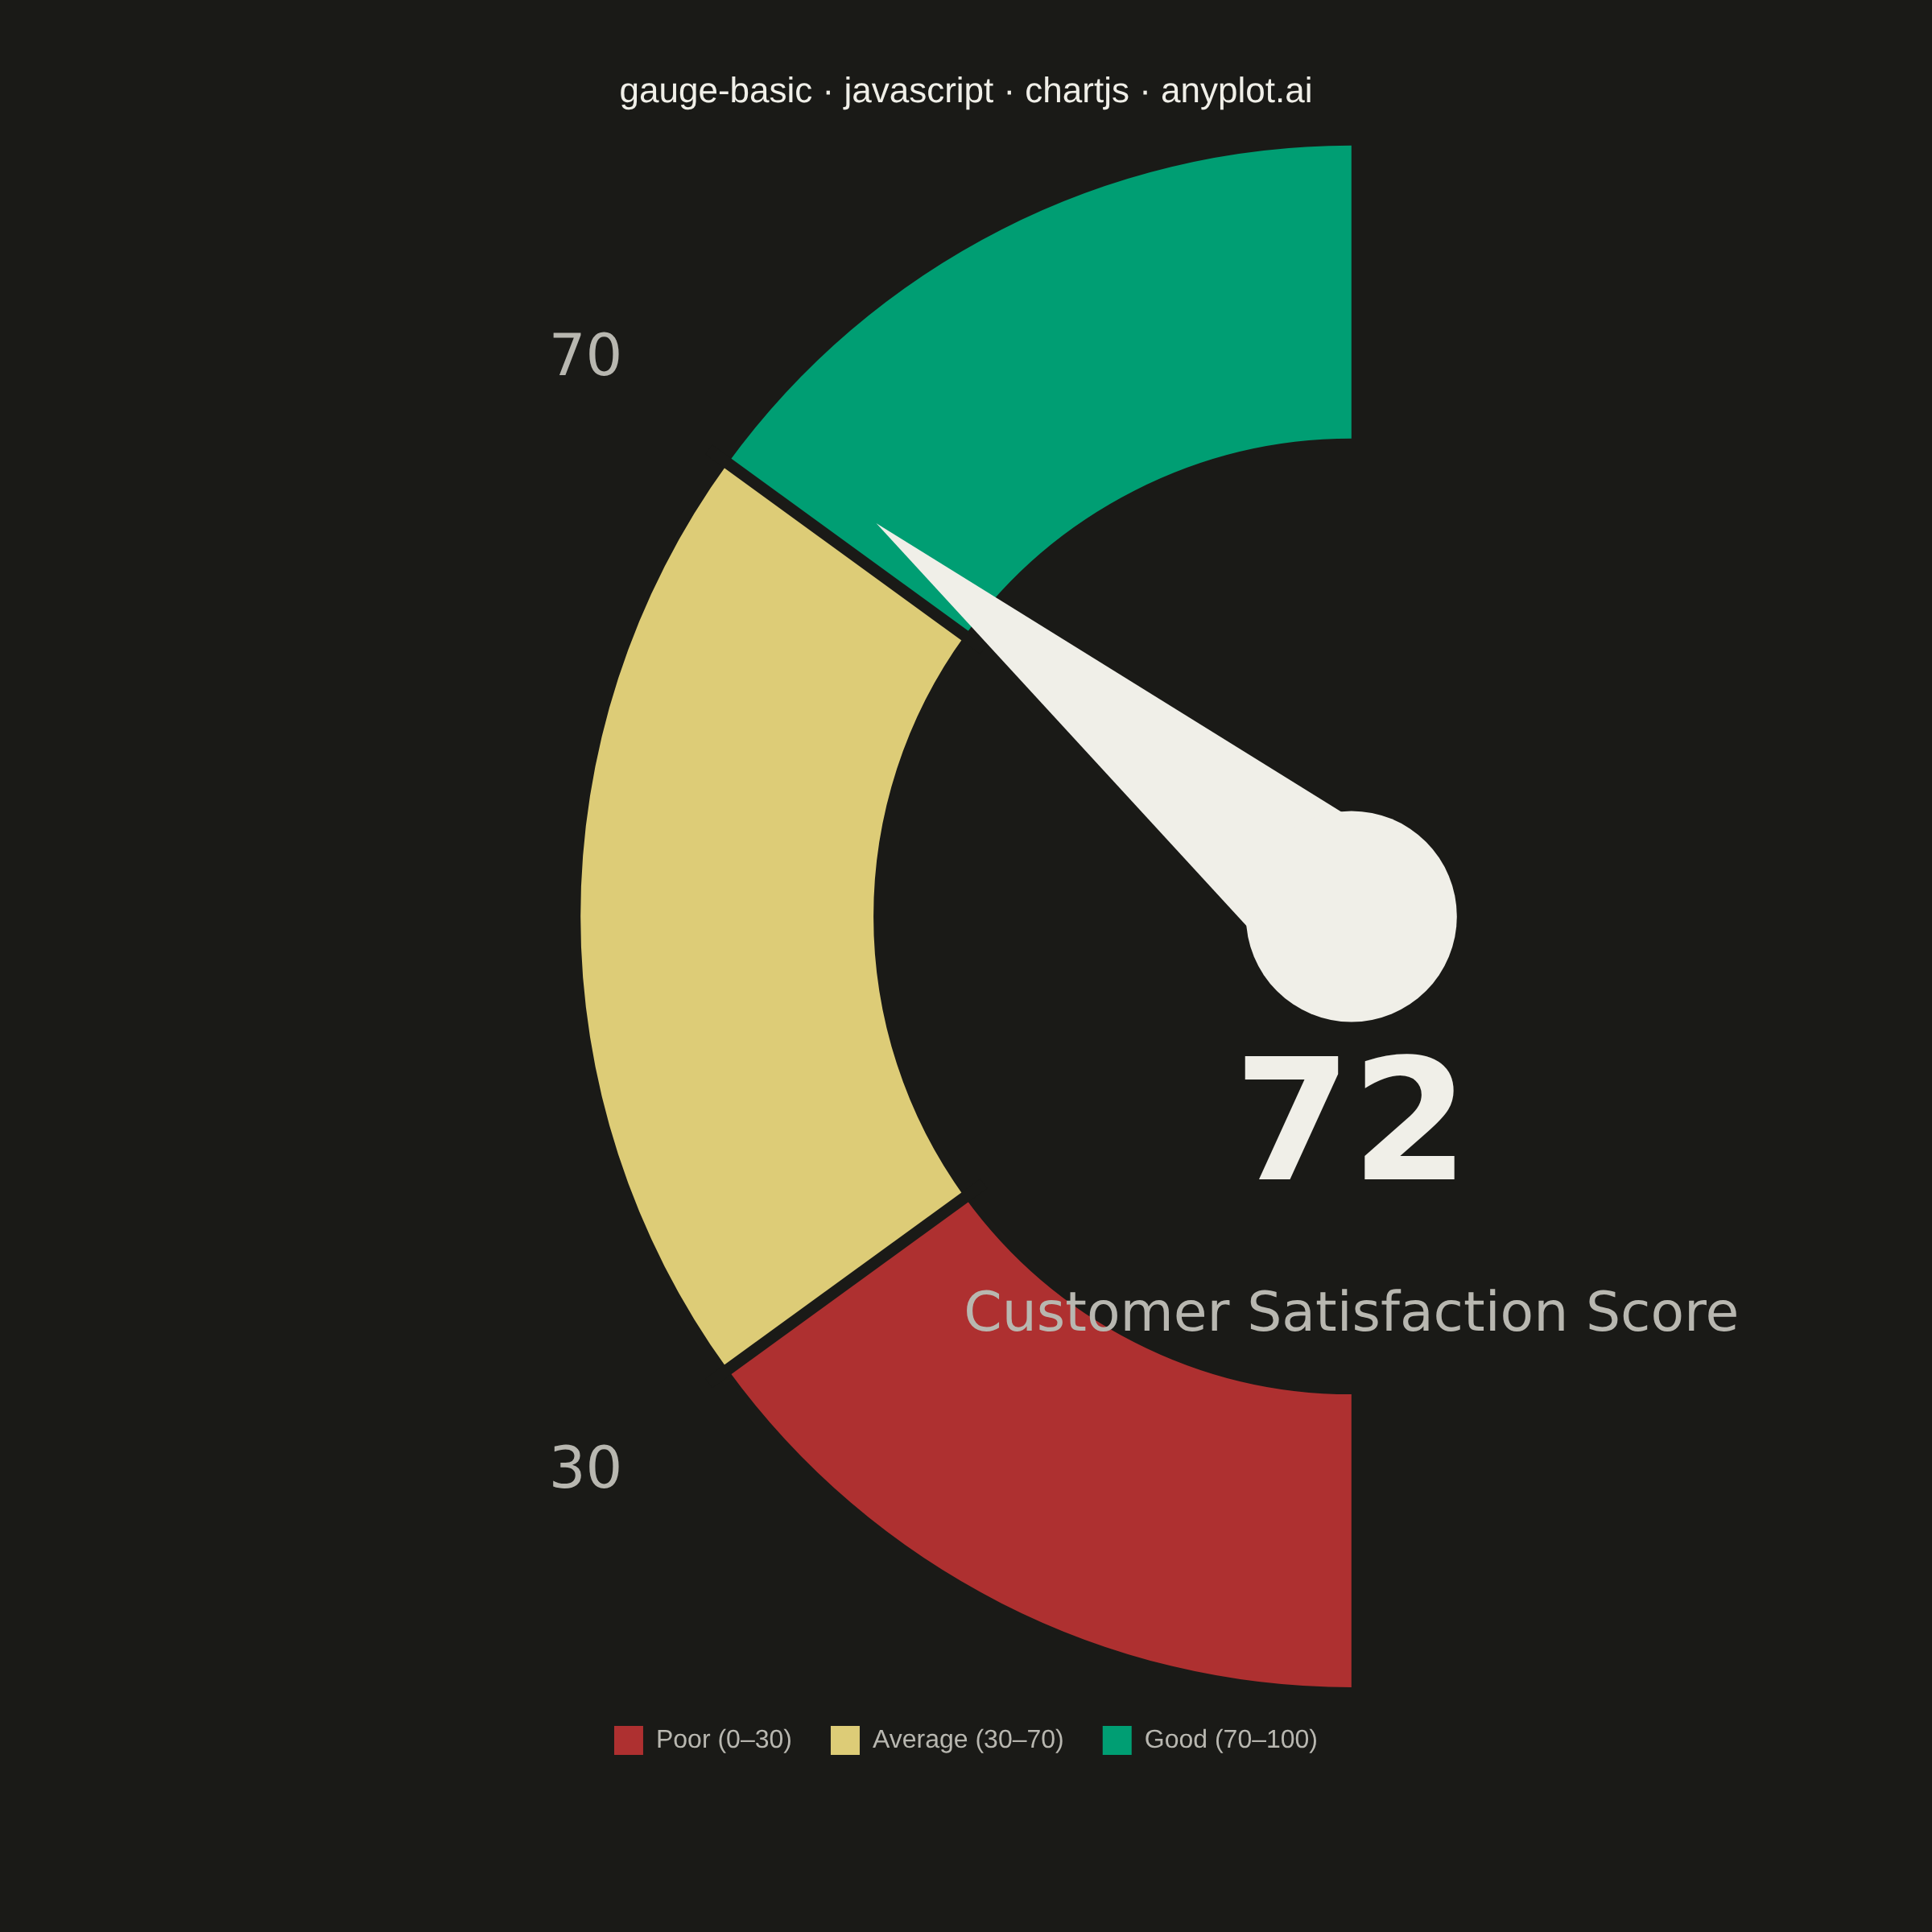
A gauge chart (also known as a speedometer chart) displays a single value within a defined range using a semi-circular or circular dial. It is ideal for showing progress toward a goal, performance metrics, or any KPI that needs to be evaluated against minimum and maximum bounds. The visual metaphor of a speedometer makes it intuitive to quickly assess whether a value is in an acceptable range.
// anyplot.ai
// gauge-basic: Basic Gauge Chart
// Library: chartjs 4.4.7 | JavaScript 22.23.0
// Quality: 90/100 | Created: 2026-06-30

//# anyplot-orientation: square

const t = window.ANYPLOT_TOKENS;

// --- Data -------------------------------------------------------------------
const value = 72;
const minVal = 0;
const maxVal = 100;
const thresholds = [30, 70];
const metricLabel = "Customer Satisfaction Score";

// Zone sizes (proportion of range)
const zone1Size = thresholds[0] - minVal;         // 30: Poor
const zone2Size = thresholds[1] - thresholds[0];  // 40: Average
const zone3Size = maxVal - thresholds[1];         // 30: Good

// Semantic color exception: red/amber/green = bad/caution/good
const COLOR_POOR = "#AE3030";
const COLOR_AVG  = "#DDCC77";
const COLOR_GOOD = "#009E73";

// Arc math: rotation:180 shifts default start angle by +180°.
// Default start = -90° (top). After shift: -90°+180° = +90° (bottom).
// Arc goes clockwise from 90° (bottom, min) → 180° (left) → 270° (top, max).
// Angle for any fraction = PI/2 + fraction * PI (in radians, canvas convention).
function arcAngle(frac) {
  return Math.PI / 2 + frac * Math.PI;
}

// --- Needle Plugin ----------------------------------------------------------
const needlePlugin = {
  id: "needlePlugin",
  afterDatasetsDraw(chart) {
    const { ctx } = chart;
    const meta = chart.getDatasetMeta(0);
    const arc0 = meta.data[0];
    const { x, y, innerRadius, outerRadius } = arc0.getProps(
      ["x", "y", "innerRadius", "outerRadius"],
      true
    );

    const bandWidth = outerRadius - innerRadius;
    const fraction  = (value - minVal) / (maxVal - minVal);
    const needleAngle = arcAngle(fraction);
    const needleLen = outerRadius * 0.80;
    const hubR      = bandWidth * 0.36;
    const baseW     = hubR * 0.80;
    const perp      = needleAngle + Math.PI / 2;

    ctx.save();

    // --- Needle body ---
    ctx.beginPath();
    ctx.moveTo(x + baseW * Math.cos(perp),  y + baseW * Math.sin(perp));
    ctx.lineTo(x + needleLen * Math.cos(needleAngle), y + needleLen * Math.sin(needleAngle));
    ctx.lineTo(x - baseW * Math.cos(perp),  y - baseW * Math.sin(perp));
    ctx.closePath();
    ctx.fillStyle = t.ink;
    ctx.fill();

    // --- Hub circle ---
    ctx.beginPath();
    ctx.arc(x, y, hubR, 0, 2 * Math.PI);
    ctx.fillStyle = t.ink;
    ctx.fill();

    // --- Threshold tick marks ---
    for (const thresh of thresholds) {
      const tf = (thresh - minVal) / (maxVal - minVal);
      const ta = arcAngle(tf);
      const innerR = innerRadius - bandWidth * 0.08;
      const outerR = outerRadius + bandWidth * 0.08;
      ctx.beginPath();
      ctx.moveTo(x + innerR * Math.cos(ta), y + innerR * Math.sin(ta));
      ctx.lineTo(x + outerR * Math.cos(ta), y + outerR * Math.sin(ta));
      ctx.strokeStyle = t.pageBg;
      ctx.lineWidth = Math.max(2, bandWidth * 0.04);
      ctx.stroke();

      // Threshold label just outside the outer arc edge
      const labelR = outerRadius + bandWidth * 0.60;
      const lx = x + labelR * Math.cos(ta);
      const ly = y + labelR * Math.sin(ta);
      ctx.font = `${Math.round(outerRadius * 0.075)}px system-ui, sans-serif`;
      ctx.fillStyle = t.inkSoft;
      ctx.textAlign = "center";
      ctx.textBaseline = "middle";
      ctx.fillText(`${thresh}`, lx, ly);
    }

    // --- Prominent value display (inside opening, below hub) ---
    const valSize = Math.round(outerRadius * 0.22);
    ctx.font = `bold ${valSize}px system-ui, sans-serif`;
    ctx.fillStyle = t.ink;
    ctx.textAlign = "center";
    ctx.textBaseline = "alphabetic";
    ctx.fillText(`${value}`, x, y + innerRadius * 0.55);

    // --- Metric label below value ---
    const lblSize = Math.round(outerRadius * 0.072);
    ctx.font = `${lblSize}px system-ui, sans-serif`;
    ctx.fillStyle = t.inkSoft;
    ctx.textBaseline = "top";
    ctx.fillText(metricLabel, x, y + innerRadius * 0.78);

    ctx.restore();
  },
};

// --- Mount ------------------------------------------------------------------
const canvas = document.createElement("canvas");
document.getElementById("container").appendChild(canvas);

// --- Chart ------------------------------------------------------------------
new Chart(canvas, {
  type: "doughnut",
  data: {
    labels: ["Poor (0–30)", "Average (30–70)", "Good (70–100)"],
    datasets: [{
      data: [zone1Size, zone2Size, zone3Size],
      backgroundColor: [COLOR_POOR, COLOR_AVG, COLOR_GOOD],
      borderWidth: 0,
    }],
  },
  options: {
    responsive: true,
    maintainAspectRatio: false,
    animation: false,
    rotation: 180,
    circumference: 180,
    cutout: "62%",
    layout: {
      padding: { top: 20, bottom: 100, left: 120, right: 120 },
    },
    plugins: {
      title: {
        display: true,
        text: "gauge-basic · javascript · chartjs · anyplot.ai",
        color: t.ink,
        font: { size: 22, weight: "500" },
        padding: { top: 24, bottom: 20 },
      },
      legend: {
        display: true,
        position: "bottom",
        labels: {
          color: t.inkSoft,
          font: { size: 16 },
          padding: 24,
          boxWidth: 18,
          boxHeight: 18,
        },
      },
      tooltip: { enabled: false },
    },
  },
  plugins: [needlePlugin],
});
Runnable source as JSON, for any HTTP client: https://api.anyplot.ai/specs/gauge-basic/chartjs/code. Any spec id and library id listed in llms-full.txt fit the same URL shape; every URL below is complete and callable.
{
  "spec_id": "gauge-basic",
  "language": "javascript",
  "library": "chartjs",
  "page": "https://anyplot.ai/gauge-basic/javascript/chartjs",
  "hub": "https://anyplot.ai/gauge-basic",
  "code_json": "https://api.anyplot.ai/specs/gauge-basic/chartjs/code",
  "spec_json": "https://api.anyplot.ai/specs/gauge-basic",
  "render_light_png": "https://storage.googleapis.com/anyplot-images/plots/gauge-basic/javascript/chartjs/plot-light.png",
  "render_dark_png": "https://storage.googleapis.com/anyplot-images/plots/gauge-basic/javascript/chartjs/plot-dark.png",
  "interactive_light_html": "https://storage.googleapis.com/anyplot-images/plots/gauge-basic/javascript/chartjs/plot-light.html",
  "interactive_dark_html": "https://storage.googleapis.com/anyplot-images/plots/gauge-basic/javascript/chartjs/plot-dark.html",
  "quality_score": 90.0,
  "license": "MIT",
  "guide": "https://anyplot.ai/llms.txt"
}
Part of Basic Gauge Chart on anyplot.ai.